
Market Overview
| Study Period | 2020 - 2031 |
|---|---|
| Forecast Data Period | 2026 - 2031 |
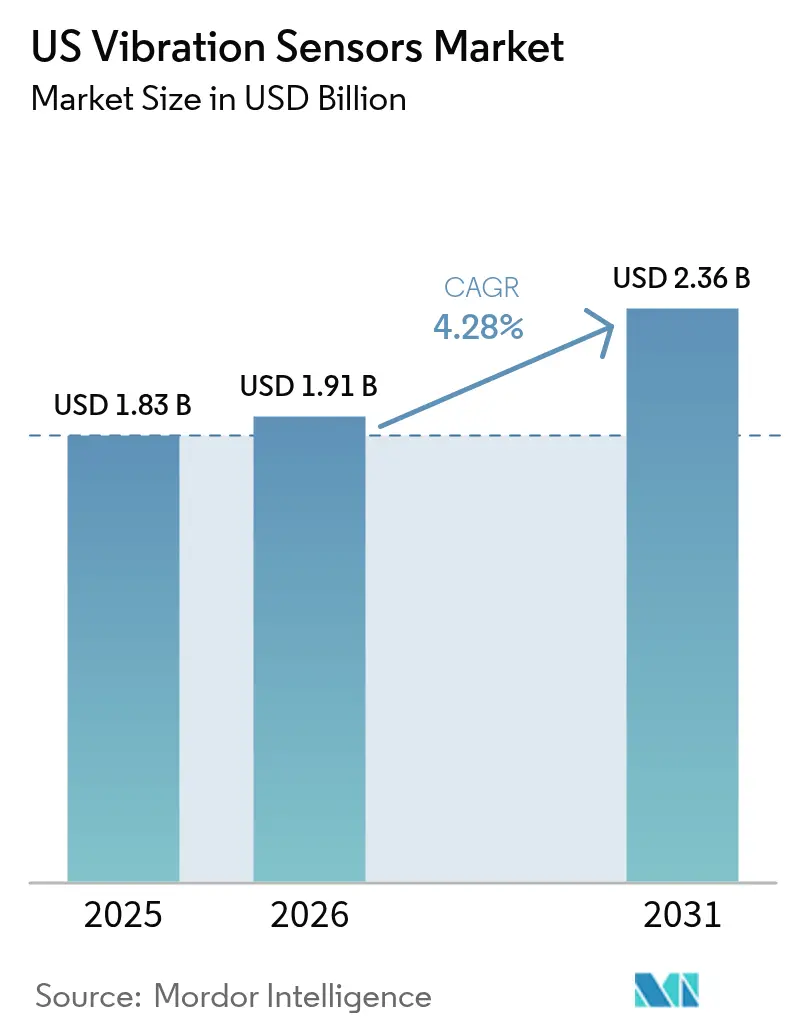
| Base Year Market Size (2025) | USD 1.83 Billion |
| Market Size (2026) | USD 1.91 Billion |
| Market Size (2031) | USD 2.36 Billion |
| Growth Rate (2026 - 2031) | 4.28% CAGR |
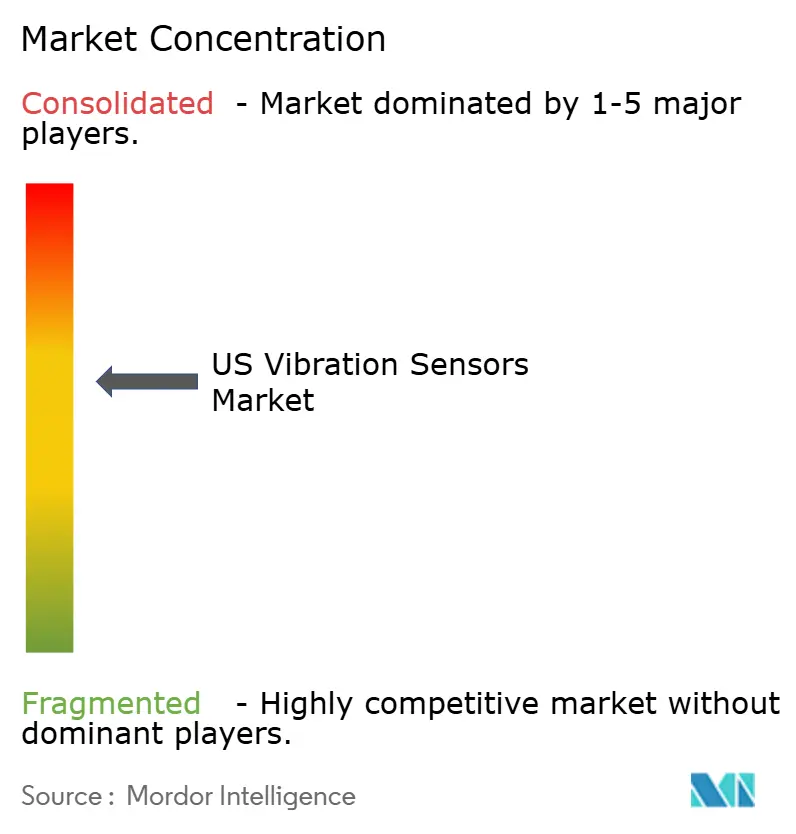
| Market Concentration | Medium |
Major Players.webp) *Disclaimer: Major Players sorted in no particular order Image © Mordor Intelligence. Reuse requires attribution under CC BY 4.0. | |
US Vibration Sensors Market Analysis by Mordor Intelligence
The United States vibration sensors market size was valued at USD 1.83 billion in 2025 and estimated to grow from USD 1.91 billion in 2026 to reach USD 2.36 billion by 2031, at a CAGR of 4.28% during the forecast period (2026-2031). The United States vibration sensors market is moving from volume expansion toward technology-driven value creation as end users adopt edge AI, wireless connectivity, and Industry 4.0 practices. Uptake of predictive analytics, compliance pressures from OSHA and API standards, and the need to limit unplanned downtime underpin steady demand growth. Wireless nodes, energy-harvesting designs, and MEMS-based accelerometers broaden deployment options across aging industrial assets. Suppliers differentiate through integrated solutions that bundle hardware with cloud analytics while forming ecosystem partnerships to address cybersecurity and legacy-system integration challenges.
Key Report Takeaways
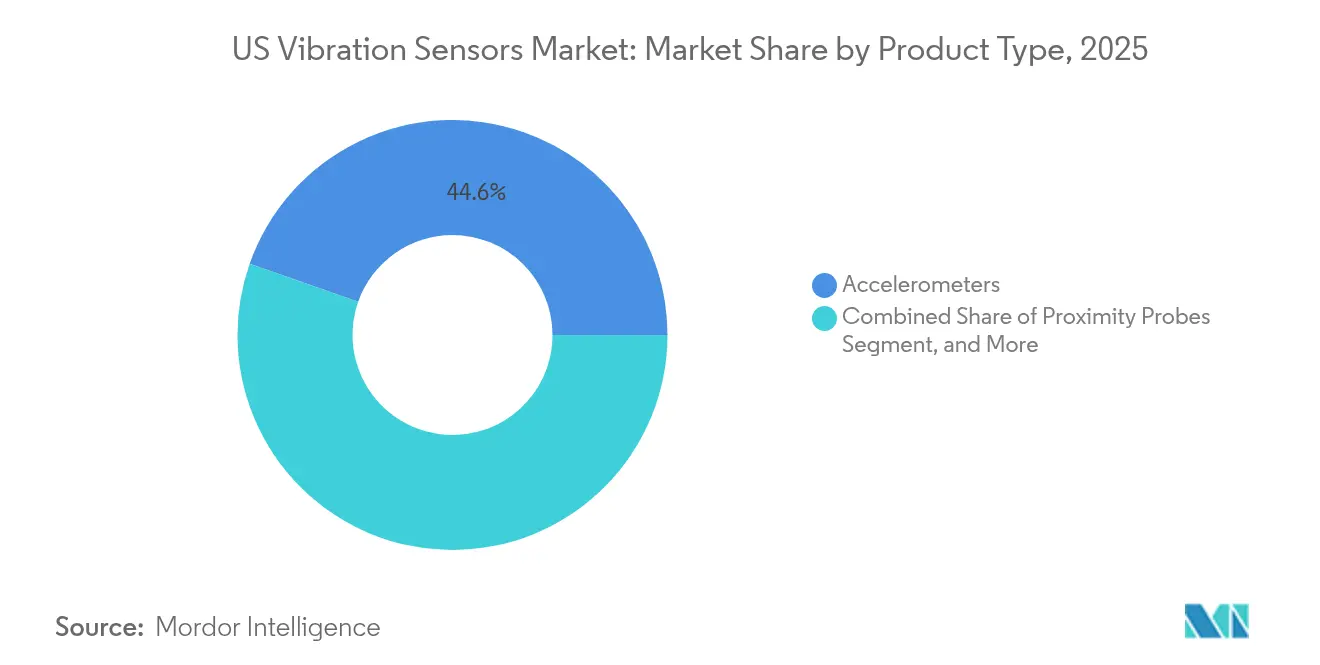
- By product type, accelerometers held 44.62% of the United States vibration sensors market share in 2025, while velocity sensors are projected to grow at a 7.43% CAGR to 2031.
- By sensor technology, wired digital systems accounted for 60.72% revenue share in 2025; wireless solutions are forecast to expand at a 8.78% CAGR through 2031.
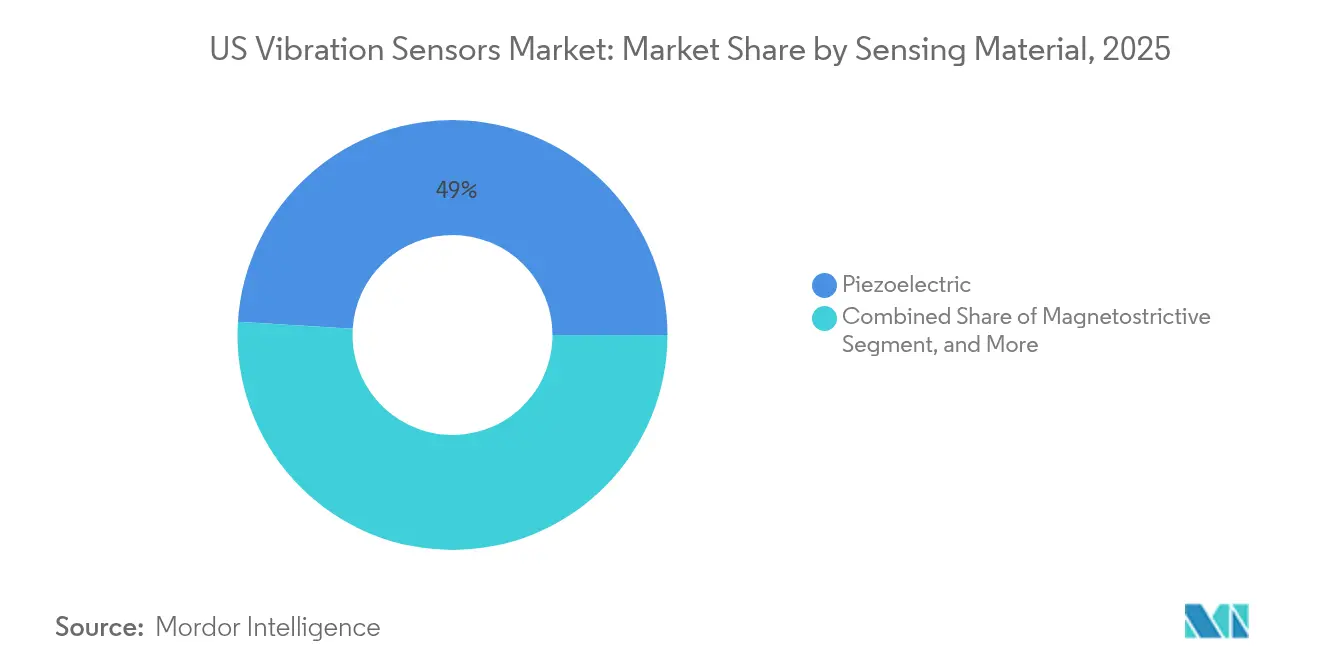
- By sensing material, piezoelectric sensors commanded 49.02% of the United States vibration sensors market size in 2025, whereas MEMS devices are expected to advance at an 8.21% CAGR.
- By end-user industry, oil and gas led with 21.52% revenue share in 2025, while power generation is set to record the highest CAGR at 6.63% over 2026-2031.
Note: Market size and forecast figures in this report are generated using Mordor Intelligence’s proprietary estimation framework, updated with the latest available data and insights as of 2026.
US Vibration Sensors Market Trends and Insights
Drivers Impact Analysis*
| Driver | (~) % Impact on CAGR Forecast | Geographic Relevance | Impact Timeline |
|---|---|---|---|
| Rising demand for predictive-maintenance programs | +1.2% | Global, with concentration in US industrial corridors | Medium term (2-4 years) |
| IIoT-enabled wireless vibration nodes gaining traction | +0.9% | US manufacturing belt, Texas energy corridor | Short term (≤ 2 years) |
| Accelerating adoption of MEMS-based low-cost accelerometers | +0.7% | National, with early gains in automotive clusters | Medium term (2-4 years) |
| OSHA and API compliance pressures in hazardous industries | +0.6% | Gulf Coast, Appalachian regions, California refineries | Long term (≥ 4 years) |
| Edge-AI analytics unlocking new value pools | +0.5% | Silicon Valley, Boston tech corridor, Austin | Short term (≤ 2 years) |
| Vehicle electrification driving high-frequency vibration sensing | +0.4% | Detroit, California, Southeast automotive regions | Long term (≥ 4 years) |
| Source: Mordor Intelligence | |||
Rising Demand for Predictive-Maintenance Programs
Unplanned downtime costs exceed USD 50 billion each year across U.S. manufacturing, prompting a shift from time-based to condition-based maintenance strategies. Many plants now deploy continuous vibration monitoring that detects bearing wear and misalignment early, extending asset life by as much as 30% while cutting spare-parts inventory. Machine learning applied to spectral data identifies anomalies that human analysts can miss, especially in facilities with interacting machines. Wind-farm operators using these tools have avoided lost production valued at EUR 4–5 million (USD 4.3–5.4 million) by predicting gearbox failures.[1]AspenTech, “Predictive Maintenance in Wind Turbines,” aspentech.com Early adoption success is accelerating broader rollouts across automotive, metals, and food-processing sites.[2]IBM, “Cost of Unplanned Downtime Study,” ibm.com
IIoT-Enabled Wireless Vibration Nodes Gaining Traction
Wireless monitoring eliminates cable routing and allows coverage of assets once considered unreachable. LoRaWAN networks transmit data more than 15 kilometers, proven in remote environmental sensing.[3]LoRa Alliance, “Long-Range IoT Networks,” iot.org Energy-harvesting devices powered by ambient vibration or heat remove battery-change labor, addressing previous cost barriers. Baker Hughes’ Ranger Pro sensor, approved for global hazardous areas, provides a template for oil and gas operators pursuing enterprise-wide condition monitoring. Short deployment times fit scheduled maintenance windows, supporting rapid ROI calculations.
Accelerating Adoption of MEMS-Based Low-Cost Accelerometers
MEMS accelerometers now cost under USD 10 per unit yet achieve noise performance once limited to piezoelectric devices priced five to ten times higher. Silicon micromachining improvements enable high-aspect-ratio structures that raise sensitivity while maintaining ruggedness. Electric-vehicle OEMs specify MEMS sensors to capture high-frequency vibration signatures critical for battery-pack integrity and motor control. TDK’s high-temperature closed-loop MEMS line extends viable operating range beyond 175 °C, opening gas-turbine and geothermal applications. As volumes scale, MEMS adoption spreads to medical, semiconductor, and building-automation contexts.
OSHA and API Compliance Pressures in Hazardous Industries
Expanded OSHA instance-by-instance citations, plus API 670 mandates for rotating equipment, drive continuous monitoring of pumps, compressors, and turbines. Fines, remediation, and downtime can exceed USD 1 million per incident, making vibration sensors a risk-mitigation investment. Intrinsically safe designs rated for Class I Division 2 zones meet stringent energy-limitation rules while supporting through-glass programming that avoids enclosure opening. Compliance programs often bundle sensors with cloud dashboards that document audit trails for insurers and regulators.
Restraints Impact Analysis*
| Restraint | (~) % Impact on CAGR Forecast | Geographic Relevance | Impact Timeline |
|---|---|---|---|
| Integration issues with legacy machinery | -0.8% | Rust Belt manufacturing regions, aging refineries | Medium term (2-4 years) |
| Shortage of intrinsically safe sensors for Class I/Div II zones | -0.6% | Gulf Coast petrochemical complexes, mining regions | Short term (≤ 2 years) |
| Cyber-security risks from connected sensors | -0.4% | National critical infrastructure | Long term (≥ 4 years) |
| Supply-chain volatility in piezo-ceramic materials | -0.3% | Global impact, concentrated in high-tech manufacturing | Medium term (2-4 years) |
| Source: Mordor Intelligence | |||
Integration Issues with Legacy Machinery
Many facilities rely on equipment built decades ago without standardized sensor mounts or communication ports. Retrofitting can cost three to five times more than installing sensors on new assets. Resonance effects in older frames complicate signal fidelity and demand custom fixtures that add labor hours. Multiple generations of proprietary protocols require gateways that increase capex and cybersecurity exposure. Analog Devices’ Voyager4 platform offers adaptive mounting and on-node AI to counter these hurdles, though price sensitivity slows adoption.
Shortage of Intrinsically Safe Sensors for Class I/Div II Zones
Certification cycles run 18–24 months, limiting availability of approved devices. Design requirements such as energy-limiting circuits raise unit prices by up to 400% versus general-purpose models, stretching project budgets. Petrochemical turnarounds have stalled when qualified sensors were back-ordered, forcing rescheduling of inspections. Portable intrinsically safe recorders for coal mines show innovation, but production volumes remain insufficient to alleviate supply risk. Operators consider dual sourcing and long-term contracts to secure supply continuity.
*Our forecasts treat driver/restraint impacts as directional, not additive. The impact forecasts reflect baseline growth, mix effects, and variable interactions.
Segment Analysis
By Product Type: Accelerometers Lead Industrial Transformation
Accelerometers represented 44.62% of 2025 shipments, underlining their versatility across frequency ranges. Velocity sensors post the highest 7.43% CAGR as they capture low-frequency faults earlier in large rotating equipment. Multi-parameter devices combine acceleration, velocity, and temperature to simplify installation and reduce total cost of ownership. Analog Devices integrates edge AI in such packages, allowing on-node fault classification that trims network bandwidth. Growing use of velocity sensing in hydropower and pulp-and-paper plants supports revenue diversity within the United States vibration sensors market.
The second growth driver lies in expanding tire and gearbox testing where triaxial accelerometers track compound dynamic loads. Proximity probes, though niche, remain indispensable in non‐contact turbine applications. Tachometers retain value as reference instruments for order analysis in variable-speed drives. As plants digitize, asset-health platforms ingest data from all product types, creating service fees that augment hardware margins and strengthen supplier-customer ties within the United States vibration sensors market.


By Sensor Technology: Wireless Solutions Surge Despite Wired Dominance
Wired digital systems delivered 60.72% of 2025 revenue thanks to proven reliability and existing cable trays. However, wireless nodes grow 8.78% annually as battery life and radio resilience improve. LoRaWAN achieves kilometer-scale reach on single gateways, supporting distributed solar farms. Hybrid power-plus-wireless architectures appear in pharmaceutical cleanrooms where uptime and contamination control are paramount. Energy harvesting addresses maintenance pain points and expands use cases such as rotating kilns where slip rings add cost and complexity.
Data-diode features and AES-256 encryption mitigate cybersecurity concerns that once favored wired setups. Firmware-over-air updates let operators patch vulnerabilities without physical access. Standardization under ISA100 and IEC 62938 promotes interoperability across vendors, broadening the ecosystem for the United States vibration sensors market.
By Sensing Material/Principle: MEMS Technology Challenges Piezoelectric Dominance
Piezoelectric crystals retained 49.02% share in 2025 due to high-temperature tolerance and low noise floors that suit aerospace and energy applications. Lead-free ceramics are gaining traction to meet environmental directives, easing future regulatory risk. MEMS accelerometers grow 8.21% annually, leveraged by smartphone supply chains that push down cost while funding R&D for industrial robustness. Silicon-carbide MEMS devices now tolerate harsh chemical vapors and temperatures above 200 °C, broadening deployment in chemical reactors.
Magnetostrictive and fiber-optic sensors occupy niches where electromagnetic immunity matters, such as MRI facilities and high-voltage switchyards. Composite carbon-nanotube structures promise lighter housings for drone-based inspection kits, adding an emerging frontier for the United States vibration sensors market.
By End-User Industry: Power Generation Drives Growth Acceleration
Power-generation customers log a 6.63% CAGR, propelled by grid modernization, wind-farm expansions, and higher rotating-asset density in gas-peaking plants. Utilities embed sensors in turbine bearings, gearboxes, and generators to avoid forced outages that disrupt power-purchase agreements. Oil and gas remains the largest revenue contributor at 21.52% of 2025 spend due to extensive installed rotating fleets and stringent API guidelines. Aerospace and defense demand extreme reliability, influencing supplier quality systems and margin structures.
Electric-vehicle factories deploy vibration nodes on battery conveyors and motor test stands to safeguard product quality. Hospitals use low-cost MEMS sensors to track vibrations during construction to protect MRI and CT imaging uptime. Mining firms rely on wireless sensor meshes to oversee crushers and conveyors in remote pits where cable deployment is prohibitive, underscoring diversified pull for the United States vibration sensors market.
Geography Analysis
The Gulf Coast hosts the most intensive deployments, powered by petrochemical plants and offshore rigs needing continuous monitoring for safety compliance. Texas blends conventional energy operations with expanding renewable projects such as wind-turbine farms and grid-scale batteries, lifting demand for wireless sensor backbones. Midwest industrial corridors, including Michigan and Ohio, retrofit aging stamping presses and machining centers with vibration nodes to extend asset life and uphold throughput targets. The United States vibration sensors market size tied to these Midwestern sectors is projected to climb steadily as predictive-maintenance culture spreads.
California supports high-performance sensor consumption in aerospace engine test cells and semiconductor fabs that insist on micro-g resolution. State-level sustainability incentives further promote condition-monitoring investment to curb energy waste. In the Northeast, a dense concentration of combined-cycle plants and chemicals facilities drives compliance-oriented spending, while regional universities partner with suppliers to pilot new sensing algorithms. Cross-border trade with Canada influences supply logistics but does not materially alter purchasing decisions inside the United States vibration sensors market.
Inter-regional competition for skilled maintenance technicians raises adoption of automation tools that fill workforce gaps. Federal infrastructure outlays and private-sector battery investments are expected to keep capital spending levels healthy, benefiting vendors positioned with scalable platforms. Regional economic development boards increasingly cite predictive maintenance projects as proof points in bids to attract manufacturing reshoring, providing another tailwind for vibration-sensor growth trajectories.
Regulatory Landscape
US vibration sensor deployments sit within a mix of safety, measurement traceability, and industry standards that shape both product design and end-user procurement. In hazardous rotating-equipment environments, API Standard 670 (5th Edition) is a key reference for machinery protection systems, setting expectations for transducers, monitoring, and testing, while OSHA-driven compliance programs reinforce continuous monitoring practices in high-risk facilities.
On the metrology side, NIST supports vibration measurement traceability through primary standards and calibration research, including ISO 16063-linked work under its Dynamic Mechanical Metrology efforts, which supports calibration services and acceptance testing. Separately, NEBB issued an updated Instrument Master List with requirements effective January 1, 2026, setting minimum specifications for vibration analyzers and accelerometers used by NEBB-certified firms. Trade rules also affect input costs, with a CBP-referenced tariff overview highlighting a Section 232 duty impact on certain semiconductor and derivative products effective mid-January 2026, increasing the importance of end-use documentation for qualifying exemptions.
Value Chain Analysis
The value chain begins with sensing elements and electronics inputs, including piezo materials and MEMS wafers, mixed-signal ICs, wireless chipsets, and packaging. It then moves into sensor module design, calibration, certification (where hazardous-area requirements apply), and integration into condition-monitoring systems. NIST-backed traceability and calibration infrastructure support acceptance testing for many industrial buyers, and deployments commonly reference API 670 for machinery protection along with interoperability approaches that reduce commissioning burden in mixed-vendor environments.
Downstream, channels increasingly bundle sensors with gateways, software, and remote diagnostics sold as subscriptions rather than one-time hardware purchases, shifting margin capture toward analytics and services. US-focused solution providers and specialists such as KCF Technologies, STI Vibration Monitoring, Wilcoxon Sensing Technologies, Sentek Dynamics, and NOVASEER illustrate an ecosystem spanning ruggedized sensors, transmitters, and AI-enabled predictive maintenance offerings. Integration into legacy machinery and cybersecurity controls remain recurring friction points that support packaged solutions and standardized interfaces.
Competitive Landscape
The United States vibration sensors market remains moderately fragmented, with the top five players controlling roughly 35–40% of revenue. Global multinationals offer broad portfolios spanning sensors, gateways, and analytics software, while regional specialists focus on hazardous-area certifications or fiber-optic measurement. Honeywell’s partnership with Analog Devices integrates sensor outputs into building-management suites, allowing customers to consolidate HVAC, energy, and asset-health data streams. TDK emphasizes MEMS innovation, unveiling modules that blend AI coprocessing to reduce cloud traffic and latency.
Patent filings concentrate on wireless energy harvesting and anomaly-detection models, signalling a race to secure intellectual property in data-centric services. Suppliers bundle training and remote diagnostics into subscriptions, shifting revenue toward recurring streams. Some firms pursue OEM-installed sensor programs that lock in pull-through consumables and upgrade kits across equipment life cycles. Niche entrants carve space in intrinsically safe solutions, using certification expertise as a barrier to large-scale commoditization. As use cases expand to HVAC, elevators, and smart buildings, cross-domain alliances widen addressable markets without heavy capex for new product lines.
US Vibration Sensors Industry Leaders
National Instruments Corporation
Texas Instruments Incorporated
Emerson Electric Co.
Honeywell International Inc.
SKF USA Inc.
- *Disclaimer: Major Players sorted in no particular order

Market Opportunities and Future Outlook
Interoperability and secure onboarding create whitespace for vibration sensors that connect to broader smart-manufacturing data layers without bespoke integration. MTConnect (ANSI/MTC1.4-2018) is a practical anchor for this opportunity in US factories because it provides an open, read-only data exchange standard for manufacturing equipment, enabling vibration and condition data to move into plant systems and analytics stacks with fewer proprietary bottlenecks.
Evidence of sustained activity comes from NIST programs that instrument workcells and aggregate equipment data using MTConnect in the Smart Manufacturing Systems Test Bed, including its Prognostics and Health Management for Reliable Operations in Smart Manufacturing (PHM4SM) work on metrics and health data for reliability. Vendors that align vibration sensing, data models, and cybersecurity practices with these test-bed patterns can target deployments where buyers want standardized data pipelines, lifecycle device management, and measurable reliability outcomes, rather than standalone vibration point solutions.
Recent Industry Developments
- February 2026: Texas Instruments announced a definitive agreement to acquire Silicon Labs in an all-cash transaction, expanding its embedded wireless connectivity footprint alongside its analog and mixed-signal strengths. The combination supports tighter sensor-to-edge connectivity roadmaps that can influence wireless vibration node designs and component sourcing choices for US industrial deployments.
- July 2025: Emerson expanded its Test and Measurement business (formerly National Instruments) through partnerships with Tata Technologies and Kaynes Semicon to co-develop intelligent testing, validation, and semiconductor test systems. The move strengthens the tooling ecosystem used to validate vibration sensing, DAQ, and sensor I/O performance, helping shorten qualification cycles for condition-monitoring deployments.
- June 2025: TDK introduced high-temperature closed-loop MEMS accelerometers targeting gas-turbine and geothermal assets. Extending MEMS into hotter operating environments broadens where lower-cost, compact accelerometers can be specified, supporting wider retrofits across energy and other harsh-duty US industrial sites.


Research Methodology Framework and Report Scope
Market Definition and Coverage
This market covers revenue generated from vibration sensors sold and used within the United States for measuring vibration in machines, equipment, and structures across industrial and selected commercial uses, during the study period.
Scope exclusions: It excludes installation services, long-term maintenance contracts, and broader condition monitoring software platforms that may be bundled with sensing hardware.
Segmentation Overview
- By Product Type
- Accelerometers
- Proximity Probes
- Tachometers
- Velocity Sensors
- Others
- By Sensor Technology
- Wired (Analog/Digital)
- Wireless (BLE, LoRa, Wi-Fi)
- By Sensing Material / Principle
- Piezoelectric
- MEMS (Capacitive/Piezoresistive)
- Magnetostrictive
- Fiber-Optic
- By End-user Industry
- Automotive
- Aerospace and Defense
- Oil and Gas
- Metals and Mining
- Power Generation
- Healthcare
- Consumer Electronics
- Other End-user Industries
Data Sources, Market Sizing, and Validation
Desk Research
Desk research was used to set the fact base and keep the model aligned to how vibration sensing is actually purchased and deployed in the United States. We reviewed public sources such as the US Census Bureau manufacturing and trade tables, US International Trade Commission data, Bureau of Labor Statistics industrial activity indicators, NIST publications, and relevant IEEE and ASME papers to understand technology shifts and adoption patterns.
To make the sizing practical, we also used secondary checks from company annual reports, investor presentations, product catalogs, and credible industry news that discusses plant reliability and maintenance spending. In a few cases, paid subscriptions for company financials and news, plus patent-intelligence tools, were used to cross-check supplier exposure, product mix, and innovation direction. The desk sources cited here are illustrative only, and many other references were used for data collection, validation, and clarification as the work progressed.
Primary Interviews and Surveys
Primary interviews and short surveys were completed with sensor manufacturers, distributors, system integrators, and end users in industrial maintenance and reliability teams. Discussions covered typical buying units, the direction of average selling price, replacement cycles, and which applications are driving volume, so desk assumptions could be corrected where needed.
Since this is a United States focused study, the fieldwork concentrated on domestic demand centers across manufacturing, energy, transportation, and aerospace related users, and then was used to reconcile adoption rates with observed production and investment signals.
Distribution of primary research fieldwork respondents
| Company type | Respondent position | Region |
|---|---|---|
| Top tier: 36% | CXOs: 17% | |
| Mid tier: 43% | Functional/Unit leaders: 29% | |
| Smaller Players: 21% | Managers: 54% |
Market-Sizing & Forecasting
Sizing starts from a top-down demand pool build that ties vibration sensor consumption to US industrial activity and maintenance intensity, and then converts that pool into sensor revenue using penetration and replacement assumptions. Those totals are corroborated with selective bottom-up approximations, where sampled supplier revenues, channel checks, and an average selling price times volume logic are used to confirm that the final number stays realistic.
Key inputs used in the model include manufacturing output and capital spending signals, the installed base of rotating equipment in key industries, preventive and predictive maintenance adoption in plants, typical sensor replacement cycles, mix shifts toward tri-axial sensing, and price movement by technology type. When a clean bottom-up view was not possible for smaller suppliers, gaps were handled through category level shares from interviews and then back-checked against import and domestic production signals.
For forecasting, scenario analysis was used with a base case agreed through primary discussions, and then stress-tested against faster automation uptake and slower capex cycles. The forecast also reflects how new deployments and replacements behave differently over time, which tends to smooth growth versus one-time project spikes.
Data Validation & Update Cycle
Validation is done through multiple cross-checks so the estimate is not driven by a single data stream. Model outputs are compared with independent signals such as industrial production, equipment investment, and shipment patterns, and then large variances are investigated before numbers are finalized.
A second analyst reviews the calculations, assumptions, and year-to-year movements, and outliers trigger re-contact with selected interviewees to confirm what changed in pricing, mix, or adoption. Reports are refreshed annually, and interim updates are made when material events occur that can shift demand or supply. Before delivery, a final pass is completed to ensure the latest public indicators and relevant announcements are reflected.
Mordor Intelligence's United States Vibration Sensors Market Market Size Compared Against Other Published Estimates
Published market sizes for US vibration sensors often vary because the scope lines are drawn differently, and then different pricing and adoption assumptions are layered on top. Differences also show up when one publisher uses a different base year, a different inflation path for sensor pricing, or a different method to convert units into revenue.
Software for condition monitoring and analytics often gets counted inside the total in some write-ups, but it sits outside Mordor Intelligence's scope for this US vibration sensors market, which keeps the number tied to sensor hardware revenue and clear application usage. Gaps also come from how aggressively predictive maintenance penetration is assumed in heavy industries, whether tri-axial upgrades are priced as premium across all end users, and how quickly older installed bases are assumed to be retrofitted.
Benchmark comparison
| Source | Market Size | Gaps in Research Methodology |
|---|---|---|
| Mordor Intelligence | USD 1.91 B (2026) | |
| Industry Databook A | USD 1.56 B (2023) | Uses an earlier base year and a narrower type split that can understate newer industrial deployments, and the shorter horizon can miss faster adoption in machine monitoring use cases. |
| Market Publisher B | USD 1.87 B (2024) | Often relies on a higher growth path and broader aggregation across end-use and technology groupings, which can blend industrial sensors with adjacent sensing categories and lift the mid-period total. |
Taken together, the spread is mainly explained by what gets included around the sensor hardware, the chosen base year, and how price and penetration are carried forward. Our estimate stays traceable because each step is linked to observable demand indicators, replacement behavior, and interview-verified price and mix assumptions, which can be repeated and challenged if new evidence appears.


Key Questions Answered in the Report
What is the current value of the United States vibration sensors market?
The market is valued at USD 1.91 billion in 2026.
How fast is the United States vibration sensors market expected to grow?
It is projected to expand at a 4.28% CAGR, reaching USD 2.36 billion by 2031.
Which product category holds the largest share?
Accelerometers lead with 44.62% revenue share as of 2025.
Why are wireless vibration sensors gaining popularity?
They cut installation costs, reach remote assets, and now leverage energy harvesting for long life.
Which end-user segment is forecast to grow the fastest?
Power generation shows the highest CAGR at 6.63% due to grid modernization and renewable integration.
What are the key regulatory drivers for sensor adoption?
OSHA enforcement and API 670 standards mandate continuous monitoring of critical rotating equipment.
Page last updated on:






