Market Overview
| Study Period | 2017 - 2029 |
|---|---|
| Base Year For Estimation | 2024 |
| Forecast Data Period | 2025 - 2029 |
| Market Size (2025) | USD 11.79 Billion |
| Market Size (2029) | USD 14.74 Billion |
| Growth Rate (2025 - 2029) | 5.73% CAGR |
| Market Concentration | High |
Major Players*Disclaimer: Major Players sorted in no particular order Image © Mordor Intelligence. Reuse requires attribution under CC BY 4.0. |
|

United States Vans Market Analysis by Mordor Intelligence
The United States Vans Market size is estimated at 11.79 billion USD in 2025, and is expected to reach 14.74 billion USD by 2029, growing at a CAGR of 5.73% during the forecast period (2025-2029).
The United States vans market is experiencing a significant transformation driven by technological advancements and changing business models. The market landscape is dominated by established players, with Ford Motor Company maintaining its leadership position with a 45.4% market share in 2023. This dominance reflects the industry's consolidation around manufacturers with strong distribution networks and comprehensive product portfolios. The vans industry has witnessed several strategic moves in 2023, including Ford's announcement of a new battery capacity plant, demonstrating the industry's commitment to electric mobility solutions. These developments are reshaping competitive dynamics and forcing traditional manufacturers to adapt their strategies to maintain market relevance.
The transition toward sustainable transportation solutions has become a defining characteristic of the market. The infrastructure supporting this transition has seen remarkable growth, with the United States reaching 128,000 EV charging stations in 2022, marking a significant milestone in the development of supporting infrastructure. Manufacturers are increasingly focusing on developing electric van variants of their popular van models, driven by both environmental regulations and growing customer demand for sustainable transport solutions. This shift is particularly evident in the commercial sector, where businesses are increasingly incorporating electric vans into their fleets to meet sustainability goals and reduce operating costs.
The market is witnessing a notable evolution in product development and manufacturing strategies. Battery technology improvements have played a crucial role, with battery pack prices declining to 151 USD/kWh in 2022, making electric vans more commercially viable. Manufacturers are responding by introducing innovative features and capabilities in their new models, particularly in areas such as cargo capacity, driver assistance systems, and connectivity solutions. The industry is also seeing increased collaboration between traditional automakers and technology companies to develop advanced vehicle platforms that can meet evolving customer requirements.
The commercial vehicle sector is undergoing a structural transformation in response to changing business needs and urban mobility patterns. Sales data from 2022, showing 330,000 units of light commercial vans, reflects the market's adjustment to new operational realities. The rise of e-commerce and last-mile delivery services has created new opportunities for van manufacturers, leading to the development of specialized vehicles designed for urban logistics. This trend has prompted manufacturers to focus on developing more compact, maneuverable vehicles that can efficiently navigate urban environments while maintaining optimal cargo capacity and operational efficiency. The demand for specialized vehicles such as cargo vans and delivery vans is increasing, further driving innovation in the fleet van segment.
United States Vans Market Trends and Insights
Rapid growth in electric vehicle sales driven by government initiatives and increasing demand in the US
- The United States has witnessed a significant surge in the adoption of electric vehicles (EVs) in recent years. This uptick can be attributed to a heightened awareness of EVs, growing environmental concerns, and the implementation of government regulations. Notably, in 2016, California introduced the Zero-Emission Vehicle (ZEV) program aimed at curbing carbon emissions and improving air quality. This initiative has not only spurred the growth of electric cars within California but has also influenced other states to adopt similar ZEV regulations. Consequently, the nation saw a remarkable 634% surge in demand for battery electric vehicles (BEVs) from 2017 to 2022.
- The demand for electric commercial vehicles in the United States is also on the rise. Factors such as the booming e-commerce industry, increased logistics activities, and governmental initiatives for cleaner transportation have fueled this growth. In a significant move, the governor of New York signed the Advanced Clean Truck (ACT) Rule in September 2021. This rule sets a target for all new light-duty vehicles to be zero-emission by 2035 and the same for medium- and heavy-duty vehicles by 2045. As a result, the United States witnessed a 21% surge in demand for electric commercial vehicles in 2022 compared to the previous year.
- Governmental efforts, including rebates, subsidies, and strategic plans, are further bolstering the electrification of vehicles nationwide. In May 2022, President Biden unveiled a USD 3 billion plan to expedite domestic battery manufacturing, with the aim of transitioning gas-powered vehicles to electric ones. This push is expected to significantly boost electric mobility in the country, particularly during 2024-2030, thereby amplifying the demand for battery packs.

Understand The Key Trends Shaping This Market
Download PDF
OTHER KEY INDUSTRY TRENDS COVERED IN THE REPORT
- The US population continues to grow steadily, driven by immigration and economic opportunities that require strategic planning
- The CVP is expected to experience consistent growth, driven by technological advancements, a focus on sustainable transportation, and the US's commitment to automotive innovation and reducing carbon emissions
- The recent US auto interest rate of 3.6% reflects fluctuations influenced by monetary policies, credit demand, and economic conditions, with a modest increase indicating optimism in the post-pandemic recovery
- The United States achieved a milestone of 128,000 EV Charging Stations in 2022, and the country is poised for continued growth in green mobility
- Rising demand and strategic product launches drive the electric vehicle market in the US.
- The United States remained a net crude oil importer, importing about 6.28 million bpd from 80 countries
- The US exhibits remarkable economic resilience and growth, driven by factors like robust financial markets, technological advancements, and adaptable policies
- The United States grapples with fluctuating inflation but aims for stability for long-term economic leadership
- Evolution of Mobility as a Service (MaaS) in the United States: a focus on shared rides, car rentals, car-sharing, and ride-hailing and taxi services
- Decreasing battery pack prices and government initiatives drive the US electric vehicle market
- The United States remained a net crude oil importer in 2022, importing about 6.28 million bpd of crude oil from 80 countries
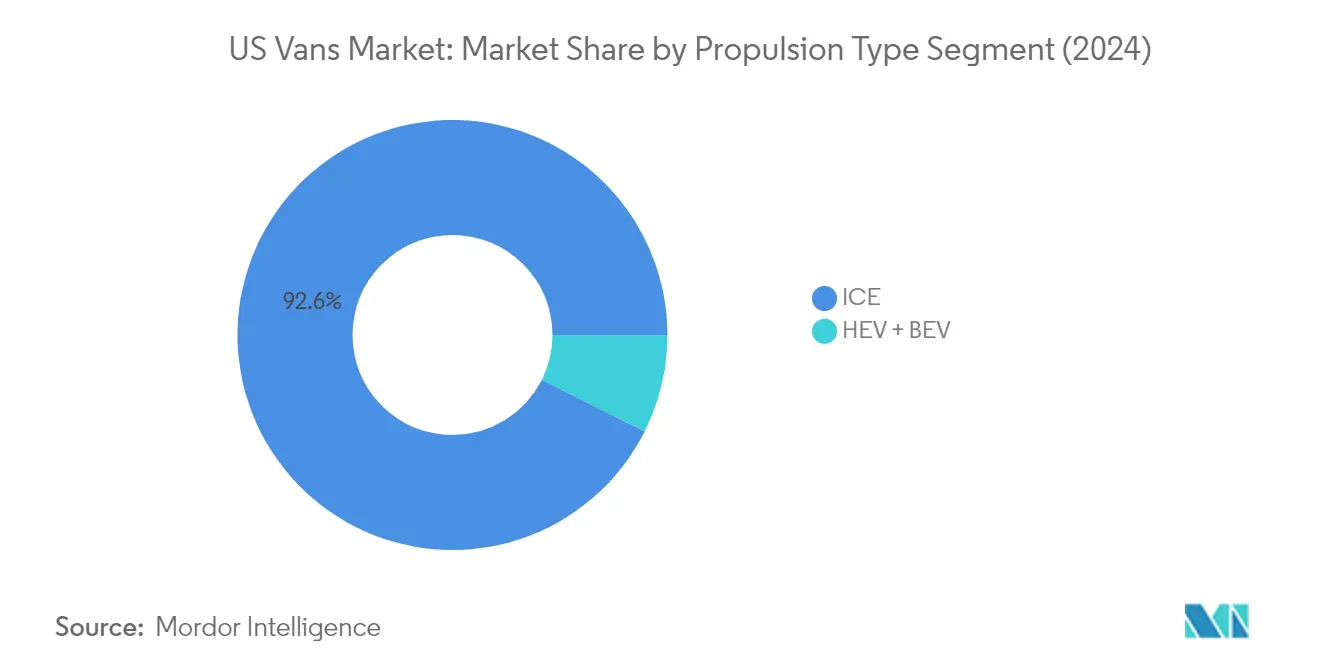
Segment Analysis: By Propulsion Type
ICE Segment in US Vans Market
The Internal Combustion Engine (ICE) segment continues to dominate the United States vans market, commanding approximately 93% market share in 2024. This substantial market presence is primarily driven by the segment's well-established infrastructure, proven reliability, and widespread acceptance among commercial van fleet operators. The segment encompasses both diesel and gasoline variants, with diesel vans particularly favored in long-haul operations due to their superior fuel efficiency and torque characteristics. The robust aftermarket support network, competitive pricing, and immediate availability of ICE vans further reinforce their market dominance. Additionally, the segment benefits from ongoing technological improvements in engine efficiency and emissions control systems, helping maintain its appeal despite growing environmental concerns.
Electric Vehicles Segment in US Vans Market
The Battery Electric Van (BEV) segment is emerging as the fastest-growing segment in the United States vans market, with projections indicating an impressive growth rate of approximately 36% during the 2024-2029 period. This remarkable growth trajectory is being fueled by increasing environmental consciousness among fleet operators, supportive government policies, and significant improvements in battery technology and charging infrastructure. Major automotive manufacturers are intensifying their focus on electric van development, introducing new models with enhanced range capabilities and faster charging times. The segment's growth is further accelerated by declining battery costs, improving total cost of ownership metrics, and the rising corporate commitment to sustainability goals. The expansion of urban zero-emission zones and stricter emission regulations are also contributing to the accelerated adoption of electric vans across various commercial vehicle applications.
Remaining Segments in Propulsion Type
The Hybrid Electric Vehicle (HEV) segment represents a transitional technology in the US vans market, offering a bridge between conventional ICE vehicles and fully electric solutions. These vehicles combine the benefits of electric propulsion with the reliability of traditional combustion engines, making them particularly attractive for operators hesitant to transition directly to fully electric vehicles. HEVs provide improved fuel efficiency and reduced emissions compared to conventional ICE vehicles while eliminating range anxiety concerns associated with pure electric vehicles. The segment continues to evolve with manufacturers introducing more sophisticated hybrid powertrains and expanding their hybrid fleet van offerings to meet diverse cargo van needs.
Competitive Landscape
Top Companies in United States Vans Market
The United States vans market is characterized by intense competition and continuous innovation among major players. Companies are heavily investing in electric van development, with several manufacturers launching new electric van models and expanding their EV production facilities. Operational agility is demonstrated through strategic partnerships with technology companies and charging infrastructure providers to enhance their market presence. Companies are also focusing on manufacturing plant expansions and modernization efforts to increase production capacity and meet growing demand. The vans industry shows a strong trend toward sustainability initiatives, with manufacturers implementing eco-friendly practices and developing zero-emission vehicles. Strategic moves include collaborations with ride-sharing platforms, fleet management solutions, and investments in autonomous driving technologies. Additionally, companies are strengthening their after-sales service networks and customization options to better serve diverse customer needs.
Market Dominated by Established Global Players
The United States vans market exhibits a high level of consolidation, with established global automotive manufacturers holding significant market positions. Traditional automotive conglomerates leverage their extensive manufacturing capabilities, established distribution networks, and brand recognition to maintain their market dominance. These companies benefit from economies of scale and vertical integration, allowing them to offer competitive pricing while maintaining profitability. The market structure favors large-scale operations, making it challenging for new entrants to gain substantial market share without significant capital investment or technological advantages. The presence of strong dealer networks and well-established service infrastructure further reinforces the position of incumbent players.
Merger and acquisition activities in the market are primarily focused on technology acquisition and capability enhancement rather than market consolidation. Companies are increasingly pursuing strategic partnerships and joint ventures, particularly in areas such as electric powertrains, battery technology, and autonomous driving systems. These collaborations often involve traditional automotive manufacturers partnering with technology companies or specialized electric vehicle manufacturers to accelerate innovation and market deployment. The market also sees increasing investment in startups developing specialized solutions for commercial vehicle applications, indicating a shift toward technology-driven growth strategies.
Innovation and Sustainability Drive Future Success
For incumbent players to maintain and expand their market share, focusing on technological innovation and sustainability initiatives is crucial. Companies must invest in developing advanced electric powertrains, improving battery technology, and expanding charging infrastructure to meet growing demand for sustainable transportation solutions. Building strong relationships with fleet customers through comprehensive service packages and customization options remains essential. Additionally, manufacturers need to strengthen their digital capabilities, offering connected vehicle solutions and advanced fleet management systems to enhance customer value propositions. Developing flexible manufacturing systems that can accommodate both traditional and electric vehicles while maintaining cost efficiency is also critical.
Contenders looking to gain ground in the market must focus on identifying and serving underserved market segments while developing innovative solutions that address specific customer pain points. Success factors include establishing strong partnerships with charging infrastructure providers, developing competitive financing solutions, and building efficient after-sales service networks. Companies must also navigate evolving regulatory requirements, particularly regarding emissions standards and safety regulations, while maintaining cost competitiveness. The ability to offer specialized solutions for specific industries or applications, combined with strong customer support and service capabilities, will be crucial for gaining market share. Furthermore, developing strong relationships with key stakeholders in the commercial vehicle ecosystem, including fleet operators, leasing companies, and service providers, will be essential for long-term success.
United States Vans Industry Leaders
-
Daimler AG (Mercedes-Benz AG)
-
Ford Motor Company
-
General Motors Company
-
GM Motor (Chevrolet)
-
Ram Trucking, Inc.
- *Disclaimer: Major Players sorted in no particular order

Need More Details on Market Players and Competitors?
Download PDF
Recent Industry Developments
- June 2023: Stellantis added Merchants Fleet as the latest Ram ProMaster EV commercial customer, and that agreement calls for 12,500 Ram ProMaster EV units over the next several years.
- June 2023: Mercedes-Benz is extending the availability of its DRIVE PILOT system to California, making it accessible to a wider US audience. Additionally, the company is set to introduce a SAE Level 3 autonomous driving system in one of its standard-production vehicles, specifically designed for use on public freeways in California.
- June 2023: FORD NEXT launched a new pilot program that creates flexible electric solutions for drivers who use the Uber platform in select US markets, allowing them to lease a vehicle for more customized time periods.
United States Vans Market Report Scope
Hybrid and Electric Vehicles, ICE are covered as segments by Propulsion Type.
Propulsion Type
| Hybrid and Electric Vehicles | By Fuel Category | BEV |
| HEV | ||
| ICE | By Fuel Category | Diesel |
| Gasoline |
| Propulsion Type | Hybrid and Electric Vehicles | By Fuel Category | BEV |
| HEV | |||
| ICE | By Fuel Category | Diesel | |
| Gasoline | |||
Need A Different Region or Segment?
Customize Now
Market Definition
- Vehicle Type - The category includes Light Commercial Vehicle.
- Vehicle Body Type - This include Light Commercial Vans category.
- Fuel Category - The category exclusively covers electric propulsion systems, including various types such as HEV (Hybrid Electric Vehicles), PHEV (Plug-in Hybrid Electric Vehicles), BEV (Battery Electric Vehicles), and FCEV (Fuel Cell Electric Vehicles).
| Keyword | Definition |
|---|---|
| Electric Vehicle (EV) | A vehicle which uses one or more electric motors for propulsion. Includes cars, buses, and trucks. This term includes all-electric vehicles or battery electric vehicles and plug-in hybrid electric vehicles. |
| BEV | A BEV relies completely on a battery and a motor for propulsion. The battery in the vehicle must be charged by plugging it into an outlet or public charging station. BEVs do not have an ICE and hence are pollution-free. They have a low cost of operation and reduced engine noise as compared to conventional fuel engines. However, they have a shorter range and higher prices than their equivalent gasoline models. |
| PEV | A plug-in electric vehicle is an electric vehicle that can be externally charged and generally includes all-electric vehicles as well as plug-in hybrids. |
| Plug-in Hybrid EV | A vehicle that can be powered either by an ICE or an electric motor. In contrast to normal hybrid EVs, they can be charged externally. |
| Internal combustion engine | An engine in which the burning of fuels occurs in a confined space called a combustion chamber. Usually run with gasoline/petrol or diesel. |
| Hybrid EV | A vehicle powered by an ICE in combination with one or more electric motors that use energy stored in batteries. These are continually recharged with power from the ICE and regenerative braking. |
| Commercial Vehicles | Commercial vehicles are motorized road vehicles designed for transporting people or goods. The category includes light commercial vehicles (LCVs) and medium and heavy-duty vehicles (M&HCV). |
| Passenger Vehicles | Passenger cars are electric motor– or engine-driven vehicles with at least four wheels. These vehicles are used for the transport of passengers and comprise no more than eight seats in addition to the driver’s seat. |
| Light Commercial Vehicles | Commercial vehicles that weigh less than 6,000 lb (Class 1) and in the range of 6,001–10,000 lb (Class 2) are covered under this category. |
| M&HDT | Commercial vehicles that weigh in the range of 10,001–14,000 lb (Class 3), 14,001–16,000 lb (Class 4), 16,001–19,500 lb (Class 5), 19,501–26,000 lb (Class 6), 26,001–33,000 lb (Class 7) and above 33,001 lb (Class 8) are covered under this category. |
| Bus | A mode of transportation that typically refers to a large vehicle designed to carry passengers over long distances. This includes transit bus, school bus, shuttle bus, and trolleybuses. |
| Diesel | It includes vehicles that use diesel as their primary fuel. A diesel engine vehicle have a compression-ignited injection system rather than the spark-ignited system used by most gasoline vehicles. In such vehicles, fuel is injected into the combustion chamber and ignited by the high temperature achieved when gas is greatly compressed. |
| Gasoline | It includes vehicles that use gas/petrol as their primary fuel. A gasoline car typically uses a spark-ignited internal combustion engine. In such vehicles, fuel is injected into either the intake manifold or the combustion chamber, where it is combined with air, and the air/fuel mixture is ignited by the spark from a spark plug. |
| LPG | It includes vehicles that use LPG as their primary fuel. Both dedicated and bi-fuel LPG vehicles are considered under the scope of the study. |
| CNG | It includes vehicles that use CNG as their primary fuel. These are vehicles that operate like gasoline-powered vehicles with spark-ignited internal combustion engines. |
| HEV | All the electric vehicles that use batteries and an internal combustion engine (ICE) as their primary source for propulsion are considered under this category. HEVs generally use a diesel-electric powertrain and are also known as hybrid diesel-electric vehicles. An HEV converts the vehicle momentum (kinetic energy) into electricity that recharges the battery when the vehicle slows down or stops. The battery of HEV cannot be charged using plug-in devices. |
| PHEV | PHEVs are powered by a battery as well as an ICE. The battery can be charged through either regenerative breaking using the ICE or by plugging into some external charging source. PHEVs have a better range than BEVs but are comparatively less eco-friendly. |
| Hatchback | These are compact-sized cars with a hatch-type door provided at the rear end. |
| Sedan | These are usually two- or four-door passenger cars, with a separate area provided at the rear end for luggage. |
| SUV | Popularly known as SUVs, these cars come with four-wheel drive, and usually have high ground clearance. These cars can also be used as off-road vehicles. |
| MPV | These are multi-purpose vehicles (also called minivans) designed to carry a larger number of passengers. They carry between five and seven people and have room for luggage too. They are usually taller than the average family saloon car, to provide greater headroom and ease of access, and they are usually front-wheel drive. |
Need More Details on Market Definition?
Ask a Question
Research Methodology
Mordor Intelligence follows a four-step methodology in all its reports.
- Step-1: Identify Key Variables: To build a robust forecasting methodology, the variables and factors identified in Step-1 are tested against available historical market numbers. Through an iterative process, the variables required for market forecast are set and the model is built based on these variables.
- Step-2: Build a Market Model: Market-size estimations for the historical and forecast years have been provided in revenue and volume terms. Market revenue is calculated by multiplying the sales volume with their respective average selling price (ASP). While estimating ASP factors like average inflation, market demand shift, manufacturing cost, technological advancement, and varying consumer preference, among others have been taken into account.
- Step-3: Validate and Finalize: In this important step, all market numbers, variables, and analyst calls are validated through an extensive network of primary research experts from the market studied. The respondents are selected across levels and functions to generate a holistic picture of the market studied.
- Step-4: Research Outputs: Syndicated Reports, Custom Consulting Assignments, Databases & Subscription Platforms.

Get More Details On Research Methodology
Download PDF


