
Market Overview
| Study Period | 2020 - 2031 |
|---|---|
| Forecast Data Period | 2026 - 2031 |
| Base Year Market Size (2025) | USD 19.02 Billion |
| Market Size (2026) | USD 19.94 Billion |
| Market Size (2031) | USD 25.28 Billion |
| Growth Rate (2026 - 2031) | 4.86 % |
| Market Concentration | Medium |
Major Players *Disclaimer: Major Players sorted in no particular order Image © Mordor Intelligence. Reuse requires attribution under CC BY 4.0. | |
United States Valves Market Analysis by Mordor Intelligence
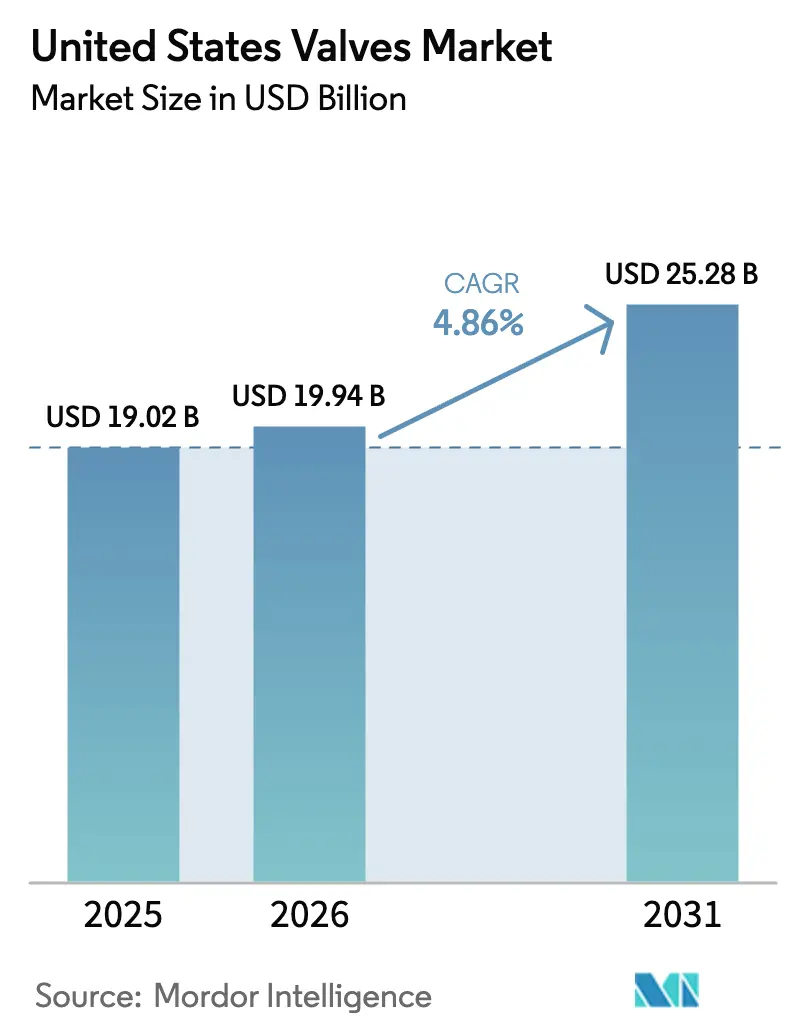
The US valves market size is expected to grow from USD 19.02 billion in 2025 to USD 19.94 billion in 2026 and is forecast to reach USD 25.28 billion by 2031 at 4.86% CAGR over 2026-2031. The outlook reflects sustained investment in shale-oil refracturing, federally funded water infrastructure upgrades, and the acceleration of Industrial IoT adoption. Valve suppliers capture recurring revenue from shorter replacement cycles in unconventional oilfields, while municipalities leverage federal grants to modernize legacy distribution networks with smart, lead-free components. In parallel, data center expansion, hydrogen hub development, and carbon capture projects present high-value opportunities that reward manufacturers capable of meeting stringent performance standards. Competitive intensity centers on technology integration and rapid response to steel-price volatility, prompting many producers to diversify materials and expand aftermarket services. Cybersecurity readiness, predictive maintenance capabilities, and hydrogen-ready designs now influence procurement decisions as much as price and lead time.
Key Report Takeaways
- By valve type, gate valves led with 27.24% of the US valves market share in 2025, while butterfly valves are projected to expand at a 5.05% CAGR through 2031.
- By material, steel commanded a 40.88% share of the US valves market size in 2025, whereas plastic materials were projected to record the highest CAGR of 4.92% from 2025 to 2031.
- By actuation method, manual products accounted for a 49.10% share of the US valves market size in 2025; electric actuation is projected to advance at a 5.44% CAGR through 2031.
- By end-user, the oil and gas sector represented a 32.40% share of the US valves market size in 2025; however, the food and beverage sector is forecasted to grow at a 5.03% CAGR through 2031.
- By region, the South held 35.22% of the US valves market share in 2025, while the West is set to post the fastest 5.68% CAGR during the forecast period.
Note: Market size and forecast figures in this report are generated using Mordor Intelligence’s proprietary estimation framework, updated with the latest available data and insights as of 2026.
Market Trends and Insights
Drivers Impact Analysis of United States Valves Market*
| Driver | (~) % Impact on CAGR Forecast | Geographic Relevance | Impact Timeline |
|---|---|---|---|
| Rapid shale-oil refracturing activity boosting valve replacements | +0.8% | South, West | Medium term (2-4 years) |
| Accelerating federal funding for water infrastructure modernization | +0.6% | National (priority in Northeast and Midwest) | Long term (≥ 4 years) |
| Industrial IoT-enabled predictive maintenance adoption | +0.5% | National (early gains in Midwest) | Medium term (2-4 years) |
| Hydrogen-ready valve design standards emerging | +0.4% | West Coast and Gulf Coast | Long term (≥ 4 years) |
| Federal investment tax credits for carbon-capture projects | +0.3% | South and Midwest | Long term (≥ 4 years) |
| Growth of modular data centers requiring precision cooling valves | +0.2% | West and South | Short term (≤ 2 years) |
| Source: Mordor Intelligence | |||
Rapid Shale-Oil Refracturing Activity Boosting Valve Replacements
Refracturing campaigns shorten valve lifecycles from 18-24 months to 12-15 months, driving steady aftermarket demand in Permian and other shale hotspots. Pressure cycling above 10,000 psi necessitates premium designs with enhanced sealing and corrosion resistance.[1] Aftermarket providers benefit from higher replacement frequency, while OEMs capture value through upgraded materials and service agreements. Rising refracturing intensity also spurs demand for control valves that can modulate flow during multi-stage treatments. Suppliers able to certify products for rapid deployment gain a competitive edge in this time-sensitive environment.
Accelerating Federal Funding for Water Infrastructure Modernization
The Infrastructure Investment and Jobs Act allocates USD 55 billion for water systems, much of which targets aging valves that entered service 30-50 years ago. Municipalities prioritize smart, lead-free, and remotely actuated valves to increase leak detection efficiency and regulatory compliance. EPA revolving funds supplement federal grants, ensuring a steady pipeline of projects through 2030. Suppliers offering turnkey packages, including valves, actuators, and monitoring software, capture higher margins, especially in the Northeast and Midwest, where replacement urgency is acute. Long procurement cycles favor vendors with proven municipal references.
Industrial IoT-Enabled Predictive Maintenance Adoption
Manufacturers that embed sensors in critical valves enable analytics platforms to detect wear before catastrophic failure, resulting in up to a 30% reduction in valve-related downtime in early pilot programs.[2] This capability resonates in the Midwest industrial belt, where unplanned shutdowns carry high opportunity costs. Integrating edge processing and open communication protocols differentiates suppliers and justifies premium pricing. Predictive maintenance also shifts revenue toward subscription-based software and services, diversifying income streams beyond initial equipment sales.
Hydrogen-Ready Valve Design Standards Emerging
New DOE-backed standards require materials that withstand hydrogen embrittlement and limit leakage to below 10^-6 sccs.[3] California and Gulf Coast hubs demand certified valves for pipelines, refueling stations, and industrial processes. Manufacturers that deploy specialized coatings and precision machining can extend valve life by up to 60%, thereby reducing the total cost of ownership for operators. Early compliance positions suppliers to win long-term framework agreements as the hydrogen economy scales.
Restraints Impact Analysis of United States Valves Market*
| Restraint | (~) % Impact on CAGR Forecast | Geographic Relevance | Impact Timeline |
|---|---|---|---|
| Steel and alloy price volatility squeezing OEM margins | -0.4% | National, strongest in steel-intensive regions | Short term (≤ 2 years) |
| Skills gap in smart-valve commissioning and maintenance | -0.3% | National, acute in rural and industrial areas | Medium term (2-4 years) |
| Cybersecurity concerns slowing connected valve deployments | -0.25% | National, critical infrastructure sites | Medium term (2-4 years) |
| High upfront cost of valve automation systems limiting adoption | -0.2% | National, cost-sensitive municipal and industrial users | Short term (≤ 2 years) |
| Source: Mordor Intelligence | |||
Steel and Alloy Price Volatility Squeezing OEM Margins
Spot steel prices fluctuated 40-60% in 2024, compressing margins for valve makers locked into long-term contracts. Smaller companies lacking hedging programs face greater earnings swings, sometimes redesigning products with alternative materials. Surcharge clauses and index-based pricing help larger firms offset volatility, but implementation requires customer negotiation and system updates. Volatility also complicates inventory planning, raising working capital requirements and potentially delaying innovation spending.
Skills Gap in Smart-Valve Commissioning and Maintenance
Roughly 35-40% of current technicians need upskilling to install and service connected valves, according to industry surveys. Rural municipalities and small plants feel the pinch most acutely, which slows the adoption of advanced automation. Training programs and partnerships with technical colleges progress slowly, leaving operators dependent on third-party specialists and elevating lifecycle costs. Vendors that bundle training and remote support differentiate their offers but must absorb additional service costs.
*Our forecasts treat driver/restraint impacts as directional, not additive. The impact forecasts reflect baseline growth, mix effects, and variable interactions.
United States Valves Market Segment Analysis
By Type:
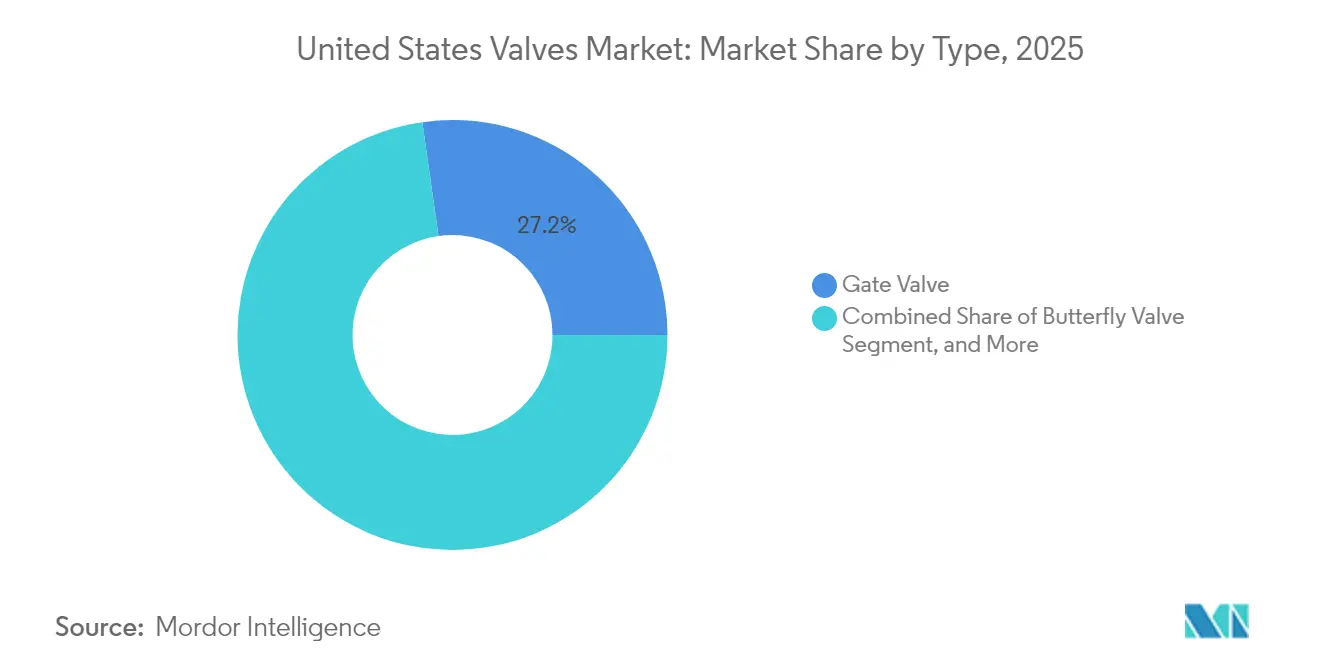
Gate Valves Lead Despite Butterfly SurgeGate valves held 27.24% of the U.S. valve market share in 2025, reflecting their entrenched use in pipelines and water networks, where tight shut-off is mandatory. Their established specifications make them the default choice in many engineering standards, supporting steady demand for replacement. Butterfly valves gain momentum with a 5.05% CAGR, prized for compact footprints and fast quarter-turn operation in HVAC and automated process lines. The U.S. valves market size for butterfly designs grows as facility owners prioritize energy efficiency and remote control. Globe and check valves remain staples for throttling and backflow prevention, while control valves occupy higher-value niches driven by precision requirements. Growth in additive manufacturing prototypes enables rapid customization; however, large-scale production still favors traditional casting due to cost and durability considerations.
Engineering teams are increasingly evaluating total installed cost rather than purchase price, benefiting butterfly valves where weight savings reduce structural and actuation expenses. Conversely, gate valves maintain dominance in corrosive or abrasive services by offering robust wedge seals and full-bore flow paths. Digital position feedback retrofits allow legacy gate valves to integrate with plant DCS platforms, extending service life and aligning with modern monitoring strategies. Vendors that can support mixed fleets of gate and butterfly valves through unified asset-management software win maintenance contracts, thereby deepening customer stickiness in the U.S. valves market.

By Material:
Steel Dominance Faces Plastic ChallengeSteel products held a 40.88% market share in 2025, underpinned by their high tensile strength and temperature tolerance, which are essential for upstream energy and chemical processing applications. Improved metallurgy and coatings extend mean time between failure, safeguarding steel’s role in critical services. Plastic valves grow at the fastest rate, with a 4.92% CAGR, driven by their corrosion resistance and lower installation weight in water treatment and certain chemical processes. The U.S. valves market size for plastics is expected to expand further as utilities address lead-replacement mandates.
Utilities weigh lifecycle costs, often selecting plastic for low-pressure lines where corrosion drives frequent steel replacement. Hybrid solutions, such as plastic-lined steel bodies, strike a balance between strength and chemical resistance, capturing a share of the mid-pressure range. Alloy-based materials maintain a premium position in extreme environments, such as nuclear and aerospace applications, although limited volumes restrict their market share. Cast iron continues to serve legacy municipal systems, but its use is slowly declining due to its weight and corrosion drawbacks. Material innovations remain pivotal to meeting increasingly stringent environmental and performance standards, especially as the introduction of hydrogen services presents new compatibility challenges.
By Actuation Method:
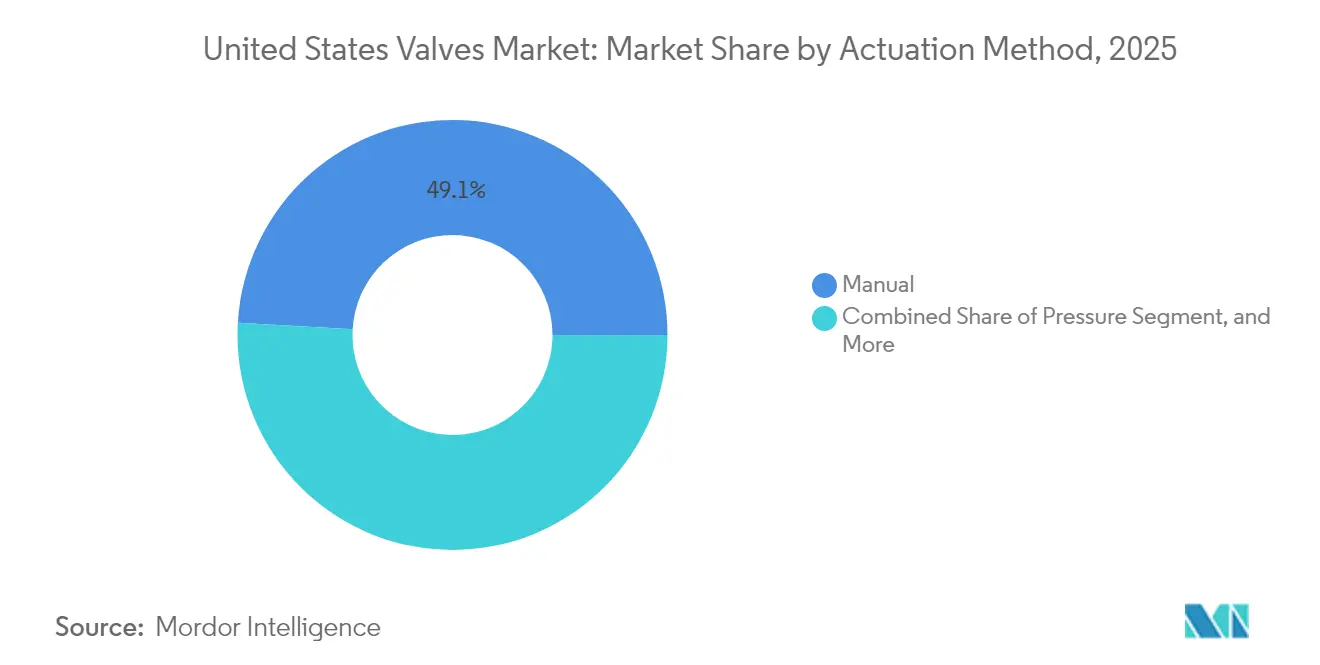
Manual Methods Persist Despite Electric GrowthIn 2025, manual actuation commanded a 49.10% share of the U.S. valves market, underscoring a persistent preference for straightforward, low-capex solutions, especially when automation offers minimal added value. Beyond their primary function, manual overrides play a pivotal role as safety backups in various process industries. Meanwhile, electric actuation is experiencing the fastest growth at a 5.44% CAGR, driven by the integration of IoT, the demand for precise control, and a decline in actuator costs. With the U.S. valves market increasingly leaning towards connected assets, plant operators are gravitating towards electric units that continuously relay health data to predictive maintenance platforms.
Pneumatic actuators are gaining traction in hazardous zones, prioritizing intrinsic safety, whereas hydraulic units continue to be indispensable in high-force scenarios, like those involving large-diameter pipeline valves. Additionally, hybrid electro-hydraulic systems are gaining traction in subsea applications, offering redundancy but also introducing heightened maintenance challenges.
By End-User Industry:
Oil and Gas Leadership Challenged by Food Processing GrowthOil and gas accounted for 32.40 of % U.S. valves market share in 2025, encompassing production, midstream, and refining applications that rely on a broad spectrum of valve types. Activity levels in shale basins and Gulf Coast petrochemical complexes reinforce near-term demand. The food and beverage segment posts the fastest 5.03% CAGR as stringent hygiene rules drive frequent valve replacement with sanitary-design units. Growth parallels investments in automation, such as packaging and cleaning-in-place systems, which demand corrosion-resistant and easily cleanable valves.
Chemical processing, power generation, and water and wastewater treatment present stable replacement cycles tied to regulatory compliance and infrastructure aging. Pharmaceutical manufacturing, although lower in volume, commands high ASPs due to documentation and validation requirements. The mining, pulp, and paper industries seek abrasion-resistant designs, supporting niche suppliers. Collectively, diversified demand profiles buffer the U.S. valves industry against commodity price swings, fostering moderate overall growth.
Geography Analysis
The South led the US valves market with a 35.22% share in 2025. Texas and Louisiana continue investing in refining, LNG export terminals, and carbon-capture retrofits that rely heavily on severe-service valves. Federal incentives for CO₂ sequestration further amplify demand for high-pressure, corrosion-resistant designs. Offshore platforms in the Gulf of Mexico add specialized subsea valve requirements, reinforcing regional dominance.
The West posts the fastest 5.68% CAGR through 2031 as data-center build-outs in Arizona, Nevada, and California mandate precision cooling valves. Renewable energy projects, such as concentrated solar and geothermal plants, introduce high-temperature and erosive service conditions that favor the use of advanced materials. California’s hydrogen-hub roadmap accelerates early deployment of hydrogen-ready valves, positioning the region at the forefront of next-generation specifications.
In the Northeast, aging water distribution networks drive replacement programs, which are financed by federal and state grants. Utilities specify smart, lead-free valves with remote monitoring, creating steady opportunities for IoT-enabled products. The Midwest, anchored by automotive and chemical plants, emphasizes predictive maintenance and process optimization, spurring demand for control valves integrated with plant MES systems. Although exhibiting lower headline growth, both regions generate consistent aftermarket revenue streams that are critical to manufacturer profitability.
Regulatory Landscape
US valve demand is shaped by safety, emissions, and procurement compliance requirements that vary by end-use. For pipelines, PHMSA's valve rule framework requires rupture-mitigation valves (remote-control or automatic shutoff) on new and replaced onshore gas and hazardous liquid pipelines at or above 6-inch diameter. This raises the technical and documentation bar for automated isolation valves and associated actuation packages. Separately, PHMSA incorporated by reference API Specification 6D (25th edition, including addenda through March 2025) via a Federal Register action with a January 1, 2026 effective date. That move reinforces standard-driven sourcing for pipeline valves and tightens conformance expectations across qualified suppliers.
For process industries, EPA leak detection and repair provisions for valves in gas, vapor, and light liquid service keep fugitive-emissions monitoring and recordkeeping central to valve selection, particularly for refineries and chemical plants that specify low-leakage packing and testable designs (including 40 CFR 63.168 and 40 CFR 63.1006). On the trade side, tariff actions under Section 232/301 and the policy direction in the 2026 USTR Trade Policy Agenda add compliance and cost uncertainty for imported valves, castings, and metal inputs. Buyers increasingly screen for suppliers with resilient domestic manufacturing footprints and auditable country-of-origin documentation.
Value Chain Analysis
The US valves value chain starts with raw materials and critical components (steel, stainless, alloys, engineered plastics, castings/forgings, seals/packing, and electronics such as positioners, sensors, and actuator controls). This is followed by machining, coating, assembly, and testing to meet industry standards and end-user specifications. Manufacturers typically sell through a mix of direct channels to EPCs, OEM skids, and large owner-operators, alongside distributor networks serving MRO demand. Aftermarket services (field installation support, spares, diagnostics, and overhaul) are increasingly bundled, especially where connected valves and electric actuation require commissioning and periodic calibration.
Cost and lead-time risk concentrates upstream, where metal price swings and trade actions affect both inputs and imported finished goods. The doubling of Section 232 steel and aluminum tariffs to 50% (June 2025 proclamation referenced in industry discussions) increased incentives for multi-sourcing and for redesigning toward alternative materials in suitable services. It also supported expanded domestic machining capacity to reduce exposure to tariff-driven volatility. Downstream, compliance requirements in municipal water (lead-free components and traceable documentation) and emissions-sensitive process plants (LDAR readiness) reinforce demand for testing, certification, and digital documentation flows. These flows link suppliers, distributors, integrators, and end-users across the asset lifecycle.
Competitive Landscape
The US valves market shows moderate concentration. Top multinationals, such as Emerson Electric, Flowserve, and Crane, capture a significant share through broad portfolios and global service networks. Mid-tier specialists focus on niche technologies, such as severe-service ball valves or sanitary stainless-steel lines, leveraging agility and customer intimacy to counterbalance the scale advantages of larger rivals. Consolidation persists, as illustrated by Flowserve’s USD 290 million acquisition of MOGAS Industries, which enhances its high-pressure ball valve offering and reinforces its energy-sector exposure.
Digitalization differentiates competitors. Emerson’s DeltaV integration for smart positioners underscores strategic emphasis on predictive analytics and seamless control-system compatibility. Parker-Hannifin’s Ohio facility expansion showcases the company's investment in advanced automation and clean-room production to support growing demand from the aerospace and industrial sectors. Cybersecurity and API connectivity become critical tender requirements, prompting alliances with software vendors and cloud providers.
Disruptive entrants are exploring additive manufacturing for rapid prototype turnaround and custom geometries, yet they face hurdles related to scale and certification. Established players respond with in-house 3D printing centers and material R&D to shorten development cycles. Market share battles are increasingly hinging on life-cycle service contracts, spare parts availability, and the ability to train customer personnel on smart-valve platforms. Suppliers offering integrated packages-comprising hardware, software, and field services-strengthen their competitive moats as the US valves market transitions toward outcome-based procurement models.
United States Valves Industry Leaders
-
Emerson Electric Co.
-
Schlumberger Limited
-
Flowserve Corporation
-
Crane Company
-
Rotork plc
- *Disclaimer: Major Players sorted in no particular order

United States Valves Market Companies Covered in this Report
- Emerson Electric Co.
- Schlumberger Limited
- Flowserve Corporation
- Crane Company
- Rotork plc
- Bray International, Inc.
- KITZ Corporation
- Parker-Hannifin Corporation
- Curtiss-Wright Corporation
- Watts Water Technologies, Inc.
- AVK Holding A/S
- Velan Inc.
- Johnson Controls International plc
- Honeywell International Inc.
- Spirax-Sarco Engineering plc
- Pentair plc
- Cameron (SLB)
- AUMA Riester GmbH and Co. KG
- Samson Aktiengesellschaft
- Swagelok Company
Market Opportunities and Future Outlook
A large installed base of legacy manual and pneumatic valves creates a retrofit-led opportunity around digital positioners, wireless modules, and electric actuation upgrades that integrate with plant DCS/SCADA and Industrial Ethernet environments. Procurement shifts toward predictive maintenance and remote diagnostics in industrial operations support this demand, alongside supplier investments in digital tooling. For example, Flowserve's rollout of a cloud-based digital twin platform for control valves (April 2025) and Rotork's acquisition of SignalFire Wireless Telemetry (September 2025) extend long-range monitoring in actuator offerings. For suppliers, retrofit kits, cybersecurity-ready connectivity, and standardized commissioning workflows can help address skills constraints that slow connected deployments. At the same time, these changes support expansion in recurring revenue through software-enabled services.
Infrastructure and energy-transition buildouts also create whitespace for valves engineered for stringent duty cycles and specialized media. Federally funded water infrastructure programs under the Infrastructure Investment and Jobs Act (USD 55 billion allocated for water systems) keep replacement cycles elevated for lead-free and remotely actuated municipal valves. Hydrogen, LNG, and cryogenic applications further reward low-leakage, materials-qualified designs and documented testing. Trade policy and tariffs also support a parallel opportunity for US-based manufacturing, testing, and repair capacity, as buyers reduce reliance on long, import-heavy supply chains and prioritize shorter lead times and auditable compliance for critical-service valves.
Recent Industry Developments in United States Valves Market
- June 2026: Flowserve completed the acquisition of Trillium Flow Technologies' valves division for USD 490 million, expanding its footprint in nuclear and traditional power generation valves. The deal deepens Flowserve's engineered-to-order portfolio and broadens qualification pathways where nuclear-grade documentation and lifecycle service capabilities influence supplier selection.
- July 2025: Crane launched a line of bellows seal globe valves for hydrogen transfer applications in the United States. The product focuses on tighter sealing performance in hydrogen service, supporting end-users pursuing hydrogen handling upgrades and raising competitive stakes in specialty, low-leakage valve designs.
- July 2024: Emerson introduced AVENTICS Series XV pneumatic valves with support for multiple industrial communication protocols, including PROFINET, Ethernet/IP, and IO-Link. Multi-protocol connectivity helps standardize valve islands across diverse automation architectures, supporting faster integration and easier retrofits in factory automation environments.
United States Valves Market Report Scope and Research Methodology
Market Definition and Coverage
For this report, the market covers revenues earned in the United States from industrial valves used to control, direct, or regulate flow in pipelines, plants, buildings, and utility networks. This includes the valve body types and actuation options that are purchased for new builds and for maintenance needs.
Scope exclusions: Consumer household valves, implantable medical valves, and valves embedded as minor OEM parts in small appliances are not counted in this market sizing.
Segments Covered in This Report
- By Type
- Ball Valve
- Butterfly Valve
- Gate Valve
- Globe Valve
- Check Valve
- Plug Valve
- Control Valve
- Other Types
- By Material
- Steel
- Cast Iron
- Alloy-Based
- Plastic
- Other Materials
- By Actuation Method
- Manual
- Pneumatic
- Electric
- Hydraulic
- Other Actuation Methods
- By End-User Industry
- Oil and Gas
- Power Generation
- Chemical
- Water and Wastewater
- Mining
- Food and Beverage
- Pharmaceuticals
- Other End-User Industries
- By Region
- Northeast
- Midwest
- South
- West
Data Sources, Market Sizing, and Validation
Desk Research
Desk research started with mapping demand pockets where valves are routinely specified, then tying those pockets to publicly visible signals. We referenced sources such as the US Census Bureau and Bureau of Labor Statistics for industrial activity and price trends, the US Energy Information Administration for oil and gas and power indicators, and the US Geological Survey for upstream production context where relevant to flow control equipment.
We also reviewed technical and procurement context from sources such as the Environmental Protection Agency and US Army Corps of Engineers (water and infrastructure programs), plus standards and market context available through groups such as API and ASME. In addition, company filings, investor presentations, and reputable press were used to understand product mix shifts, backlog language, and channel movement. A paid subscription covering company financials, plus a separate paid subscription covering shipment-level import and export data, were then used selectively to test directional changes. These are illustrative sources only, and other public and paid references were also used for data collection, validation, and clarification during the work.
Primary Interviews and Surveys
Primary work focused on interviews and short surveys with manufacturers, distributors, EPC and MRO buyers, and end users across energy, chemicals, water, power, and general process industries. We used these discussions to confirm what is typically included in a valve purchase order, how pricing is being reset across alloys and actuation, and where lead times and replacement cycles are changing. Because this is a US-only market, the interviews were balanced across major industrial corridors and utility-heavy states so the model does not rely on one end-use pocket.
Distribution of primary research fieldwork respondents
| Company type | Respondent position |
|---|---|
| Top tier: 31% | CXOs: 18% |
| Mid tier: 51% | Functional/Unit leaders: 33% |
| Smaller Players: 18% | Managers: 49% |
Market-Sizing & Forecasting
The sizing logic starts from a top-down build where sector output and capital spend signals are converted into a valve demand pool using usage intensity and replacement assumptions that were checked with buyers and channel partners. Once the total is formed, we corroborated it with selective bottom-up approximations, such as sampled average selling price by valve type and actuation multiplied by observed shipment and install activity, then adjusted for gaps where coverage is thin.
Inputs used in the model include indicators such as upstream and midstream activity, water and wastewater project awards, power generation additions and retirements, industrial production trends, and observed movements in materials and actuation mix (pneumatic versus electric), since these shift valve volumes and the price per unit. Forecasting used scenario analysis supported by a light multivariate regression layer, where the forward path for industrial output, energy investment, and infrastructure spend was stress tested with expert feedback before finalizing the yearly curve. When bottom-up checks were incomplete for a niche valve class, we filled the gap using end-use spending shares and validated the implied per-site replacement intensity in follow-up calls.
Data Validation & Update Cycle
Validation is done in steps so the final numbers are not driven by one dataset or one person. We compare model outputs against independent signals like trade direction, reported pricing commentary, and end-use capex and maintenance cues, then review outliers until the drivers are clearly explained.
Before sign-off, the model and assumptions go through peer review, followed by a final variance check across end-use demand shares and year-on-year movements. The report is refreshed annually, and interim updates are made when material events occur, such as sharp commodity-linked price swings or a major change in infrastructure funding. Right before delivery, an analyst performs a fresh pass so clients receive the latest updated view.
Mordor Intelligence's United States Valves Market Size Compared Against Other Published Estimates
Published market values for US valves can vary widely because the scope boundary is not consistent, and because pricing and replacement assumptions are set differently across end users. Differences also show up when one estimate tracks manufacturing output, while another follows installed base demand, which then changes what is counted as the addressable market.
Import and export valve shipment trends, together with end-use capex and maintenance signals from major US industries, are the checks that keep Mordor Intelligence tied to a buyer-side demand pool rather than a factory output view. The main gap drivers behind other figures in the table are usually the inclusion of adjacent flow-control items, different treatment of actuation and control components, and the timing of currency and price updates used to convert unit demand into revenue.
Benchmark comparison
| Source | Market Size | Gaps in Research Methodology |
|---|---|---|
| Mordor Intelligence | USD 19.02 B (2025) | |
| Trade Journal A | USD 8.57 B (2023) | Uses an industrial valve lens with a narrower end-use set and an earlier year, and it often undercounts project-driven water and utility demand and some higher-value actuation mixes. |
| Industry Database B | USD 27.40 B (2026) | Represents manufacturing industry revenues, which can include broader valve output and related fluid power categories, and it can be inflated versus consumption when exports and inter-industry sales are large. |
The spread mainly comes down to whether the number is built from demand in operating sites or from factory-side industry output, plus what is bundled into the definition of a valve sale. With a clear US-only boundary, a stated base year (USD 19.02 B in 2025), and repeatable checks against observable demand signals, the result stays practical for planning and can be re-created as assumptions change.
Key Questions Answered in the Report
What is the current value of the US valves market?
The US valves market size stands at USD 19.94 billion in 2026.
How fast is the US valves market expected to grow?
It is projected to expand at a 4.86% CAGR, reaching USD 25.28 billion by 2031.
Which valve type is growing the quickest?
Butterfly valves show the highest growth, advancing at a 5.05% CAGR through 2031.
Which region leads US valve demand?
The South accounts for 35.22% of national demand due to energy and petrochemical activity.
What is the main restraint on smart-valve adoption?
A nationwide skills gap in commissioning and maintaining connected valves slows deployment.
Which actuation technology is gaining ground fastest?
Electric actuators record the strongest 5.44% CAGR as plants digitize operations.