
Market Overview
| Study Period | 2020 - 2031 |
|---|---|
| Forecast Data Period | 2026 - 2031 |
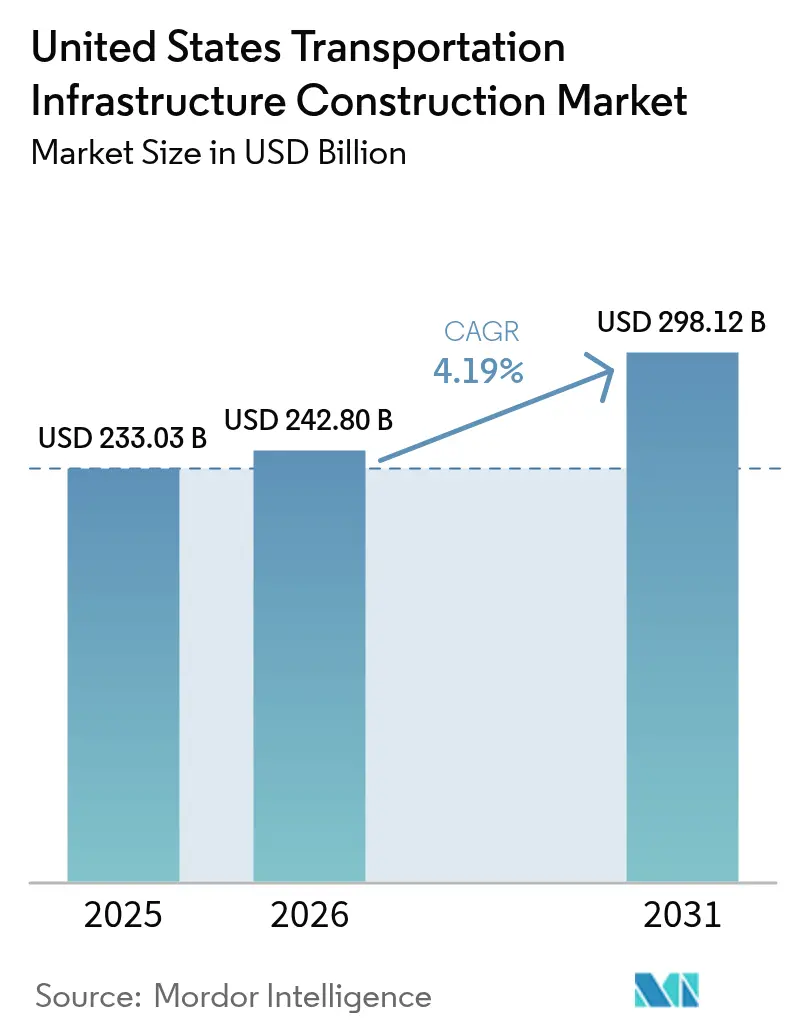
| Base Year Market Size (2025) | USD 233.03 Billion |
| Market Size (2026) | USD 242.8 Billion |
| Market Size (2031) | USD 298.12 Billion |
| Growth Rate (2026 - 2031) | 4.19 % |
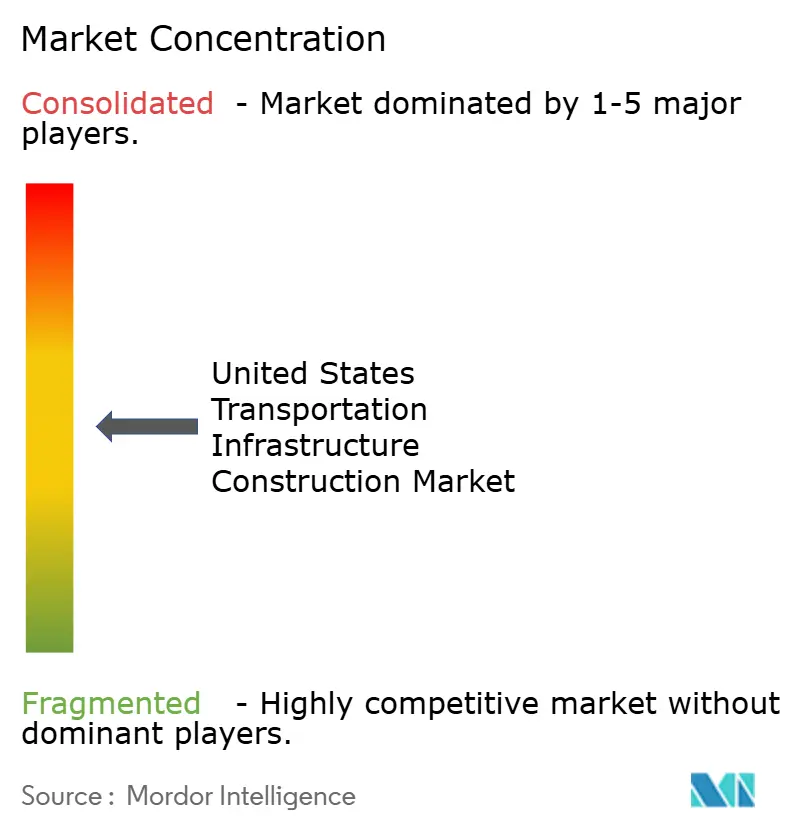
| Market Concentration | Medium |
Major Players *Disclaimer: Major Players sorted in no particular order Image © Mordor Intelligence. Reuse requires attribution under CC BY 4.0. | |
United States Transportation Infrastructure Construction Market Analysis by Mordor Intelligence
The United States Transportation Infrastructure Construction Market size is expected to grow from USD 233.03 billion in 2025 to USD 242.8 billion in 2026 and is forecast to reach USD 298.12 billion by 2031 at 4.19% CAGR over 2026-2031. Robust federal appropriations under the Infrastructure Investment and Jobs Act (IIJA), rising state‐level allocations, and growing private capital participation are sustaining this growth momentum. Public dollars remain the market’s financial anchor, but public-private partnerships are accelerating complex megaproject delivery timelines. Rail, aviation, and electric-vehicle (EV) charging corridors are emerging as complementary focal points to the country’s vast highway network. Contractors are countering skilled-labor shortages and material-price swings by investing in digital workflows and modular methods, fostering productivity gains that partially offset cost inflation. Even so, execution risks tied to funding-match gaps and volatile input prices persist, particularly in rural counties and small metropolitan areas.
Key Report Takeaways
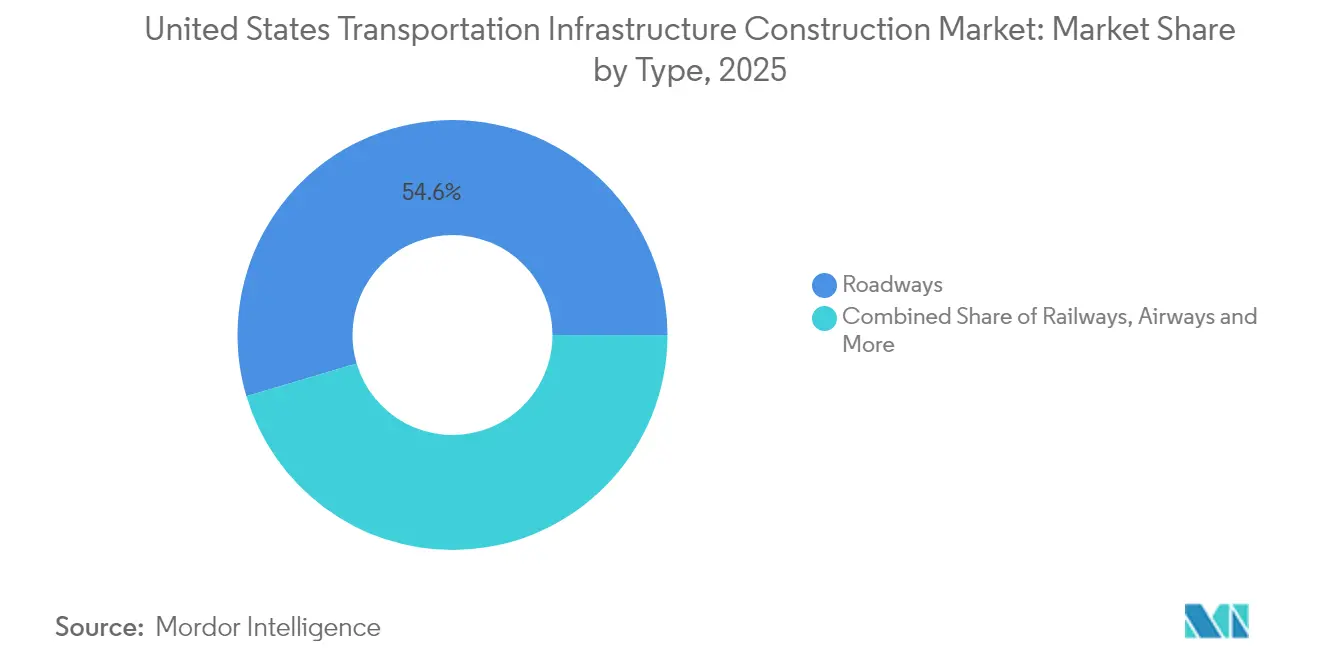
- By type, roadways led with 54.60% revenue share of the US transportation infrastructure construction market in 2025, while railways are forecast to post the fastest 5.18% CAGR to 2031.
- By construction type, new construction accounted for 60.30% of the US transportation infrastructure construction market size in 2025 and is projected to grow at a 4.95% CAGR through 2031.
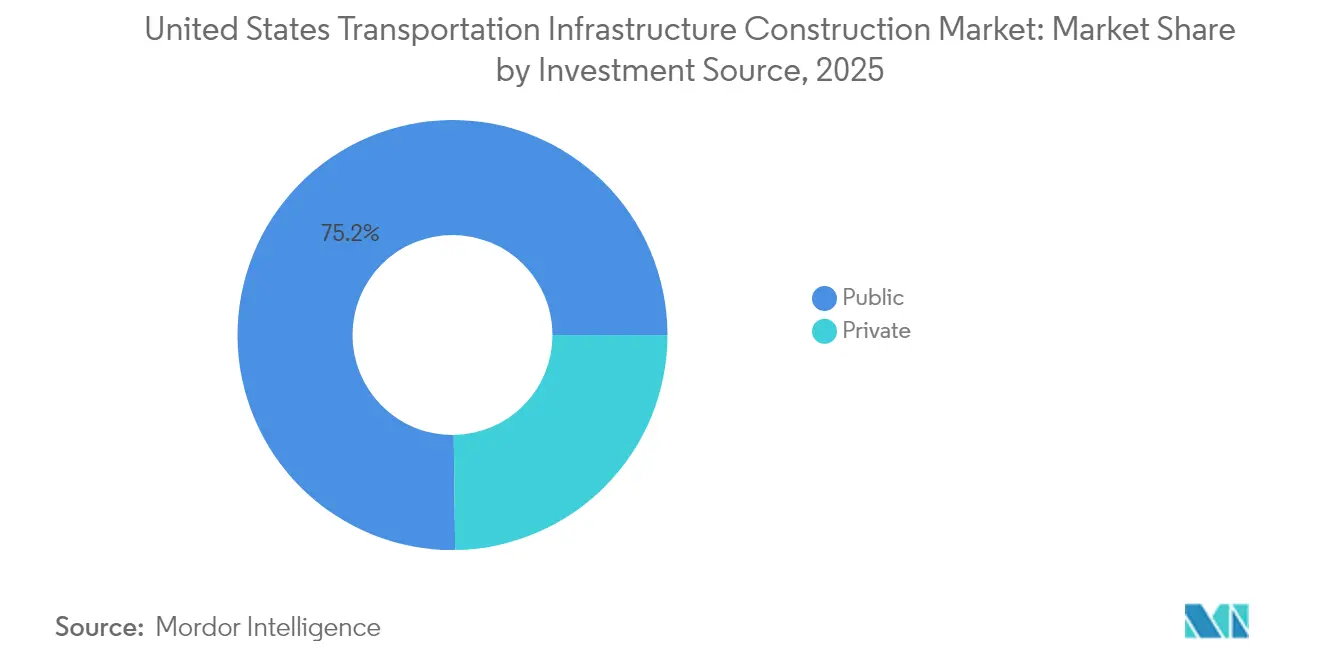
- By investment source, public funds represented 75.20% of spending in 2025; the private-capital segment is advancing at a 5.32% CAGR, reflecting deeper public-private-partnership pipelines.
- By geography, Texas commanded 10.85% of 2025 spending and is expected to register a 4.86% CAGR between 2026 and 2031, the highest among all states.
Note: Market size and forecast figures in this report are generated using Mordor Intelligence’s proprietary estimation framework, updated with the latest available data and insights as of 2026.
United States Transportation Infrastructure Construction Market Trends and Insights
Drivers Impact Analysis*
| Driver | (~) % Impact on CAGR Forecast | Geographic Relevance | Impact Timeline |
|---|---|---|---|
| Ongoing Federal & State Rail Initiatives | +1.2% | Northeast Corridor, California, Texas | Medium term (2-4 years) |
| E-commerce Freight Connectivity | +0.9% | Urban logistics hubs & port regions | Long term (≥ 4 years) |
| Airport Revitalization Programs | +0.8% | Major metropolitan airports | Medium term (2-4 years) |
| Nationwide EV Charging Roll-out | +0.7% | CA, NY, FL, TX, national corridors | Short term (≤ 2 years) |
| Source: Mordor Intelligence | |||
Ongoing Federal and State Rail Initiatives Supporting Long-Distance and Regional Corridor Upgrades
The USD 66 billion rail allocation embedded in the IIJA is triggering a wave of projects aimed at capacity, safety, and passenger-service improvements. Since January 2025, the Railroad Crossing Elimination Grant Program has awarded USD 1.1 billion across 123 projects, removing chokepoints that slow both freight and passenger services. Amtrak’s goal of 64 million riders by 2040, up from 33 million pre-pandemic, is sharpening the focus on double-tracking, signaling upgrades, and station overhauls. Private rail operators are complementing federal outlays; Norfolk Southern’s USD 200 million freight-corridor upgrade in Alabama exemplifies this synergy.
E-Commerce Expansion Driving Nationwide Demand for Freight Terminals, Warehousing, and Intermodal Connectivity
E-commerce sales volumes are heightening the need for freight-terminal capacity, short-haul rail spurs, and last-mile delivery depots. Colorado’s 2024 Freight Plan cites rising parcel traffic as a catalyst for intermodal yard redesigns. Warehouse construction costs climbed 38% between 2020 and 2023 before stabilizing in 2024, underscoring the capital intensity of logistics real estate. Containerized freight movements reached record highs in 2024, further stretching terminal throughput.
Airport Revitalization Programs Advancing Terminal Expansions, Runway Upgrades, and Safety Enhancements
Ongoing airport revitalization programs across the United States are significantly transforming aviation infrastructure, with a strong push toward modernizing terminal facilities, enhancing runway capacity, and integrating multimodal connectivity. Backed by the Airport Terminal Program, which allocates approximately USD 1 billion annually, airports are upgrading critical components such as gates, baggage handling systems, and passenger access points.
Major capital programs like Sacramento International Airport’s USD 1.3 billion SMForward initiative and Miami International Airport’s USD 7 billion expansion plan exemplify the scale of investment aimed at accommodating future demand. According to the Federal Aviation Administration, passenger enplanements are expected to increase by 38% by 2033, further driving the need for extended runways, advanced safety systems, and seamless intermodal transfer facilities. These programs underscore a broader federal and regional commitment to enhancing the resilience, efficiency, and passenger experience across the U.S. airport network.
Nationwide EV Infrastructure Deployment Integrating Charging Stations Across Highway Networks and Urban Centers
The rapid rollout of electric vehicle (EV) infrastructure is emerging as a key growth driver for the U.S. transportation infrastructure construction market. By late 2024, over 183,000 public charging ports, including 43,152 DC fast chargers, had been deployed, reflecting accelerating demand for EV-ready transport corridors. Under the NEVI formula program, the federal government aims to install 500,000 public chargers by 2030, supported by USD 7.5 billion in IIJA funding.
Recent allocations, including USD 635 million announced in January 2025 to add 11,500 ports across 27 states, are fueling construction activity, particularly in underserved areas, where two-thirds of the funding is directed. In parallel, utilities plan to invest USD 5.3 billion in grid modernization to support a projected 78.5 million EVs on U.S. roads by 2035. These investments are stimulating demand for civil works, electrical infrastructure, and roadside facilities, reinforcing EV infrastructure as a transformative force in U.S. transport development.
Restraints Impact Analysis*
| Restraint | (~) % Impact on CAGR Forecast | Geographic Relevance | Impact Timeline |
|---|---|---|---|
| Gaps in Federal–State Matching Funds | -0.6% | Rural & economically disadvantaged areas | Medium term (2-4 years) |
| Skilled-Labor Deficits | -0.8% | High-growth states, national | Short term (≤ 2 years) |
| Construction Input Price Volatility | -0.7% | National | Short term (≤ 2 years) |
| Source: Mordor Intelligence | |||
Gaps in Federal–State Matching Requirements Creating Bottlenecks for Transportation Projects in Underserved Regions
The Congressional Research Service projects a USD 40 billion annual shortfall in the Highway Trust Fund by decade-end if current outflows persist. Rural counties often lack fiscal headroom to supply matching dollars, delaying bridge reconstructions, road widenings, and rural transit hubs. Proposed cuts in the House continuing-resolution draft would remove USD 2 billion earmarked for local safety projects, aggravating already thin capital pipelines.
Widespread Skilled Labor Deficits Driving Higher Construction Costs and Project Delays
The U.S. transportation infrastructure market is under strain from a persistent skilled labor shortage, despite a recent decline in construction job openings to 248,000 in April 2025. Wage pressures remain acute, with the average hourly pay climbing to USD 36.05[2], reflecting intense competition for qualified workers. This labor gap continues to drive up construction costs and contributes to delays in major infrastructure projects, particularly those requiring specialized skills in transit, electrical, and bridge systems. Compounding the issue, existing training pipelines are misaligned with market needs, limiting the industry’s ability to meet rising demand despite robust federal funding.
*Our forecasts treat driver/restraint impacts as directional, not additive. The impact forecasts reflect baseline growth, mix effects, and variable interactions.
Segment Analysis
By Type: Roadways Dominate Infrastructure Investment
The roadways segment kept its lead in 2025, accounting for 54.60% of total spending. Highways remain the backbone of U.S. mobility, and investors took notice: contract awards for highways and bridges hit a record USD 121 billion in 2024. Federal backing is equally strong. The Infrastructure Investment and Jobs Act set aside about USD 350 billion for highway programs through 2026, while the Biden-Harris Administration sent USD 62 billion to states for FY 2025, USD 18.8 billion more than in FY 2021. Industry leaders such as Bechtel, AECOM, and Skanska are vying for new interstate widenings and bridge replacements that upgrade aging assets.
Railways are growing fastest, with a 5.18% CAGR projected for 2026-2031. A USD 66 billion federal infusion under the IIJA is the main catalyst. In January 2025, the Federal Railroad Administration awarded USD 1.1 billion across 123 projects to remove grade crossings and improve safety. The airways segment benefits from an annual USD 1 billion Airport Terminal Program that funds terminal upgrades. Ports and inland waterways receive another USD 450 million through the FY 2025 Port Infrastructure Development Program. Better links among these modes are now essential: Colorado’s 2024 Freight Plan highlights intermodal projects that align highways, rail spurs, and distribution hubs to meet e-commerce demand freight.colorado.gov.

By Construction Type: New Construction Addresses Capacity Constraints
New builds represented 60.30% of the US transportation infrastructure construction market size in 2025 and are expected to expand at a 4.95% CAGR through 2031, supported by an 8.5% predicted rise in 2025 construction starts. Megaproject pipelines feature USD 49 billion in upcoming terminal works and USD 33 billion in highway increments. Capacity-driven projects in fast-growing Sun Belt metros emphasize additional lanes, flyovers, and managed toll lanes—each requiring extensive right-of-way acquisition and complex staging schedules, thereby favoring large, vertically integrated contractors.
Renovation activity, though slower growing, remains critical for legacy asset upkeep. The 2025 American Society of Civil Engineers Report Card raised overall infrastructure scores, yet highlighted a USD 3.7 trillion repair backlog. Asset owners are blending repair scopes into larger corridor upgrades to limit user disruption. Digital twin models and reality-capture scans are now standard in design packages, enhancing precision in rehabilitation plans—a practice increasingly embedded across the US transportation infrastructure construction industry.
By Investment Source: Private Capital Accelerates Growth
Public funds still anchor 75.20% of spending, but private capital’s 5.32% CAGR through 2031 signals shifting financing dynamics. The Build America Bureau’s May 2025 pipeline lists USD 12.7 billion in credit-assistance requests, including the Midtown Bus Terminal replacement and multiple intercity railcars procurements. Electric utilities are channeling USD 5.3 billion into EV charging grids, further boosting privately financed workloads. Capital-stack innovation—blending TIFIA loans, private-activity bonds, and equity tranches—is unlocking schedules otherwise hampered by public-budget constraints, strengthening value creation across the US transportation infrastructure construction market.
Geography Analysis
Texas captured 10.85% of the 2025 expenditure and is projected to expand at a 4.86% CAGR through 2031, the highest growth trajectory in the US transportation infrastructure construction market. The USD 148 billion Unified Transportation Program earmarks USD 43 billion for roadway development and maintenance, anticipating a 34% population surge by 2050. Over 3,181 publicly accessible charging locations position Texas for accelerated EV uptake. Freight corridor upgrades plus border-crossing enhancements amplify the state’s logistics competitiveness.
California remains a heavyweight, despite the governor’s USD 4.3 billion in transportation budget shifts for FY 2024-25. The state leads with 15,673 charging locations and is deploying 1,100+ new EV ports across two funding solicitations under its NEVI plan. Senate Bill 1 continues to stimulate county-level economic output, bolstering construction demand. Sustainable-transport planning grants prioritize climate resilience, multimodal access, and zero-emission freight corridors.
New York, Florida, and Illinois comprise the remaining top-five spenders. New York’s proposed USD 68.4 billion MTA capital plan elevates subway accessibility and railcar procurement. Florida tracks input costs closely; asphalt dropped 8.1% to USD 167 per ton in early 2025, slightly easing highway budget pressures. Illinois leverages IIJA dollars to modernize inland waterways critical for Midwest grain exports. Regions lacking fiscal capacity continue to struggle with matching-fund gaps, widening service disparities across the broader US transportation infrastructure construction market.
Regulatory Landscape
Federal-aid transportation construction is governed primarily by the U.S. Department of Transportation (USDOT) and modal agencies such as the Federal Highway Administration (FHWA) and Federal Railroad Administration (FRA), with highway program delivery tied to Title 23 requirements and FHWA oversight of plans, specifications, and estimates (PS&E). A central compliance lever for project inputs is Buy America/Build America, Buy America Act (BABA) coverage for iron, steel, manufactured products, and construction materials used on federally assisted projects, which directly affects sourcing, submittals, and documentation across highway, bridge, and EV charging scopes.
Policy timing is also a factor heading into 2026. USDOT advanced FY 2026 budget priorities (USD 147.1 billion total budget, including IIJA advance appropriations), and FHWA actions continued to refine standards and waivers used by owners and contractors. FHWA issued errata to the FP-24 Standard Specifications in January 2026, and it proposed modifications to a Buy America waiver for electric vehicle chargers in February 2026, signaling tighter linkage between NEVI corridor build-outs and domestic-content compliance. Separately, new Buy America manufactured-product requirements take effect in October 2026, with a 55% domestic component-cost threshold, raising compliance demands for equipment-intensive scopes such as ITS, lighting, and charging hardware.
Value Chain Analysis
The value chain spans planning and funding (USDOT/FHWA, FRA, FAA, port authorities, state DOTs, and MPOs), design and program management (AECOM, Jacobs, HDR, Parsons and similar A/E firms), construction delivery (heavy civil primes and design-build teams such as Bechtel, Kiewit, Skanska, Fluor, Granite, Walsh), and materials and equipment suppliers (aggregates, asphalt, cement, steel, precast, signaling and electrification systems, chargers, and grid interconnect gear). Execution increasingly relies on financing and procurement mechanisms that run alongside traditional letting, including federal credit and P3 structures. For example, the Build America Bureau pipeline listed USD 12.7 billion in credit-assistance requests in May 2025, supporting large, complex packages that pull forward engineering and early works.
Supply-side constraints continue to shape cost and schedule outcomes across transportation packages, with recurring bottlenecks cited for items such as aluminum components (mast arms, poles, signs), glass beads for pavement markings, fiber optic cable, epoxy, and plastic pipe and conduit. Build America/BABA compliance and waiver processes add transaction steps to procurement, and bidding depth has been lower versus pre-2022 norms on federal-aid work, affecting price competition for owners. Funding cadence also feeds into delivery: as of April 2025, USDOT had obligated 59% of available IIJA funding, increasing pressure on agencies and contractors to package and award work before current surface transportation program authority ends on September 30, 2026.
Competitive Landscape
The U.S. transportation infrastructure construction market is moderately concentrated, with major firms such as Bechtel Corporation, Fluor Corporation, AECOM, Skanska, Kiewit, and Turner Construction leading the execution of large-scale projects. These companies play a significant role in shaping national infrastructure development, particularly in complex, high-value undertakings. Increasingly, digital capabilities and strong ESG credentials are becoming key differentiators in securing project bids and maintaining long-term competitiveness.
Fluor posted USD 15.5 billion in 2023 revenue, with 76% of its backlog now reimbursable, signaling a preference for lower-risk contract structures. Skanska is piloting AI-enabled equipment tracking to mitigate idle time and reduce carbon footprints.
Merger and acquisition activity remains brisk: Home Depot’s USD 18.3 billion purchase of SRS Distribution and Quikrete’s USD 6 billion Summit Materials acquisition exemplify upstream consolidation aimed at securing material supplies. Specialty contractors are carving niches in EV-charging installations and climate-resilient retrofits, expanding the competitive field while keeping the US transportation infrastructure construction market dynamic.
United States Transportation Infrastructure Construction Industry Leaders
-
Bechtel Corporation
-
Fluor Corporation
-
Kiewit Corporation
-
AECOM
-
Skanska USA
- *Disclaimer: Major Players sorted in no particular order
Market Opportunities and Future Outlook
Programmatic opportunities cluster in the 2026 window as owners move remaining formula and discretionary dollars into construction-ready packages, especially on bridges, highway corridors, and safety upgrades. A concrete anchor is the Bridge Formula Program funding level cited for fiscal year 2026 (USD 5.5 billion), which supports bridge replacement, rehabilitation, preservation, and new construction. That scale sustains repeatable demand for heavy civil primes and specialty bridge subcontractors. FHWA also continued to open competitive grant channels in 2026, including NOFO activity for the Nationally Significant Federal Lands and Tribal Projects program (FY24-26), supporting roadway and bridge scopes in federal lands and tribal areas where procurement pathways and compliance requirements differ from typical state DOT lettings.
A second opportunity theme is digital delivery and data infrastructure moving from pilot use into owner frameworks. In March to April 2026, industry bodies such as ARTBA engaged USDOT on a national strategy for transportation digital infrastructure. This creates vendor and contractor opportunities around standardized data environments, BIM for infrastructure, and construction management system integration that can reduce rework across multi-year corridor programs. On the rail side, FRA publishing of the 2026 Northeast Corridor Project Inventory in April 2026 provides a clearer pipeline reference for capacity, state-of-good-repair, and station or corridor upgrades, which sponsors can convert into A/E, enabling works, and track-and-systems construction packages as projects move into funded delivery.
Recent Industry Developments
- July 2026: Fluor entered into a long-term agreement with Aramco to provide program management consultancy services across Aramco's global capital projects. While not US public works, the agreement reinforces Fluor's program management and mega-project delivery positioning, which can influence how the company allocates leadership capacity, delivery systems, and supply-chain relationships across its broader infrastructure and industrial portfolio.
- May 2026: Skanska, in a joint venture, won a USD 1.06 billion design-build contract from the Massachusetts Bay Transportation Authority to replace the North Station Draw One rail bridge in Boston. The award adds a major rail structure package to the US pipeline and highlights continued use of large design-build contracting for complex, constrained urban rail assets.
- January 2025: The Biden-Harris Administration awarded USD 635 million to add about 11,500 public EV charging ports across 27 states, with a stated focus on disadvantaged communities. The funding pushes more NEVI-related civil and electrical scopes into procurement, increasing demand for contractors that can execute utility coordination, site works, and equipment installation under federal domestic-content and reporting requirements.
Research Methodology Framework and Report Scope
Market Definition and Coverage
This market covers the value of construction activity tied to transportation infrastructure in the United States, where work is executed for roads and bridges, rail and transit, airports, and ports or inland waterways, including new build and major rehabilitation work.
Scope exclusions: routine minor maintenance, day-to-day patching, and purely building works inside terminals or stations are not counted.
Segmentation Overview
- By Type
- Roadways
- Railways
- Airways
- Ports and Inland Waterways
- By Construction Type
- New Construction
- Renovation
- By Investment Source
- Public
- Private
- By States
- Texas
- California
- Florida
- New York
- Illinois
- Rest of US
Data Sources, Market Sizing, and Validation
Desk Research
Desk work starts with mapping what public datasets say about transportation construction spending and active project pipelines, and then aligning those series to the report scope. We rely on sources such as the US Census Bureau construction put-in-place series, the Bureau of Transportation Statistics, Federal Highway Administration program data, and Federal Transit Administration funding releases. We also pull from US DOT, FAA, and USACE publications where mode-level project signals are available.
After that, we cross-check with state DOT budget documents, public procurement portals, audited agency financials, and company filings and investor presentations that discuss backlog and transportation exposure. In a few places, we also use paid databases for company financials and intelligence, news and financials, and contracts and tenders to confirm timing of awards and the size band of major packages. The sources named above are illustrative, and there were many other references used for data collection, validation, and clarification.
Primary Interviews and Surveys
Primary work is used to pressure-test the desk assumptions that most often move the total, such as how fast budgets turn into awarded work and how rehabilitation mixes with new build by mode. We spoke with a mix of contractors, engineering and project management firms, material suppliers, and public owners, then validated pricing and volume logic through follow-up checks across regions with different funding and seasonality patterns.
Distribution of primary research fieldwork respondents
| Company type | Respondent position |
|---|---|
| Top tier: 37% | CXOs: 12% |
| Mid tier: 45% | Functional/Unit leaders: 41% |
| Smaller Players: 18% | Managers: 47% |
Market-Sizing & Forecasting
Sizing starts from a top-down reconstruction of transportation infrastructure construction using public spending and work-put-in-place indicators, then adjusted to match the included scope of new build and major rehabilitation across modes. To avoid over-counting, we separate funding announcements from executed work, and then apply mode-level allocation keys that are checked with agency releases and project pipeline visibility.
The totals are corroborated with selective bottom-up approximations, mainly by sampling typical project values and expected award-to-work conversion, then checking those against contractor backlog commentary, tender activity, and observed cost movements. Practical inputs in this market include highway and bridge share of transportation construction, federal versus state and local contribution patterns, the rehabilitation to new build split, seasonality driven by weather windows, and construction cost index movement that shifts nominal values even when volumes are flat.
For forecasting, we rely on scenario analysis supported by simple time series checks, where federal program outlays, state transportation budgets, and tender intensity are treated as lead indicators. When bottom-up checks have gaps (for example, when a state pipeline is visible but award timing is unclear), we use conservative conversion ranges and then re-validate the range with local interviews before finalizing the year totals.
Data Validation & Update Cycle
Outputs are cross-verified against independent signals, including construction put-in-place trends, program obligation data, and large project award announcements, so one unusual series does not distort the full market. Variances are reviewed in steps: first by the analyst building the model, then through a second review that checks unit logic, year alignment, and any sharp step changes.
If a new funding release, major award cycle shift, or construction cost move materially changes the market path, we trigger follow-up outreach and update the assumptions used in the model. Reports are refreshed annually, and interim updates are made when large events affect spending timing or pricing. Before delivery, a final review pass is done so clients receive the most current view available at the time of publication.
Mordor Intelligence's United States Transportation Infrastructure Construction Market Size Measured Against Other Published Estimates
Published market sizes for this space often look far apart because the boundary between transportation construction, broader infrastructure, and general construction is not applied the same way. Differences also show up when one estimate follows work put in place, while another leans more on announced budgets or awarded contracts, which can shift totals by year.
A big spread also comes from how cost inflation is handled, how quickly assumptions are refreshed, and which year is treated as the pricing reference for currency and index timing, along with which modes are included in full versus partially. By keeping pricing updates and anomaly checks on a tight cadence and tying them back to construction activity signals, Mordor Intelligence avoids carrying forward outdated cost curves into the current-year total.
Benchmark comparison
| Source | Market Size | Gaps in Research Methodology |
|---|---|---|
| Mordor Intelligence | USD 233.03 B (2025) | |
| Trade Journal A | USD 371.25 B (2024) | Uses a broader construction value framing that can include adjacent infrastructure and a different base year, so totals can rise when more categories are counted and prices are captured in a higher-inflation window. |
| Industry Association B | USD 214.00 B (2024) | Anchored to construction put-in-place tracking for transportation construction overall, which can understate multi-year awarded programs in early phases and may not align to major rehabilitation versus new build boundaries used in market sizing. |
In practice, the table shows that year selection, price timing, and what gets classified as transportation infrastructure construction are the main drivers of variation. Our approach keeps the scope tied to defined transportation assets and validates year values against multiple activity signals, which makes the final number easier to reconcile back to observable inputs.
Key Questions Answered in the Report
What is the projected value of the US transportation infrastructure construction market by 2031?
The market is forecast to reach USD 298.12 billion by 2031, growing at 4.19% CAGR.
Which segment is growing fastest within the US transportation infrastructure construction market?
Railways are expected to expand at 5.18% CAGR from 2026 to 2031, the highest among all transportation modes.
How dominant is public funding in the US transportation infrastructure construction market?
Public sources accounted for 75.20% of investments in 2025, though private capital is advancing faster at 5.32% CAGR.
Why is Texas critical to nationwide infrastructure growth?
Texas holds 10.85% of 2025 spending and has committed USD 148 billion over ten years, targeting congestion relief and multimodal freight corridors.
What impact do skilled-labor shortages have on project delivery?
Persistent labor gaps are inflating wages and elongating schedules, prompting contractors to adopt automation and prefabrication to maintain productivity.