
Market Overview
| Study Period | 2021 - 2031 |
|---|---|
| Forecast Data Period | 2026 - 2031 |
| Base Year Market Size (2025) | USD 7.90 Billion |
| Market Size (2026) | USD 8.48 Billion |
| Market Size (2031) | USD 12.09 Billion |
| Growth Rate (2026 - 2031) | 7.38 % |
| Market Concentration | Medium |
Major Players *Disclaimer: Major Players sorted in no particular order Image © Mordor Intelligence. Reuse requires attribution under CC BY 4.0. | |
United States Transformer Market Analysis by Mordor Intelligence
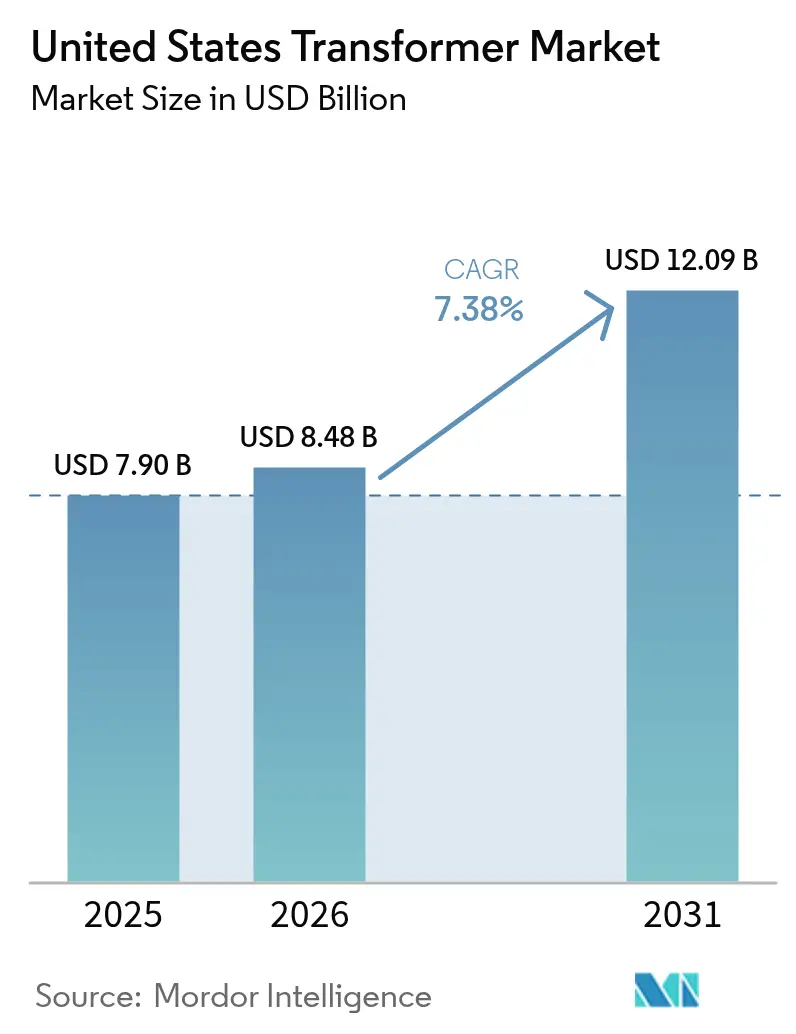
The United States Transformer market size is expected to grow from USD 7.90 billion in 2025 to USD 8.48 billion in 2026 and is forecast to reach USD 12.09 billion by 2031 at 7.38% CAGR over 2026-2031.
Federal grid modernization appropriations, record EV-charging deployments, and an unprecedented wave of data center construction are widening the order pipeline and insulating revenue growth from economic softening.(1)U.S. Department of Energy, “Preventing Outages and Enhancing the Resilience of the Electric Grid Grants,” ENERGY.GOV More than USD 14 billion of Infrastructure Investment and Jobs Act and Inflation Reduction Act funds have been ring-fenced for grid-resilience projects, anchoring multiyear procurement commitments for domestic suppliers. Medium-rating units benefit most from distributed-generation interconnections, which dominate distribution system upgrades, while utility capital expenditures (CAPEX) cycles continue to prioritize high-voltage autotransformers for new interstate corridors and substation refurbishments. Despite raw material shortages and a 60-week average lead time, the pricing environment remains favorable, as domestic quotations trade four to five times higher than in several overseas regions, thereby reinforcing manufacturers' margins.
Key Report Takeaways
- By power rating, large transformers captured 43.37% of the US transformer market share in 2025; medium-rating units are forecast to advance at a 8.88% CAGR through 2031.
- By cooling type, oil-cooled products accounted for a 73.02% share of the US transformer market size in 2025, whereas air-cooled designs are projected to grow at an 8.27% CAGR over the 2026-2031 period.
- By phase, the three-phase segment captured 80.92% of the US transformer market size in 2025 and is projected to grow at a 7.72% CAGR.
- By transformer type, power transformers accounted for a 56.71% share of the US transformer market size in 2025, while distribution transformers are set to grow at an 8.45% CAGR during the same horizon.
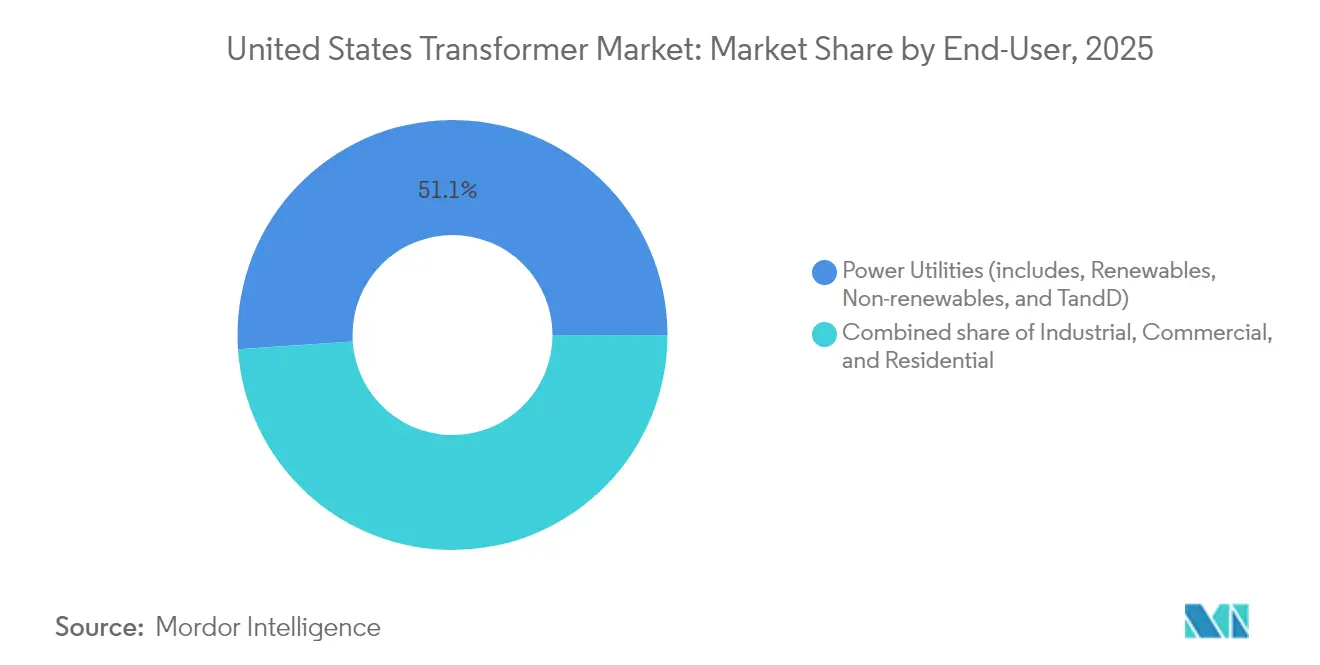
- By end-user, the utility segment held 51.05% of the US transformer market share in 2025; the industrial segment is projected to expand at an 8.11% CAGR to 2031.
Note: Market size and forecast figures in this report are generated using Mordor Intelligence’s proprietary estimation framework, updated with the latest available data and insights as of 2026.
United States Transformer Market Trends and Insights
Drivers Impact Analysis*
| Driver | (~) % Impact on CAGR Forecast | Geographic Relevance | Impact Timeline |
|---|---|---|---|
| U.S. grid-hardening funds under IIJA & IRA | 2.1% | National, with priority to disadvantaged communities and aging infrastructure regions | Medium term (2-4 years) |
| Electrification of commercial fleets (medium-/heavy-duty EV depots) | 1.8% | Urban centers, freight corridors, major metropolitan areas | Short term (≤ 2 years) |
| Utility cap-ex cycle for sub-station digitisation | 1.5% | National, concentrated in aging infrastructure regions, major utility service territories | Long term (≥ 4 years) |
| Data-centre build-out in secondary U.S. metros | 1.3% | Secondary metros including Des Moines, Richmond, West Texas, emerging markets | Short term (≤ 2 years) |
| Edge-case: Crypto-mining load shifting to Midwest | 0.9% | Midwest states with low energy costs, rural areas with available grid capacity | Medium term (2-4 years) |
| Reshoring of medium-voltage component manufacturing | 0.7% | Manufacturing belt states, areas with federal incentives and supply chain advantages | Long term (≥ 4 years) |
| Source: Mordor Intelligence | |||
IIJA & IRA grid-hardening grants
Federal programs have become the single largest source of funding for transformers in the country.(2)U.S. Department of Energy, “Preventing Outages and Enhancing the Resilience of the Electric Grid Grants,” ENERGY.GOV The Department of Energy’s GRIP initiative has allocated USD 7.6 billion across 104 projects, unlocking 55 GW of new transmission capacity and upgrading 1,650 miles of lines. Complementary state and tribal awards totaling USD 1.3 billion finance local substation hardening, undergrounding works, and adaptive protection systems that directly lift unit demand. The Transmission Facilitation Program’s revolving USD 2.5 billion fund de-risks milestone ventures, such as the 525 kV Southern Spirit HVDC line, each of which requires clusters of 350 MVA single-phase transformers with enhanced short-circuit withstand capability. These allocations create a predictable order floor for the US transformer market, encouraging suppliers to expand domestic core-winding and test-bay capacities. Utilities also leverage federal cost-sharing to accelerate the replacement of assets that exceed nameplate loading or fail to meet modern resilience standards.
Commercial-fleet electrification
The pivot to battery-electric medium- and heavy-duty trucks is creating concentrated load pockets that exceed the capability of existing 25 kVA to 50 kVA pole-top units. National Renewable Energy Laboratory modeling indicates that a 30% EV penetration could necessitate upgrades to approximately 2.2 million residential-class transformers. Depot charging for Class 8 trucks relies on 1 MVA isolation units that step down from 11 kV feeders to 1.4 kV AC bus systems, driving demand for pad-mounted units with forced-air cooling and advanced temperature monitoring. Five pilot states in the DOE Multi-State Transportation Electrification Impact Study will invest USD 2.3 billion in distribution upgrades through 2032, replacing roughly 30,000 service transformers. Utilities are therefore bundling transformer replacements with smart-meter rollouts to streamline customer-side connections. Manufacturers capable of shortening lead times for 1 MVA dry-type assemblies gain a competitive edge in urban freight corridors where delivery windows are compressed.
Utility substation digitization
Investor-owned utilities are embedding digital sensor suites into baseline transformer specifications, transforming procurement from commodity purchases into technology partnerships.(3)Berkshire Hathaway Energy, “2024 EEI Investor Presentation,” BERKSHIREHATHAWAY.COM Berkshire Hathaway Energy’s USD 30.8 billion 2024-2026 capital plan sets aside USD 6.9 billion for transmission and USD 7.4 billion for distribution, including 2,299 miles of new 500 kV to 525 kV corridors that require online gas-monitoring and fiber-optic hot-spot detection in autotransformers. Southern California Edison is allocating USD 551.3 million of IT capital to integrate substation automation platforms with transformer health analytics. These investments push suppliers to pre-install IEC 61850 communications gateways, accelerating field commissioning. Utilities seek predictive-maintenance algorithms that flag incipient winding deformation or moisture ingress, thereby lowering the risk of unplanned outages. Digitization also feeds asset-health indices into rate-case submissions, supporting favorable regulatory outcomes.
Secondary-metro data-center build-outs
Power-hungry AI training clusters and cloud expansions are migrating to emerging metropolitan areas where land and capacity remain available. Utilities in West Texas, Richmond, and Des Moines now offer developer-funded substation programs that compress energization timelines in exchange for long-term service contracts. Each 80 MW data-center block typically requires four 40 MVA main step-down transformers and multiple 5 MVA auxiliary units, resulting in localized spikes in the US transformer market. Manufacturers consider regional assembly facilities within 500 miles of these hubs to minimize heavy-haul escorts, which can cost over USD 150,000 per move. The dispersion of hyperscale demand influences utility load-forecast scenarios and underpins orders for high-impedance-ratio autotransformers with enhanced short-circuit withstand capability. Data-center operators also request redundant liquid-immersed and dry-type lineups to balance fire-code requirements with overload performance, thereby broadening the product mix.
Restraints Impact Analysis*
| Restraint | (~) % Impact on CAGR Forecast | Geographic Relevance | Impact Timeline |
|---|---|---|---|
| Long mineral-oil lead times & price volatility | -1.4% | National, affecting all liquid-immersed transformer applications globally | Medium term (2-4 years) |
| PCB legacy liabilities driving insurance premiums | -0.8% | National, concentrated in pre-1979 installations, aging utility infrastructure | Long term (≥ 4 years) |
| Tier-2 steel core shortage (Oriented electrical steel) | -0.6% | National, affecting domestic manufacturing and import-dependent supply chains | Medium term (2-4 years) |
| Increasing utility RFP preference for "Amorphous-core only" | -0.4% | National utility procurement, with regional variations based on efficiency mandates | Short term (≤ 2 years) |
| Source: Mordor Intelligence | |||
Mineral-oil lead-time & price volatility
Average delivery times for liquid-immersed units have stretched from 14 weeks in 2019 to 60–70 weeks in 2025, with outliers above two years for 230 kV ratings and higher. Import tariffs on cores and wound magnetic assemblies limit supply flexibility, while domestic factories can only meet about 20% of national demand, amplifying exposure to international disruptions. Producers report premium surcharges of USD 18 per gallon for inhibited mineral oil compared with 2024 levels, eroding project contingencies. Industry associations are lobbying for USD 1.2 billion in supplemental appropriations to underwrite the construction of new steel-lamination mills and a strategic insulating-oil reserve that could stabilize production economics. Utilities cushion project schedules by over-ordering spare units, but this safety inventory further tightens the spot market. The resulting price gyrations reduce the pace of discretionary replacements and moderate the US transformer market CAGR in the medium term.
PCB-related insurance premiums
Despite a federal ban in 1979, thousands of legacy units containing polychlorinated biphenyls remain in service, primarily in older industrial campuses. Proper disposal mandates certified laboratories, chain-of-custody documentation, and hazardous-waste transport, which can inflate end-of-life costs by up to 30% compared to mineral-oil units. Insurers have raised environmental-impairment premiums and tightened underwriting for sites with PCB contamination histories, lifting lifecycle ownership costs. Asset owners respond by accelerating replacements, indirectly benefiting the US transformer market, yet cost pass-through to ratepayers can draw regulatory scrutiny. As the pool of qualified disposal contractors narrows, scheduling bottlenecks threaten decommissioning timelines. Over the long term, liability-driven spending is expected to taper as the remaining PCB fleet diminishes.
*Our forecasts treat driver/restraint impacts as directional, not additive. The impact forecasts reflect baseline growth, mix effects, and variable interactions.
Segment Analysis
By Power Rating: Medium-Rating Momentum Accelerates Distributed-Grid Needs
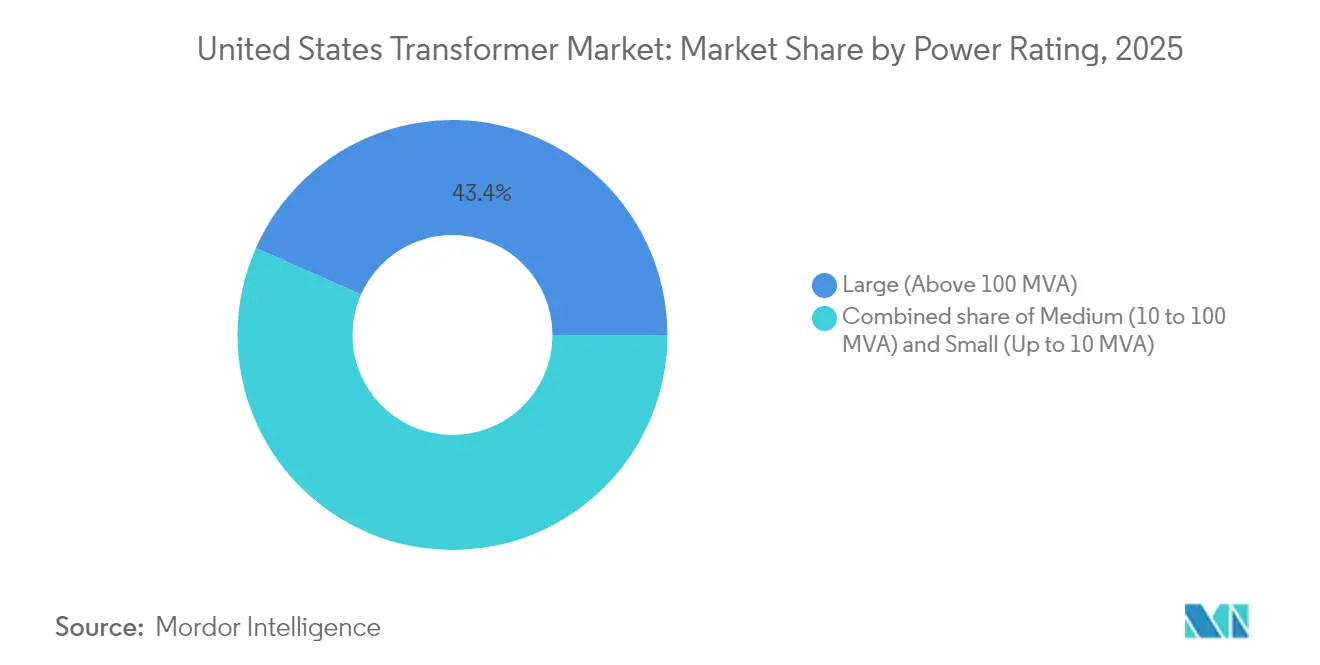
Large units retained a 43.37% share of the US transformer market in 2025, anchored by bulk-power corridors and HVDC terminals. The medium-rating class, spanning roughly 10 MVA to 100 MVA, is registering a 8.88% CAGR and is on track to lift its US transformer market size to about USD 3.68 billion by 2031. Utilities reconfigure secondary substations to manage renewable interconnections, causing medium-rating orders to represent nearly half of new solar-plant step-up filings under FERC Order 1920 regional-planning dockets. Storage-plus-PV hybrids require multiple 60 MVA to 90 MVA step-up units that integrate wide-bandwidth online gas analysis and dissolved-hydrogen alarms for fast-frequency response.
The large-rating segment still benefits from flagship interstate initiatives, such as the 525 kV Southern Spirit and Lake Erie HVDC links, each of which demands single-phase autotransformers above 300 MVA. Lead-time visibility for such extra-high-voltage units exceeds 100 weeks, prompting owners to place orders well before construction begins. Small-rating units below 10 MVA face slower expansion because the DOE 2029 efficiency rules mandate higher-grade cores, which raise unit prices and encourage fleet consolidation rather than one-for-one replacements. OEMs that automate core stacking for medium ratings can pivot production between large and small sizes, thereby smoothing factory utilization.


By Cooling Type: Environmental Pressures Propel Air-Cooled Uptake
Oil-cooled transformers maintained a 73.02% share in 2025 due to proven overload capacity and favorable loss-evaluation economics for high-voltage corridors. Dry-type, air-cooled designs are nevertheless advancing at an 8.27% CAGR as municipalities tighten fire-code provisions in densely populated zones, prompting underground vault specifications to shift away from mineral oil. The US transformer market size for air-cooled units is expected to exceed USD 2.27 billion by 2031, if city ordinances continue to ban combustible fluids near critical infrastructure.
Suppliers have commercialized epoxy-resin encapsulated windings rated up to 72.5 kV, narrowing the performance gap with oil-immersed designs. Rising dielectric-fluid and containment-basin costs erode the relative advantage of oil-cooled units for 138 kV substations, particularly in coastal flood zones. Yet oil-immersed equipment remains indispensable at 230 kV and higher, where thermal-cycling robustness and impulse-voltage margins outweigh environmental premiums. Purchase decisions are increasingly influenced by total-cost-of-ownership models that incorporate fire-safety retrofits and insurance deductibles.
By Phase: Three-Phase Configurations Dominate Modern Networks
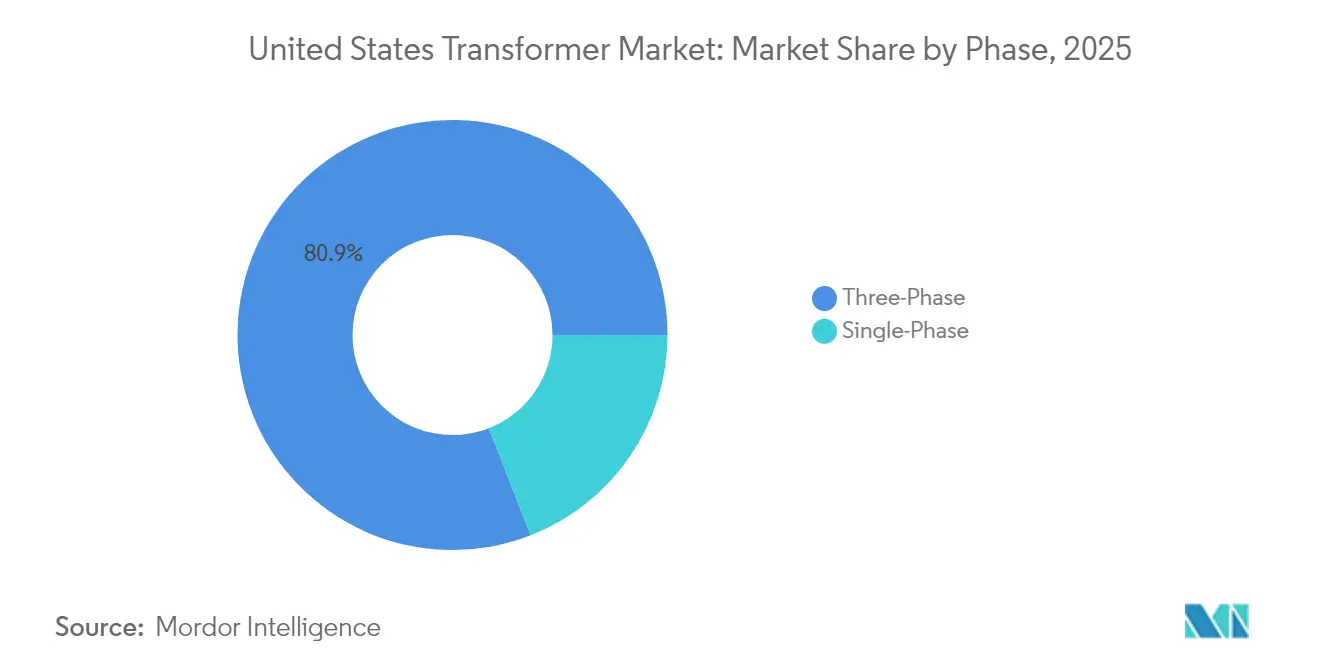
Three-phase designs held an 80.92% share in 2025 and are growing at a 7.72% CAGR as utilities convert legacy single-phase laterals to three-phase feeders that better support rooftop solar backfeed and Level 3 EV charging. NREL projects that distribution-transformer capacity additions will increase by 160% to 260% by 2050 under high-electrification scenarios, with virtually all incremental capacity adopting three-phase construction.
Fleet owners favor three-phase pad-mount units because they deliver higher kVA per pound of core steel, optimizing shipping and installation costs. Single-phase units still dominate rural circuits but face pressure to be replaced as regulators demand tighter voltage regulation and higher power-quality thresholds. Manufacturers that offer modular three-phase cores with interchangeable limbs can simplify spares management for co-ops with mixed fleets. As consolidated rural grids adopt looped configurations to accommodate renewable clusters, three-phase adoption is projected to accelerate beyond 2031.
By Transformer Type: Distribution Units Outpace Power-Transformer Growth
Power transformers accounted for a 56.71% share in 2025, but distribution units are expanding at an 8.45% CAGR, boosted by federal resilience grants that predominantly target local feeders. The US transformer market share for distribution units is expected to surpass 50% by 2031 as utilities bulk-purchase 25 kVA to 2,500 kVA pole-top and pad-mount designs. The finalized DOE 2029 rules still allow grain-oriented electrical steel for roughly 75% of distribution units, averting an immediate supply crunch while tightening no-load loss thresholds.
Power-transformer growth is capped by labor-intensive core-winding bays and limited high-voltage test pits, constraining annual domestic capacity. Utilities are therefore splitting bulk orders among qualified suppliers to hedge construction schedules. Manufacturers that integrate automated tank-fabrication lines shorten throughput for 69 kV to 161 kV designs, freeing up specialized bays for units with voltages of 345 kV or higher. Distribution-class producers that add amorphous-metal slitting capability position themselves for future DOE mandates.
By End-User: Industrial Load Centers Emerge as Fastest-Growing Segment
Utilities remained the largest buyers, with a 51.05% share in 2025. However, industrial customers are advancing at an 8.11% CAGR, driven by data-center operators and semiconductor fabs that lock in 34.5 kV to 69 kV step-down units under multi-year framework agreements. Federal reshoring incentives spurred announcements for more than 244,000 manufacturing jobs in 2024, each new fab or battery-cell plant requiring inside-the-fence substations populated with medium-power transformers.
Industrial buyers frequently prioritize accelerated delivery over lowest price, a dynamic that favors suppliers with domestic winding and short-cycle test capacity. Utilities, by contrast, synchronize orders with rate-case approval cycles, creating more predictable but slower volumes. Commercial developers cite transformer availability as a critical path for data-hall energization, solidifying the industrial segment’s growth trajectory within the US transformer market.
Geography Analysis
The geographic spread of federal funding, shifts in the regional generation mix, and industrial site-selection strategies create contrasting transformer volumes across the United States. The Mid-Atlantic’s aging 138 kV backbone and dense Northern Virginia data-center cluster keep annual procurement elevated, even as developers migrate new server farms toward Ohio, Iowa, and Texas. Western utilities currently post the fastest spending pace; Berkshire Hathaway Energy’s USD 26 billion western-corridor plan and Nevada’s USD 4.2 billion Greenlink projects, together, require more than 200 single-phase 525 kV autotransformers, plus hundreds of intermediate-voltage units.
California’s CHARGE 2T initiative secures USD 630 million in federal grants to reconductor 100 miles of transmission lines with high-temperature low-sag conductors, obligating matching investments in high-impedance-ratio transformers and dynamic-rating sensors. In the Midwest, Toledo-based utilities issued joint RFPs for 345/138 kV autotransformers to support battery-cell plants. Meanwhile, West Texas hybrid developers are funding green-field 138 kV switching stations to ensure capacity for 500 MW data center campuses.
The geographic dispersion of demand encourages OEMs to install satellite depots and modular assembly lines within 500 miles of load centers, thereby minimizing overweight permit fees and bridge-crossing escorts that can exceed USD 150,000 per move. Regional staging also supports emergency spares programs under DOE resilience metrics. Utilities in hurricane-exposed Gulf states stockpile mobile transformers on elevated pads, whereas utilities in wildfire-prone Western states prefer dry-type vault units to reduce oil spill risk. The resulting regional customization expands total order diversity and deepens the US transformer market’s addressable revenue pool.
Regulatory Landscape
In the United States, transformer manufacturing, procurement, and operation are shaped by federal energy-efficiency requirements, bulk-power reliability compliance, and trade measures that affect core materials and components. The U.S. Department of Energy (DOE) finalized amended energy conservation standards for distribution transformers in April 2024, with a mandatory compliance date of April 23, 2029, pushing buyers and OEMs to qualify higher-efficiency designs and core materials ahead of the enforcement date. At the same time, mandatory bulk electric system reliability standards under Section 215 of the Federal Power Act are developed by the Electric Reliability Organization (NERC) and enforced through Federal Energy Regulatory Commission (FERC) oversight, which flows into utility specifications for protection, monitoring, and resilience.
In 2026, policy attention has focused on how efficiency mandates intersect with domestic supply-chain resilience. DOE issued a Request for Information in June 2026 (Docket EERE-2026-BT-STD-0133) to evaluate the impacts of the April 2024 distribution transformer standards on national security, domestic manufacturing capacity, and supply chains, while the April 2029 compliance date remains the governing benchmark. On the trade side, a new Section 232 tariff structure introduced a 15% transitional tariff tier for certain electrical grid equipment effective April 6, 2026 through December 31, 2027, and U.S. Customs and Border Protection guidance issued in July 2026 added copper smelt and cast country reporting requirements that can affect documentation and sourcing choices across transformer supply chains.
Competitive Landscape
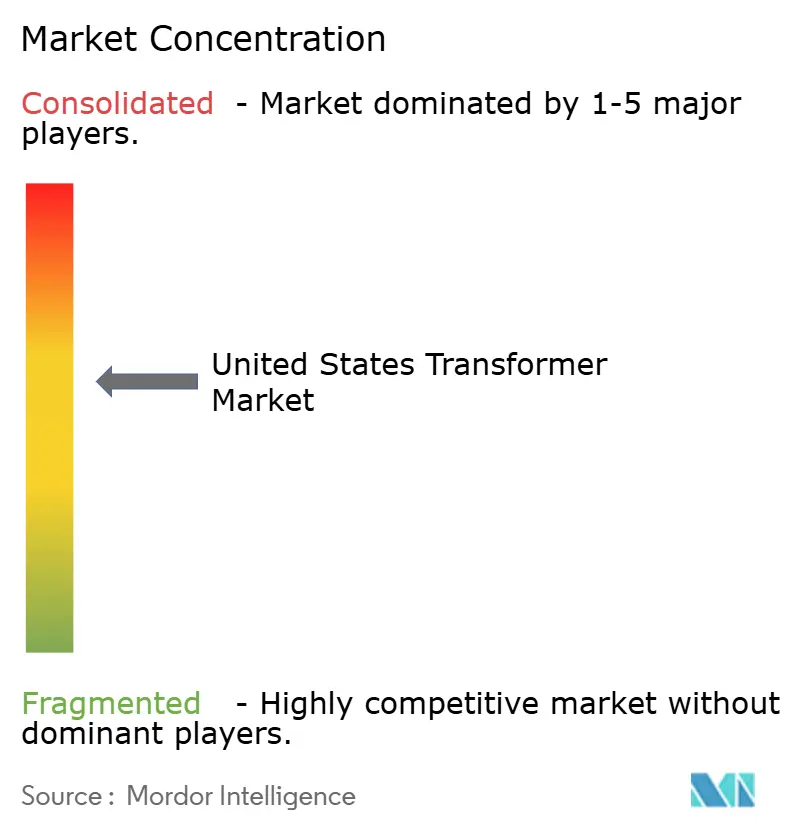
The US transformer market remains moderately concentrated, with the top five suppliers controlling nearly 50% of shipments; however, active capacity expansions prevent any single firm from achieving a dominant position. Hitachi Energy earmarked USD 250 million through 2027 for factory expansions in Virginia, Missouri, and Mississippi, adding more than 100 component-manufacturing roles.(5)Hitachi, Ltd., “Hitachi Energy invests additional $250M USD to address transformer shortage,” HITACHI.COM Hyosung Heavy Industries plans to double annual Memphis output to above 250 units by 2027, targeting a 10% domestic share.
Strategic mergers accelerate economies of scale. Prolec GE’s purchase of SPX Transformer Solutions unifies power and medium-distribution lines under one North American enterprise, while Central Moloney’s acquisition of Cam Tran boosts pad-mount capacity across eight plants. nVent’s USD 975 million agreement to acquire Avail Infrastructure’s electrical products business integrates custom switchgear into transformer skids for data center clients. Domestic resin-casting specialists are pursuing partnerships with global core-steel mills to secure allocations of amorphous metal ahead of potential DOE tightening.
Differentiation is increasingly centered on digitalization and core material expertise. Suppliers with amorphous-metal slitting lines win efficiency-driven bids from utilities anticipating future regulatory limits. Embedded dissolved-gas sensors, fiber-optic strain gauges, and onboard SCADA gateways are now standard options on many 69 kV and above units, enabling condition-based maintenance that utilities incorporate into total-cost-of-ownership models. New entrants confront high capital barriers for impulse test laboratories and seismic-certification rigs, reinforcing incumbent advantages.
United States Transformer Industry Leaders
Schneider Electric SE
Hitachi Energy
Siemens Energy
Prolec GE
Eaton Corporation
- *Disclaimer: Major Players sorted in no particular order

Market Opportunities and Future Outlook
Near-term opportunities concentrate where lead times, logistics constraints, and standards-driven specifications overlap, particularly for large power transformers (LPTs) and three-phase units used in transmission substations, industrial load centers, and data center interconnections. Large power transformer lead times stretched to multi-year windows in 2024-2025, and both government and industry groups (including DOE and CISA/NIAC) have highlighted LPT availability and key inputs such as grain-oriented electrical steel (GOES) as binding bottlenecks. This has encouraged OEMs and domestic producers to invest in core-winding, component, and test capacity in the United States, narrowing the gap between demand spikes from grid-hardening programs, electrification, and hyperscale load additions and deliverable supply.
Manufacturing localization and capacity expansion is the clearest opportunity channel, with projects designed around sites that can handle oversized equipment movement and testing. In June 2026, Hitachi Energy broke ground on a USD 457 million expansion of its South Boston, Virginia campus, which is positioned as the largest U.S. LPT production facility and is intended to support utility and industrial demand constrained by long lead times. Virginia Transformer also advanced incremental and greenfield capacity moves in the Southeast in 2026, including a 50% capacity expansion groundbreaking at its Rincon, Georgia facility and a plan for a 600,000-square-foot Muscle Shoals, Alabama plant spanning roughly 2 MVA to 500 MVA ratings. These steps align with procurement shifts highlighted in the market context, including higher utility requirements for digitally enabled transformers (sensor suites and communications gateways) and industrial demand for medium-power step-down units, creating space for suppliers that can compress delivery cycles, meet verified efficiency needs ahead of the 2029 DOE deadline, and rely more on domestically sourced inputs where available.
Recent Industry Developments
- June 2026: Hitachi Energy broke ground on a USD 457 million expansion of its South Boston, Virginia manufacturing campus to scale large power transformer production. The project adds more than 300,000 square feet and targets a step-change in domestic LPT capacity, addressing extended delivery windows for EHV and transmission-class units. The expansion strengthens supply assurance for utilities and large industrial customers that have been scheduling transformer orders far in advance due to constrained test bays and component availability.
- September 2025: Hitachi Energy announced a broader USD 1 billion U.S. manufacturing investment plan to increase production of critical grid infrastructure, including scaling large power transformer output. By pairing LPT assembly expansion with upstream component capability, the program supports shorter and more controllable supply chains in a market facing material bottlenecks such as GOES. The announcement also increases competitive pressure on other OEMs to expand U.S. capacity rather than depend on imports exposed to trade and logistics volatility.
- June 2024: A national advisory focus on the critical shortage of power transformers was reinforced through a CISA/NIAC report on ensuring U.S. grid reliability amid constrained availability of large power transformers. The report emphasized supply-chain limitations and the operational risk of long replacement times, which has accelerated utility and government attention to spares strategies and domestic manufacturing resilience. This backdrop has supported procurement urgency and helped justify the subsequent wave of factory expansions and component investments by major suppliers.


Research Methodology Framework and Report Scope
Market Definition and Coverage
For this report, the market covers revenues from new transformers sold in the United States that are used to step up or step down voltage in AC power networks, across utility, industrial, commercial, and residential demand. Values are captured in current USD for equipment supplied into the country.
Scope exclusions: We exclude standalone electrical switchgear, cables and conductors, protection and control devices, and routine field maintenance that is billed separately from the transformer sale.
Segmentation Overview
- By Power Rating
- Large (Above 100 MVA)
- Medium (10 to 100 MVA)
- Small (Up to 10 MVA)
- By Cooling Type
- Air-cooled
- Oil-cooled
- By Phase
- Single-Phase
- Three-Phase
- By Transformer Type
- Power
- Distribution
- By End-User
- Power Utilities (includes, Renewables, Non-renewables, and T&D)
- Industrial
- Commercial
- Residential
Data Sources, Market Sizing, and Validation
Desk Research
Desk research started with the basic demand story for US grid and electrical equipment spending, because transformers move with additions and replacements in the network. We relied on public sources such as the US Energy Information Administration for electricity and capacity indicators, the US Census Bureau for manufacturer shipments context, and US International Trade Commission trade statistics for import and export direction checks.
To make the model realistic, we also reviewed sources such as DOE and national lab publications on grid modernization, IEEE and other peer reviewed engineering articles for technology shifts (for example, losses and efficiency themes), and utility planning documents that describe substation and distribution upgrade cycles. On top of that, company annual reports, investor presentations, and reputable industry news were used to validate pricing movement, lead time discussion, and where demand is rising. Paid subscriptions were used selectively for company financials and intelligence, plus patent databases and shipment-level trade views to fill gaps where public data is not granular. These sources are illustrative only, and many additional publications and documents were referred to for data collection, validation, and clarification.
Primary Interviews and Surveys
Primary work focused on interviews and short surveys with transformer manufacturers, component and material participants, EPC and engineering teams, and utility and industrial buyers who set specifications and order timing. We used these conversations to confirm typical project cycles, current pricing logic, and how demand differs between distribution replacements and higher rating power transformer orders, and then to tighten assumptions where desk sources were silent.
Distribution of primary research fieldwork respondents
| Company type | Respondent position |
|---|---|
| Top tier: 29% | CXOs: 16% |
| Mid tier: 54% | Functional/Unit leaders: 37% |
| Smaller Players: 17% | Managers: 47% |
Market-Sizing & Forecasting
Sizing was built using a top-down and bottom-up approach, where US electricity network build and replacement signals were first translated into a transformer demand pool and then reconciled with supplier-side revenue reality checks. For the top-down side, we linked grid capex direction, substation additions, distribution replacement intensity, and large load connections to expected transformer volumes, and then applied price ladders by rating and technology (oil-filled vs dry-type being the simple cut we used in early steps).
To keep the math practical, we leaned on a handful of market fingerprints that interviewees could validate quickly, such as typical replacement timing for aging distribution units, utility procurement lead times, the share of demand tied to new interconnections, and observed changes in average selling prices due to core materials, copper, and testing requirements. Where volume data was not directly observable, we treated the missing portion through scenario ranges and then narrowed it based on consistent signals from multiple respondent groups.
For forecasting, scenario analysis was used around a central case, since order timing can swing with project approvals and manufacturing backlogs. The main drivers used in the forward view included expected T&D spending direction, generation and load growth signals (including data center and industrial additions where they change substation needs), replacement backlog pressure, and input cost direction that influences pricing over the next few years.
Data Validation & Update Cycle
Outputs were checked against independent signals so we did not rely on a single data stream, which included trade direction, utility plan cadence, and supplier commentary on order books and lead times. When results looked off, we revisited key assumptions such as price progression, mix between distribution and power transformers, and timing of large project deliveries, and then re-contact was triggered for the specific gap.
Before sign-off, the model and its calculations go through step-by-step analyst review, followed by a final pass that looks for year-over-year jumps that are not supported by the demand indicators. Reports are refreshed annually, and interim updates are done when material events occur, such as major policy shifts, sharp input cost changes, or sudden changes in grid spending. Right before delivery, we run a last update check so clients receive the latest view available at that time.
Mordor Intelligence's United States Transformer Market Size Compared With Other Published Estimates
Different published market numbers for US transformers can look far apart even when they are trying to describe the same space, because they may not be counting the same product scope or the same revenue moment. The year used, the currency timing, and whether the figure includes adjacent electrical equipment can all move the final value.
The benchmark table shows a lower 2025 value than some broader 2024 figures, and in Mordor Intelligence's model the total reflects transformer equipment revenues across distribution and power categories, rather than including switchgear, cabling, or separately billed repair work in the same number.
Benchmark comparison
| Source | Market Size | Gaps in Research Methodology |
|---|---|---|
| Mordor Intelligence | USD 7.90 B (2025) | |
| Trade Journal A | USD 12.20 B (2024) | Uses an earlier base year and describes modernization activity in a way that can pull in adjacent electrical infrastructure revenues beyond transformer equipment sales. |
| Industry Article B | USD 12.20 B (2024) | Presents a total market outlook with limited transparency on what is counted as product revenue, which can lead to mixed inclusion of equipment, installation, and upgrade-related values. |
Looking across the three values, the spread is mainly explained by scope and year alignment rather than a disagreement on demand direction. By keeping calculations tied to observable demand signals and repeatable pricing steps, we can explain each adjustment clearly and update assumptions when procurement timing or input costs shift.


Key Questions Answered in the Report
How large is the US transformer market in 2026?
The US transformer market size stands at about USD 8.48 billion in 2026 and is tracking a 7.38% CAGR toward 2031.
Which transformer segment is expanding fastest?
Medium-rating units in the 10-100 MVA band are registering a 8.88% CAGR due to distributed-generation and secondary-substation upgrades.
What is the biggest supply-chain challenge now?
A shortage of grain-oriented electrical steel and extended mineral-oil lead times have pushed average delivery windows past 60 weeks.
How are EVs influencing transformer demand?
Fleet electrification requires 1 MVA depot transformers and could trigger upgrades to roughly 2.2 million residential units under 30% adoption scenarios.
Which regions show the highest ordering momentum?
Western utilities, notably Nevada and West Texas, lead growth thanks to large renewable-integration and data-center projects.
Who are the leading domestic producers?
Hitachi Energy, Siemens Energy, General Electric, Hyosung Heavy Industries, and Prolec GE are the primary manufacturers expanding U.S. capacity.
Page last updated on:


 Your data is secure and never sold or shared.


