
Market Overview
| Study Period | 2020 - 2031 |
|---|---|
| Forecast Data Period | 2026 - 2031 |
| Base Year Market Size (2025) | USD 7.34 Billion |
| Market Size (2026) | USD 7.63 Billion |
| Market Size (2031) | USD 9.01 Billion |
| Growth Rate (2026 - 2031) | 3.38 % |
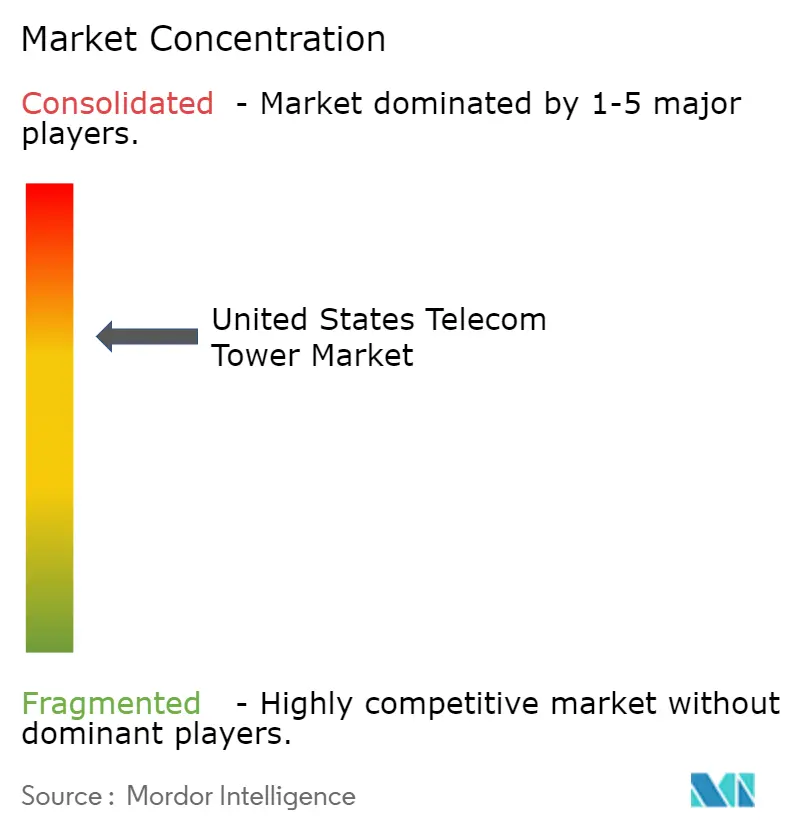
| Market Concentration | Medium |
Major Players *Disclaimer: Major Players sorted in no particular order Image © Mordor Intelligence. Reuse requires attribution under CC BY 4.0. | |
United States Telecom Tower Market Analysis by Mordor Intelligence
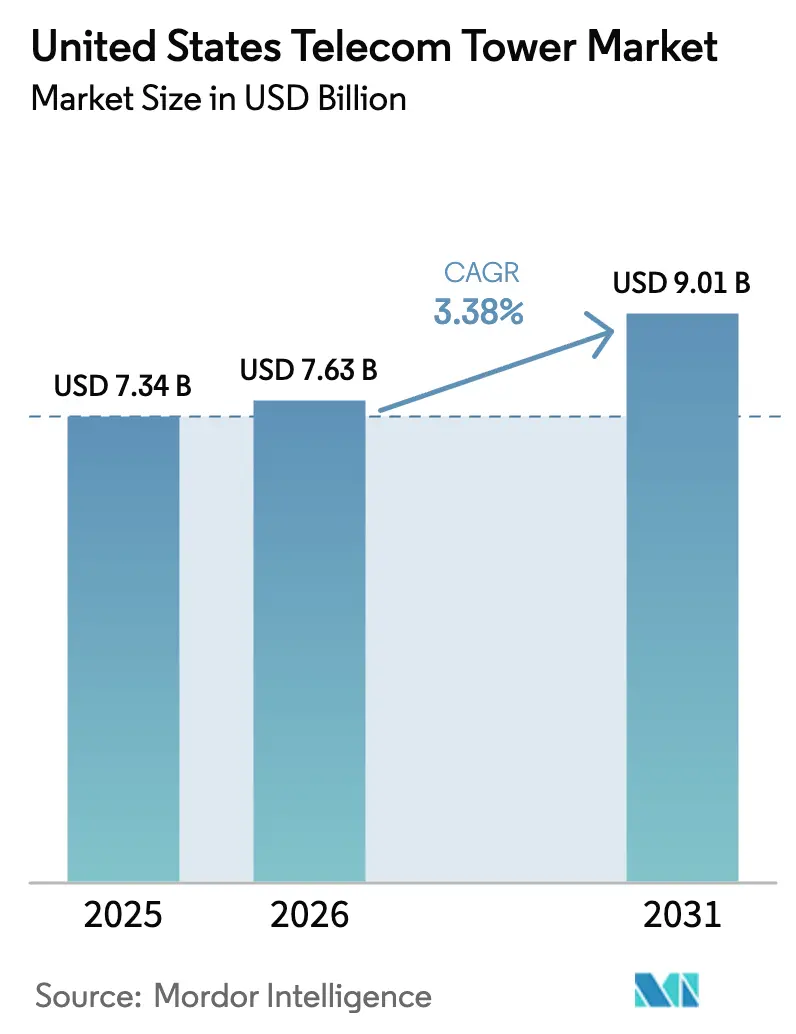
The United States telecom tower market size is expected to increase from USD 7.34 billion in 2025 to USD 7.63 billion in 2026 and reach USD 9.01 billion by 2031, growing at a CAGR of 3.38% over 2026-2031. Federal broadband grants, 5G mid-band spectrum rollouts, and the accelerating shift toward tower colocation are the primary forces underpinning this steady trajectory. Operators are re-directing capital toward lease-model densification, which keeps greenfield construction subdued while lifting tenancy ratios on existing sites. Policy reforms from the National Telecommunications and Information Administration and the Federal Communications Commission have shortened permitting timelines, unlocked rural funding for fixed-wireless access, and eased local siting fee burdens, all of which stimulate incremental demand for tower leases in underserved regions. At the same time, renewable-energy mandates embedded in new master lease agreements are tilting capex toward solar-plus-battery retrofits that improve uptime resilience and create ancillary revenue streams for owners.
Key Report Takeaways
- By fuel type, non-renewable systems held 62.56% of the United States telecom tower market share in 2025, while renewable-powered towers are projected to expand at a 3.96% CAGR through 2031.
- By tower design, monopole structures dominated with 59.62% share in 2025, whereas stealth towers are expected to post the fastest growth at a 4.37% CAGR during 2026-2031.
- By installation, stealth towers are forecast to expand at a 4.37% CAGR through 2031, the fastest growth among all structure types. Rooftop sites accounted for 25.87% of the United States telecom tower market size in 2025 and are advancing at a 4.18% CAGR to 2031.
- By ownership, private-owned assets dominated with 74.92% share in 2025, while this ownership segment is projected to grow at 3.49% annually through 2031.
Note: Market size and forecast figures in this report are generated using Mordor Intelligence’s proprietary estimation framework, updated with the latest available data and insights as of 2026.
United States Telecom Tower Market Trends and Insights
Drivers Impact Analysis*
| Driver | (~) % Impact on CAGR Forecast | Geographic Relevance | Impact Timeline |
|---|---|---|---|
| Surging 5G Mid-Band and C-Band Densification Wave | +0.9% | Top 50 Metropolitan Statistical Areas | Short Term (≤ 2 Years) |
| Rapid Growth in Fixed-Wireless Access Subscriber Targets | +0.7% | Rural and Exurban BEAD-Eligible Blocks | Medium Term (2-4 Years) |
| Infrastructure Investment and Jobs Act Rural Broadband Grants | +0.6% | BEAD-Funded States and Tribal Lands | Medium Term (2-4 Years) |
| Accelerated Tower Colocation to Offset Carrier Capex Constraints | +0.5% | National, Especially Sites Covered by Master Lease Agreements | Short Term (≤ 2 Years) |
| Extension of IRS Bonus Depreciation for Tower Upgrades | +0.3% | National | Long Term (≥ 4 Years) |
| FCC Pre-Emption of Excessive Local Siting Fees | +0.4% | High-Growth Metropolitan Statistical Areas | Medium Term (2-4 Years) |
| Source: Mordor Intelligence | |||
Surging 5G Mid-Band and C-Band Densification Wave
Verizon’s completion of 90% C-band coverage by late 2025 still leaves localized capacity gaps, leading the carrier to lease incremental space on thousands of macro sites.[1] T-Mobile’s deeper 2.5 GHz inventory requires fewer towers, creating an asymmetric competitive environment that is pressuring AT&T and Verizon to add tenants on existing structures rather than fund new builds. Carriers that secured 3.45-3.55 GHz licenses in Auction 110 must meet staged build-out milestones through 2027, embedding a second densification wave into tower‐company revenue pipelines. Master lease amendments now include escalator clauses that step up rents as licensees light up additional radios, allowing owners to pull forward value. The densification push is most intense in the top urban corridors, where population density drives the economic case for a fourth or fifth tenant per structure.
Rapid Growth in Fixed-Wireless Access Subscriber Targets
Verizon reported 5.7 million fixed-wireless access lines at 2025 year-end, and management aims for 9 million by 2027, which implies thousands of incremental rooftop and monopole leases in exurban counties. NTIA’s June 2025 decision to treat fixed-wireless solutions on par with fiber unlocked USD 42.45 billion in BEAD grants, accelerating carrier bids in high-cost rural territories.[2] Tower companies have responded by optioning land parcels in eligible blocks months before state broadband offices finalize project awards, effectively pre-positioning assets for carrier tenancy. In Montana and Wyoming, where fiber passes can exceed USD 50,000 each, wireless proposals now win a majority of state scoring matrices, guaranteeing a medium-term leasing surge once grants convert to construction starts. The dynamic couples public capital with private tower real estate to close the rural digital divide.
Infrastructure Investment and Jobs Act Rural Broadband Grants
States such as Louisiana, West Virginia, and Mississippi collectively control more than USD 5 billion in BEAD allocations and rank tower-based fixed-wireless bids ahead of slower fiber alternatives. Joint submissions between tower operators, electric cooperatives, and regional internet service providers promise turnkey builds that meet the act’s speed and latency thresholds while shortening deployment cycles. Even so, tower build schedules intersect with the Middle Mile Grant Program, whose 12-month environmental review backlog slows backhaul projects that feed rural cell sitesV. The FCC’s September 2025 shot-clock rules impose 60-day reviews for colocation and 90-day windows for new towers, trimming a major bureaucratic delay.[3] As states reach construction milestones from 2026 onward, the United States telecom tower market stands to harvest long-tail lease revenue from a once-in-a-generation infusion of federal subsidies.
Accelerated Tower Colocation to Offset Carrier Capex Constraints
Verizon trimmed its 2026 network capex to a USD 16 billion-USD 16.5 billion range, openly citing colocation as a way to curb spending without sacrificing coverage. AT&T’s master lease with Crown Castle covers 40,000 towers and lets the carrier add radios for monthly fees that sit 30%-40% below the economics of a new build.[4] Industry-wide wireless capex slid to USD 32.4 billion in 2024, the lowest in six years, but tenancy ratios on portfolio towers climbed from 2.4 to 2.6 over the same span. For tower companies, colocation amendments generate 70%-80% gross margins and require marginal capital deployment, supporting above-inflation same-site revenue growth. The model hinges on the predictability of lease escalators, which tower real estate investment trusts now price at 3%-4% annually to hedge against higher interest expenses.
Restraints Impact Analysis*
| Restraint | (~) % Impact on CAGR Forecast | Geographic Relevance | Impact Timeline |
|---|---|---|---|
| Municipal Height Caps Below 150 Feet | -0.4% | San Francisco, Boulder, Portland, Affluent Suburban Districts | Long Term (≥ 4 Years) |
| Elevated Cost of Capital With Fed Funds > 4.75% | -0.6% | National, Affects Leveraged Portfolio Acquisitions | Short Term (≤ 2 Years) |
| Section 232 Steel Tariffs on Tower Materials | -0.3% | National, Acute for Lattice and Guyed Structures | Medium Term (2-4 Years) |
| Cable-MVNO CBRS Off-Load Strategies | -0.2% | Dense Urban Cores, High-Rise Residential Corridors | Medium Term (2-4 Years) |
| Source: Mordor Intelligence | |||
Municipal Height Caps Below 150 Feet
Planning codes in cities such as San Francisco cap new towers at 40-65 feet, far below the 120-180 feet optimum for mid-band propagation, forcing carriers to rely on rooftop leases or small-cell nodes. Boulder enforces a 35-foot limit in historic districts, which raises rent premiums on stealth or rooftop alternatives by up to 70% compared with standard ground sites. Because the FCC’s 2025 order preserved local authority on height and setback rules, this constraint persists indefinitely. Tower firms now deploy flagpole, church-steeple, and artificial-tree concealments, each adding USD 75,000-USD 150,000 to site costs, in exchange for zoning approval. The trade-off is unfavorable network geometry, since a 40-foot stealth site covers less than a half-mile radius, demanding many more locations to achieve the same footprint as a single monopole.
Elevated Cost of Capital with Fed Funds Greater Than 4.75 Percent
The Federal Reserve held its policy band near 4.75%-5.00% through 2025, pushing American Tower’s weighted average debt cost to 3.8%, up 90 basis points versus 2022. Crown Castle’s leverage reached 5.2× EBITDA, nearing covenant ceilings that impede additional borrowing for acquisitions. A 100-basis-point uptick in rates strips 8%-12% of portfolio net present value, which has moved seller-buyer bid-ask spreads out of equilibrium and stalled several scale transactions in 2025. Private operators such as Vertical Bridge and Phoenix Tower International pay another 150-200 basis points above investment-grade peers, magnifying sensitivity to Treasury yields. Forward curves now imply only a modest 75-100 basis-point easing through 2027, insufficient to fully restore 2021-level deal flow. Consequently, some carriers postpone sale-leaseback processes, constraining the supply of new inventory for investors in the near term.
*Our forecasts treat driver/restraint impacts as directional, not additive. The impact forecasts reflect baseline growth, mix effects, and variable interactions.
Segment Analysis
By Fuel Type: Renewable Adoption Outpaces Grid-Connected Generators
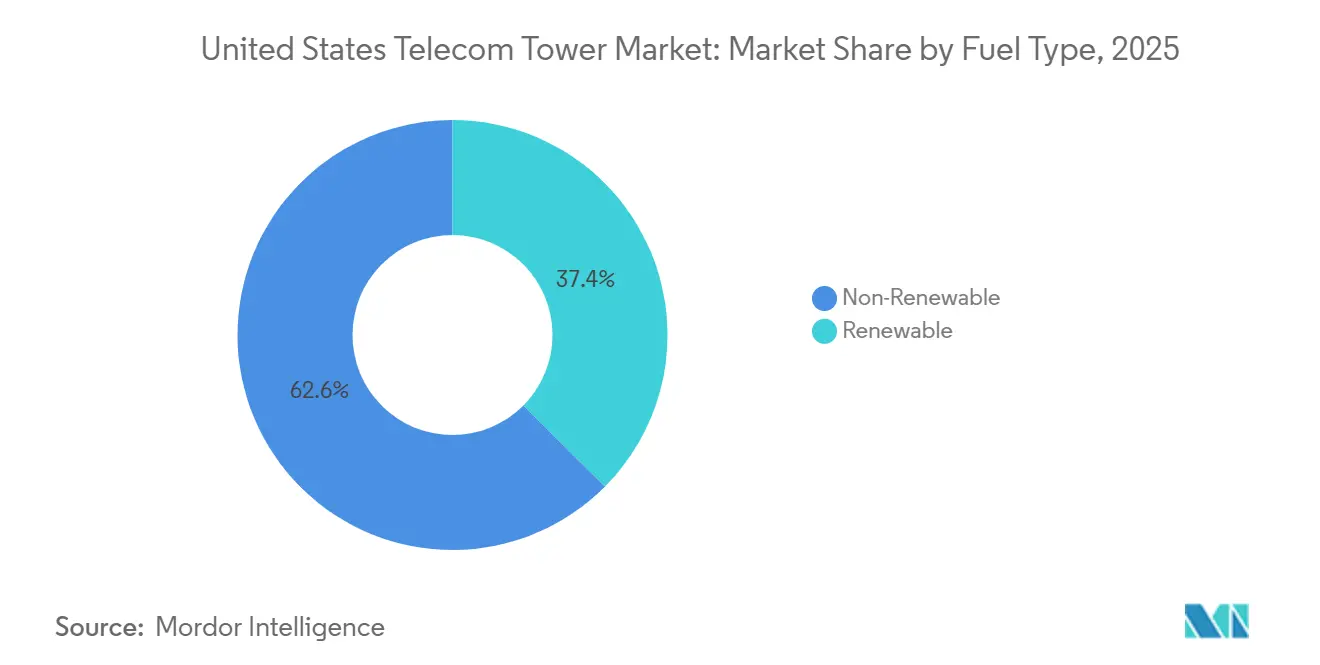
Renewable-powered sites captured roughly 37.44% of the United States telecom tower market size in 2025 and are projected to grow at a 3.96% CAGR through 2031. American Tower has pledged to lift renewable penetration across its domestic footprint from 22% in 2024 to 60% by 2030, a plan that relies on thousands of solar-plus-battery retrofits. Crown Castle is converting 500 sites per year, chasing a similar emissions pathway and benefiting from falling lithium-ion battery costs, now under USD 150 per kilowatt-hour. Two barriers temper momentum. First, interconnection queues in California and Texas extend up to 24 months, delaying net-metered tie-ins that underpin project economics. Second, wildfire zones require additional permits for battery energy storage, adding another three to six months to build schedules. Despite these frictions, carriers are willing to pay 10%-15% rent premia on low-carbon towers to satisfy corporate sustainability scorecards, improving return profiles for portfolio owners. If Congress extends the 30% solar investment tax credit beyond 2032, the renewable share could accelerate past today’s forecast band, lifting the overall United States telecom tower market growth above baseline projections.
Non-renewable systems, still dominant with 62.56% of 2025 deployments, will expand at a slower 3.38% rate. Diesel redundancy remains critical in cyclone-prone Gulf markets, and natural-gas micro-turbines offer cost advantages where utility power is cheap. Yet looming carbon disclosure rules issued by the Securities and Exchange Commission intensify pressure on carriers to migrate toward green energy sources. Over the forecast horizon, cost parity between diesel gensets and solar-battery hybrids is likely once fuel logistics premiums are considered, setting the stage for renewable solutions to gain incremental share each year. Thus, energy strategy stands as a competitive differentiator for tower owners courting sustainability-oriented tenants.
By Type of Tower: Stealth Formats Surge in Zoning-Constrained ZIP Codes
Monopole structures accounted for 59.62% of the United States telecom tower market share in 2025, thanks to 20-30 foot ground footprints that simplify land acquisition. Lattice towers remain the workhorse in rural areas where wind and ice loads challenge single-pole integrity, but their share sits near 25% and is flat to declining. Guyed designs, cheaper to erect yet land-intensive, concentrate in the Midwest and Plains states, representing roughly 10% of aggregate inventory. The growth standout is the stealth category, with a projected 4.37% CAGR to 2031. A single flagpole concealment costs USD 200,000-USD 300,000, roughly 60% above a standard monopole, yet municipalities approve these structures within six to nine months versus up to 18 months for non-concealed alternatives.
Dish Wireless illustrates the structural shift. Of its 18,000 Open RAN sites under construction as of late 2025, 60% leverage stealth or rooftop formats that rely on lighter radios and virtualized baseband units. Municipalities in California, Florida, and New York have codified aesthetic impact assessments that effectively mandate disguise solutions above 50 feet, accelerating take-up of modular kits featuring faux branches, shrouds, and bark panels. Because each stealth site covers a reduced radius, tower counts per square mile climb, inflating lease velocity for owner-operators. In affluent suburbs where property values drive fierce community opposition, carriers increasingly budget for higher concealment costs to secure regulatory certainty, cementing the segment’s above-average growth pattern within the broader United States telecom tower market.
By Installation: Rooftop Sites Unlock Urban Density Economics
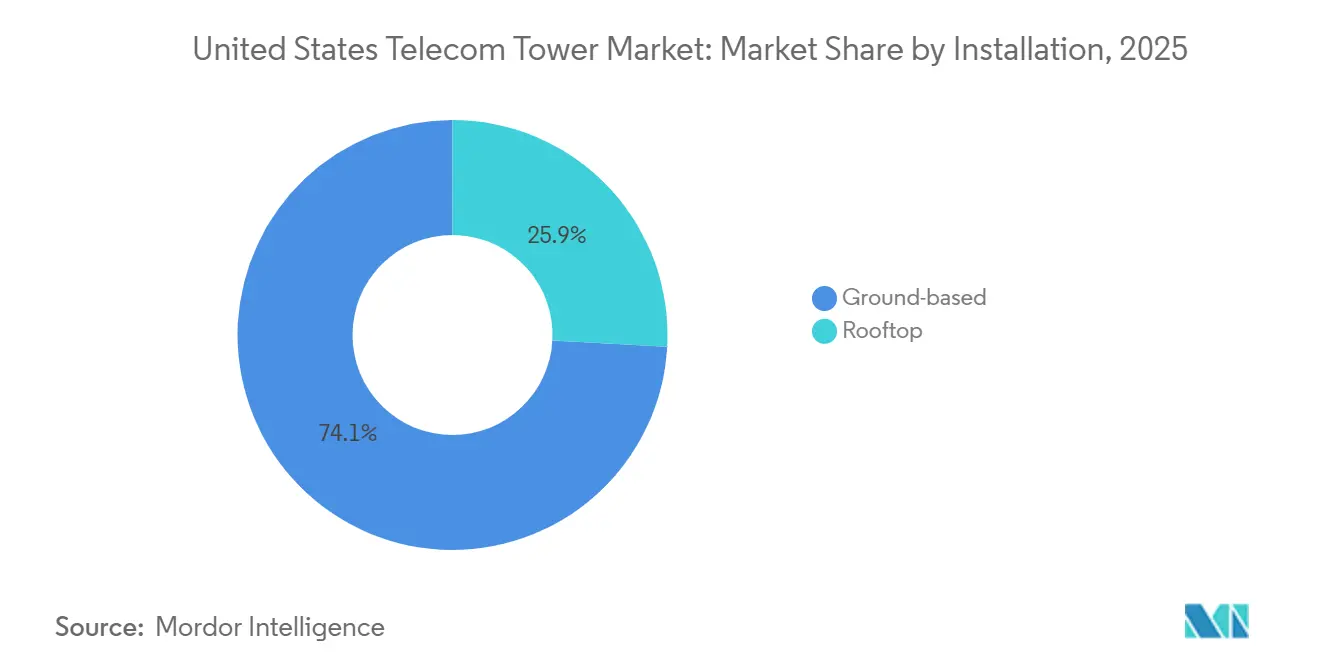
Ground-based facilities still dominate at 74.13% of 2025 installations, but rooftop nodes show the strongest velocity, rising at 4.18% annually through 2031. A rooftop lease in downtown Los Angeles runs USD 20,000-USD 40,000 per year, undercutting ground-site rents by up to 60% and avoiding USD 100,000-USD 200,000 in foundation expenses. Structural retrofits pose a bottleneck. Buildings erected before 2000 often cannot handle 5,000-10,000 pound multi-carrier loads, demanding steel-frame reinforcements that elongate project schedules by three to four months.ORG. Engineers mitigate weight by specifying composite mounts and modular shelters that spread loads across multiple penetration points, reducing single-point stress by up to 40%.
Rooftop economics flourish where inter-site spacing falls below half a mile, such as in Manhattan’s Midtown corridors or Chicago’s Loop, settings where ground property is scarce or zoned residential. AT&T disclosed that rooftops comprised 18% of its 2024 additions, a six-point jump in two years. Municipal reforms introduced in the FCC’s 2025 shot-clock order aim to streamline rooftop colocation, promising quicker permit cycles and incentivizing owners to pre-wire buildings with fiber and power risers. As urban land scarcity collides with 5G capacity imperatives, rooftops will keep capturing share, particularly once integrated edge-computing cabinets transform towers into micro-data-center hubs for latency-critical applications.
By Ownership: Private Portfolios Consolidate as Carriers Monetize Legacy Assets
Private entities controlled 74.92% of the United States telecom tower market size in 2025 and are forecast to expand at 3.49% to 2031. The headline driver is Verizon’s USD 2.8 billion sale of 6,339 towers to Vertical Bridge in June 2025, a deal that lowered Verizon’s owned site tally below 5,000 and freed capital for fiber and spectrum priorities. AT&T has telegraphed a willingness to transact on similar terms should valuation multiples accommodate its return thresholds. Joint ventures with utilities and transportation authorities also populate the pipeline; Phoenix Tower International monetized 150 supervisory control and data acquisition towers from a Midwest cooperative in 2024, a template soon to be replicated in other states.
Operator-owned stock has dwindled to roughly 15% of the addressable footprint, mostly clustered among rural carriers for whom leaseback payments outweigh the balance-sheet benefit of a sale. Meanwhile, real estate investment trust structures offer tax-advantaged depreciation and access to public-market capital that accelerates roll-up economics. Should Congress alter depreciation schedules or reclassify tower assets, the pace of monetization could slow, but no active legislation threatens that calculus as of early 2026. In the absence of tax reform, the United States telecom tower industry will continue marching toward a private-heavy ownership mix that concentrates scale economies and bargaining power among a handful of national landlords.
Geography Analysis
Regional demand patterns in the United States telecom tower market split along urban-rural and coastal-inland lines. The Pacific and Atlantic seaboards capture the majority of new stealth and rooftop leases, mirroring dense zoning constraints and high per-megahertz-per-pop spectrum values. The Midwest and Great Plains, by contrast, rely on lattice and guyed constructions that stretch signals across flatter terrains at lower tenancy ratios. Southern states absorb sizeable tower demand tied to hurricane resilience upgrades, prompting owners to harden sites with reinforced foundations and redundant power systems.
In the Northeast corridor, rooftop installations surged as historic districts resist ground-based monopoles. Manhattan alone recorded more than 700 rooftop amendments in 2025, reflecting sub-500-foot inter-site distances necessary for C-band throughput. The Mid-Atlantic markets of Washington-Baltimore and Philadelphia maintained healthy colocation pipelines, buoyed by federal agency bandwidth requirements and robust enterprise private-network projects. Conversely, New England’s softer population growth and tougher historic-preservation codes limit new applications, tilting revenue toward amendment-driven rent escalations.
The Southeast exhibits blended dynamics. Florida enforces wind-load codes that favor monopole and stealth designs, while Georgia and the Carolinas harness BEAD funding to back fixed-wireless access builds in underserved rural counties. Texas anchors the Southwest segment, where energy corridor population influxes generate macro coverage needs yet also spark rooftop expansion in Austin and Dallas high-rise clusters. The Rocky Mountain region struggles with permitting in federal lands, lengthening median project timelines to 14-18 months, though Broadband Equity funding is gradually unblocking tribal reservations for fresh construction.
The Upper Midwest, dominated by agricultural land uses, remains a stronghold for guyed towers rising more than 300 feet, a trade-off that maximizes radius while minimizing site count. Harsh winter climates push operators toward lattice redundancy, raising per-site capital but lowering the number of builds required statewide. Pacific Northwest jurisdictions like Portland and Seattle impose strict height caps, catalyzing small-cell densification and inadvertently suppressing macro leasing velocity. Finally, Alaska, Montana, and Wyoming benefit disproportionately from NTIA’s flexible technology endorsement, as wireless bids overtake fiber in state scoring rubrics that privilege build speed and per-household cost efficiency. Across every geography, federal shot-clock reforms apply pressure on municipalities to process applications within codified timelines, tightening the demand and supply loop across the entire United States telecom tower market.
Regulatory Landscape
The regulatory environment for US telecom towers is shaped primarily by the Federal Communications Commission (FCC) siting, fee, and shot-clock policies, alongside federal broadband program rules that influence where and how networks are built. In September 2025, the FCC finalized shot-clock timelines that target 60-day reviews for colocation and 90-day windows for new towers, tightening the processing cadence for municipal approvals and reducing time-to-lease for tower owners and tenants.
In parallel, the FCC advanced a broader barrier-reduction agenda through proceedings including WT Docket No. 25-276 and WC Docket No. 25-253, which focus on curbing prohibitive state and local practices such as excessive fees, delays, and burdensome dispute-resolution processes for communications infrastructure. These measures interact with NTIA broadband program administration (including BEAD) by accelerating the permitting side of grant-backed deployments, particularly in rural and exurban build areas where tower-based fixed wireless is a key delivery mechanism.
Value Chain Analysis
The US telecom tower value chain starts with site origination and real estate control (ground leases, rooftops, and rights-of-way), then moves through zoning and permitting, engineering and construction (tower steel, foundations, shelters, and civil work), and the integration of power and backhaul (utility service, generators/batteries, and fiber or microwave). Tower companies then monetize assets through lease-up and amendments under master lease agreements with MNOs, followed by long-cycle operations and maintenance that spans structural inspections, vegetation management, security, and energy-management programs.
On the ownership and operating layer, the ecosystem is anchored by large tower landlords such as American Tower, Crown Castle, and SBA Communications, with private consolidators such as Vertical Bridge and Phoenix Tower International active in sale-leasebacks and niche portfolios. The Wireless Infrastructure Association (WIA) provides an industry backbone for advocacy and workforce development, and its 2025 infrastructure statistics highlight the scale of the downstream services market that supports towers (construction, maintenance, and operations). A notable 2026 structural shift in the chain is Crown Castle's move toward a pure-play tower model via the planned divestiture of its fiber and small-cell operations, changing how neutral-host fiber and dense-node work is sourced and coordinated relative to macro-tower leasing.
Competitive Landscape
American Tower, Crown Castle, and SBA Communications collectively hold just under 70% of privately owned sites, yielding a moderately concentrated field where scale begets bargaining leverage. Their dominance stems from nationwide ground-lease templates, proprietary site-acquisition teams, and multidecade carrier relationships. Yet private challengers such as Vertical Bridge and Phoenix Tower International leverage agile capital structures and opportunistic sale-leaseback deals to gain share in niche corridors. Competitive flashpoints include renewal negotiations, where tower landlords push for 5%-7% rent escalators, and carrier resistance focuses on capping increases near consumer-price inflation benchmarks.
Technology strategy also divides the pack. Crown Castle’s fiber-to-the-tower network, spanning 40,000-plus sites, underpins low-latency offers that fetch 8%-12% pricing premia over microwave-reliant peers. American Tower’s renewable roadmap appeals to sustainability-minded carriers seeking Scope 2 emissions cuts within supply-chain disclosures. SBA Communications deploys data-science modeling to predict colocation success and compress build-to-revenue cycles, a tactic that attracts venture-funded fixed-wireless startups. The combined top-five portfolio exceeds 120,000 domestic towers, yet roughly 35,000 further sites remain in the hands of utilities, transportation agencies, and rural cooperatives, representing latent acquisition fodder once interest-rate spreads normalize.
Dish Wireless introduces a disruptive wrinkle. Its Open RAN deployment employs lighter radios and centralized virtualized baseband units, enabling placement on stealth flagpoles and rooftops that traditional monopoles cannot structurally support. Cable operators, meanwhile, shore up Citizens Broadband Radio Service small-cell grids that off-load traffic, nibbling at macro tower utilization in dense apartment corridors. Furthermore, local governments that impose 150-foot height caps effectively reduce addressable tower volume, prompting distributed-antenna and neutral-host business models to emerge as substitutes. Despite these pressures, tenancy ratios continue inching upward in high-population zones, ensuring the United States telecom tower market retains a resilient, albeit evolving, profit structure.
United States Telecom Tower Industry Leaders
-
American Tower Corporation
-
Crown Castle Inc.
-
SBA Communications Corp.
-
Vertical Bridge, REIT, LLC
-
Phoenix Tower International (PTI)
- *Disclaimer: Major Players sorted in no particular order
Market Opportunities and Future Outlook
Two whitespace areas stand out within the current market structure: (i) rural and exurban tower leasing tied to BEAD-funded fixed-wireless proposals, and (ii) higher-value site upgrades that pair traditional macro leases with energy resilience and edge-adjacent capabilities. NTIA's June 2025 BEAD guidance that treats fixed wireless on par with fiber expanded the addressable pool for tower-backed solutions, and carriers' public FWA targets translate into continued demand for rooftop and monopole tenancy in eligible blocks where fiber economics are weak.
A second opportunity band is tower-as-a-platform monetization, where landlords package power upgrades, space, and connectivity to support densification and emerging low-latency workloads. American Tower's disclosure of deploying its first edge data center in Raleigh, North Carolina provides a concrete signal that tower companies are productizing edge-adjacent infrastructure alongside conventional colocation, while WIA and industry commentary in 2026 has emphasized AI-driven traffic growth as an added driver of capacity and upgrade cycles. The combination of FCC process reforms (faster approvals) and active capital reallocation by tower operators (including portfolio and business-model reshaping) creates room for differentiated offerings around faster amendment turnarounds, rooftop enablement, and renewable or battery retrofits that improve uptime in weather- and outage-prone territories.
Recent Industry Developments
- May 2026: Crown Castle Inc. completed the sale of Fiber Solutions to Zayo Group Holdings Inc. and the Small Cell business to Arium Networks for 8.5 billion dollars, with debt reduction and a share repurchase program. The divestiture refocuses Crown Castle on core macro-tower assets and could shift tenancy dynamics in urban corridors.
- May 2026: American Tower Corporation deployed its first edge data center in Raleigh, North Carolina, marking a push into edge computing with plans for further expansion. The move broadens services to tenants and strengthens the value proposition for densified tower assets and potential new revenue streams.
- April 2026: Vertical Bridge (private tower operator) announced a 1.5 billion dollar strategic equity investment from KKR to support growth and capital deployment of its nationwide tower portfolio. The influx of private capital accelerates expansion and deepens competitive pressure on public REIT peers.
Research Methodology Framework and Report Scope
Market Definition and Coverage
For this report, the United States telecom towers market is defined as revenue generated from tower infrastructure made available for wireless network deployment, mainly through leasing and related site services tied to macro tower assets across the US.
Scope exclusions: It excludes handset and core network spending, and it does not treat small cells and indoor DAS nodes as tower assets unless they are explicitly bundled into tower lease revenues.
Segmentation Overview
- By Fuel Type
- Renewable-powered
- Non-renewable-powered
- By Type of Tower
- Lattice Tower
- Guyed Tower
- Monopole Tower
- Stealth Tower
- By Installation
- Rooftop
- Ground-based
- By Ownership
- Operator-owned
- Joint Venture
- Private-owned
- MNO Captive
Data Sources, Market Sizing, and Validation
Desk Research
Desk research was used to set the factual backbone of the model before any assumptions were applied. We reviewed public tower counts, cell site trends, and deployment programs to understand where lease demand should rise, and where it should stay flat as carrier spending shifts.
Sources were taken from official and non-paywalled channels such as FCC licensing and siting releases, NTIA broadband program updates, Bureau of Labor Statistics labor series, and trade bodies such as CTIA and WIA (including infrastructure count summaries). We also used company filings, earnings decks, and reputable press coverage to map leasing dynamics, amendment activity, and carrier capital priorities, and then cross-checked a few items using paid subscriptions for company financial intelligence, news and filings, and patent look-ups when technology shifts needed clarification. This list is not exhaustive and many other sources were referred to for data collection, validation, and research clarification.
Primary Interviews and Surveys
Primary work focused on validating what drives tower revenue in real contracts, which is usually tenancy additions, amendment volumes, and escalators rather than just new tower builds. We spoke with a mix of tower owners and operators, service contractors, and carrier-side roles, with coverage across large metro areas and rural build zones so we could test assumptions on permitting pace and upgrade cycles.
Distribution of primary research fieldwork respondents
| Company type | Respondent position |
|---|---|
| Top tier: 39% | CXOs: 16% |
| Mid tier: 44% | Functional/Unit leaders: 32% |
| Smaller Players: 17% | Managers: 52% |
Market-Sizing & Forecasting
Sizing started from a top-down reconstruction of the US tower leasing demand pool, where tower counts and active cell site growth signals were translated into expected leasing intensity by geography and rollout cycle, and then converted into revenue using typical lease rate bands and escalation patterns. Totals were then corroborated using selective bottom-up checks, including sampled lease economics, supplier and contractor channel checks on activity levels, and a sanity check against reported tower segment revenues. This helped adjust for any overstatement in amendment-driven growth.
Inputs that mattered most included purpose-built tower counts, macro site additions versus decommissions, 5G mid-band upgrade cadence, average tenancy and churn from network consolidation, and the pace of rural coverage programs that influence new colocations. Forecasting relied on scenario analysis, where a base case was anchored to expected carrier capex normalization and permitting timelines, and then tightened using expert consensus on amendment volumes and colocation demand by market type. Where a clean bottom-up roll-up was not possible (for example, private portfolios with limited disclosure), gaps were handled through peer benchmarking on tenancy and lease rate ranges, and re-tested during interviews.
Data Validation & Update Cycle
Model outputs were checked against independent signals such as publicly discussed tower counts, cell site growth statistics, and the timing of spectrum-related deployment waves, and then reviewed for outliers by geography and ownership type. When a variance appeared, we re-opened the assumptions behind tenancy additions, amendment pricing, or churn and re-contacted relevant experts to confirm whether the shift was real or data noise.
Before sign-off, results go through multi-step analyst review so arithmetic, unit consistency, and assumption logic are clean and repeatable. Reports are refreshed annually, with interim updates triggered by material events such as major carrier capex resets, large portfolio transactions, or meaningful regulatory changes, and then a final pre-delivery pass is completed so clients receive the latest view.
Mordor Intelligence's United States Telecom Towers Market Size Compared Against Other Published Estimates
Published market sizes for US telecom towers can land far apart because authors do not always measure the same revenue pool, and because the unit of analysis shifts between towers, all cell sites, and broader wireless infrastructure spending. The year chosen, the treatment of escalators and amendments, and the handling of carrier consolidation effects also move the final number.
By tracking lease-driven revenue tied to macro tower assets and refreshing tower count and tenancy assumptions, Mordor Intelligence keeps the estimate anchored to tower economics rather than mixing in wider cell site operations or full network investment. In contrast, some estimates bundle in small cells, indoor nodes, or construction and maintenance services, and others use aggressive upgrade curves without validating churn, which can push totals higher in the near term.
Benchmark comparison
| Source | Market Size | Gaps in Research Methodology |
|---|---|---|
| Mordor Intelligence | USD 7.34 B (2025) | |
| Industry Database A | USD 57.90 B (2026) | This view typically tracks a broader cell site operation and leasing universe that can include non-tower infrastructure and wider service revenues, which expands the addressable pool well beyond macro tower lease streams. |
| Sector Publisher B | USD 40.00 B (2024) | This estimate appears to treat the category closer to overall tower ownership and leasing revenue, and it may fold in adjacent site services or non-tower assets, with limited clarity on tenancy, churn, and escalation modeling by contract cycle. |
The spread in the table is mainly explained by what gets counted as tower market revenue and how tightly the model is tied to macro tower leasing signals. When the scope is kept to tower lease economics and then tested against observed deployment and tenancy patterns, the number becomes easier to reconcile and more repeatable for planning.
Key Questions Answered in the Report
How large is the United States telecom tower market in 2026?
The sector is valued at USD 7.63 billion in 2026, on track to reach USD 9.01 billion by 2031.
What factors drive new tower leasing over the next two years?
5G mid-band densification, BEAD-funded fixed-wireless rollouts, and FCC shot-clock reforms are spurring immediate lease demand.
Why are rooftop installations gaining popularity?
Rooftops bypass costly land purchases, shorten permitting cycles, and align with dense urban coverage needs where inter-site gaps must remain under 0.5 miles.
How will higher interest rates influence tower acquisitions?
Elevated borrowing costs widen bid-ask spreads, delaying large portfolio deals and lifting required returns for leveraged buyers.
Which tower design is growing fastest through 2031?
Stealth structures, including flagpole and tree conceals, are projected to grow at a 4.37% CAGR, outpacing monopole and lattice alternatives.
What share of sites use renewable power today?
Renewable-powered locations represent roughly 37% of installations in 2025, with portfolio owners targeting 60% or more by 2030.