
Market Overview
| Study Period | 2020 - 2031 |
|---|---|
| Forecast Data Period | 2026 - 2031 |
| Base Year Market Size (2025) | USD 344.45 Billion |
| Market Size (2026) | USD 357.57 Billion |
| Market Size (2031) | USD 431.03 Billion |
| Growth Rate (2026 - 2031) | 3.81 % |
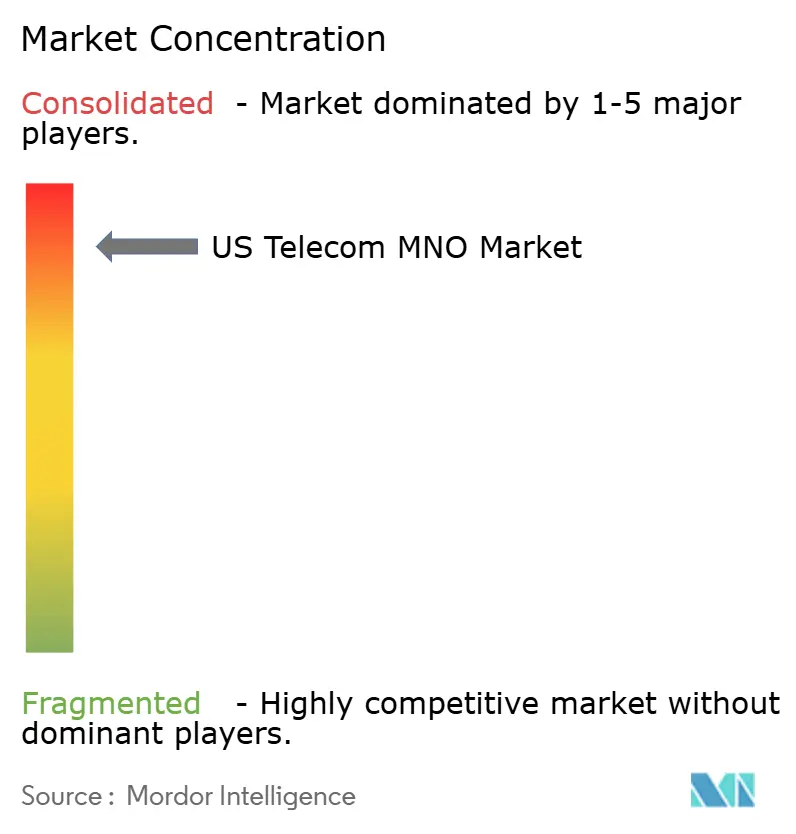
| Market Concentration | High |
Major Players *Disclaimer: Major Players sorted in no particular order Image © Mordor Intelligence. Reuse requires attribution under CC BY 4.0. | |
US Telecom MNO Market Analysis by Mordor Intelligence
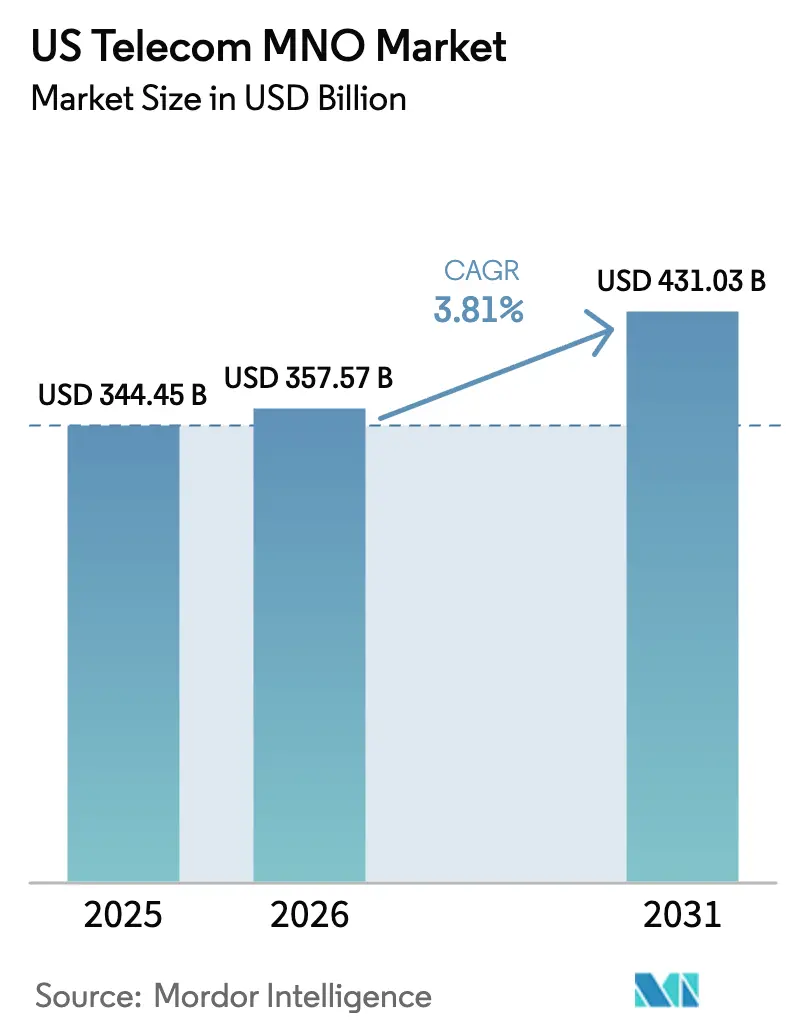
US Telecom MNO market size in 2026 is estimated at USD 357.57 billion, growing from 2025 value of USD 344.45 billion with 2031 projections showing USD 431.03 billion, growing at 3.81% CAGR over 2026-2031.
This steady trajectory reflects a mature arena in which legacy voice and messaging streams shrink while data-heavy applications, private cellular deployments, and integrated enterprise platforms expand margins. Heightened monetization of costly 5G assets is central to growth, with operators rolling out premium service tiers, network-as-a-service propositions, and low-latency edge nodes. Private and public sector subsidies for rural coverage, aggressive monetization of spectrum holdings, and AI-driven network automation continue to widen total addressable revenue pools. Competitive intensity remains contained because three national carriers dominate spectrum depth and retail distribution, allowing disciplined pricing even as prepaid churn rises. Capital discipline, energy optimization, and spectrum refarming collectively underpin operators’ ability to fund continued densification without materially eroding free cash flow [1].
Key Report Takeaways
- By service type, data and internet captured 53.12% of the US Telecom MNO market share in 2025. IoT and M2M are projected to advance at a 3.92% CAGR through 2031.
- By end user, the consumer segment held 73.65% revenue share of the US Telecom MNO market size in 2025. The enterprise segment is forecast to post a 4.15% CAGR between 2026 and 2031.
Note: Market size and forecast figures in this report are generated using Mordor Intelligence’s proprietary estimation framework, updated with the latest available data and insights as of 2026.
US Telecom MNO Market Trends and Insights
Drivers Impact Analysis*
| Driver | (~) % Impact on CAGR Forecast | Geographic Relevance | Impact Timeline |
|---|---|---|---|
| 5G stand-alone core roll-outs accelerating data monetization | +1.2% | National metro clusters | Medium term (2-4 years) |
| Fixed-wireless access (FWA) displacing legacy copper | +0.8% | Rural and suburban markets | Short term (≤ 2 years) |
| eSIM-only device launches simplifying churn | +0.4% | Urban centers | Medium term (2-4 years) |
| Federal BEAD and middle-mile grants stimulating rural build-outs | +0.6% | Underserved counties nationwide | Long term (≥ 4 years) |
| Private-cellular demand from IIoT and campus networks | +0.5% | Industrial corridors | Medium term (2-4 years) |
| AI-driven RAN optimization lowering OPEX | +0.3% | Nationwide macro and small-cell grid | Short term (≤ 2 years) |
| Source: Mordor Intelligence | |||
5G Stand-Alone Core Roll-outs Accelerating Data Monetization
Full migration to stand-alone (SA) architecture allows carriers to create virtual slices that guarantee latency and throughput, adding service differentiation unavailable on legacy non-stand-alone deployments. T-Mobile commercialized public-safety slices that already contribute USD 200 million in recurring annual revenue, while Verizon leverages SA to support sub-10 millisecond edge workloads for manufacturing robotics [2]. Enterprise deals often bundle API exposure so developers can embed carrier-grade authentication and billing directly into applications, a pathway to an estimated USD 20 billion platform revenue pool by 2028 [3]. Higher-value network slices translate into 3-5 times the ARPU of mass-market mobile broadband, directly lifting the US Telecom MNO market.
Fixed-Wireless Access (FWA) Displacing Legacy Copper
National FWA subscriptions crossed the 10 million mark by end-2024 as mid-band and C-band spectrum enabled 300 Mbps average downlink in rural clusters. The product directly cannibalizes outdated DSL and coax footprints, fills fiber coverage gaps, and accelerates operators’ payback on 5G radios. FWA also strengthens household bundling, with wireless carriers attaching mobile lines at an 18% higher rate when a home internet account is present. Capacity constraints in dense suburbs trigger active-antenna expansions and spectrum-sharing algorithms, yet economics remain favorable relative to trenching. Rapid customer growth adds 0.8 percentage points to the US Telecom MNO market CAGR through 2027.
eSIM-Only Device Launches Simplifying Churn
Apple, Samsung, and Google now default flagship models to eSIM-only activation in the United States, eliminating physical SIM logistics and slashing carrier fulfillment costs by roughly USD 2 per gross add. Digital provisioning accelerates number portability but also empowers operators to embed instant-on trial offers during device setup. Carriers offset higher churn risk with loyalty bundles tied to cloud storage, streaming, and cybersecurity apps payable via a single click. Conversion analytics indicate a 12% uplift in average lifetime value for accounts onboarded via self-activated eSIM flows. The migration adds 0.4 percentage points of lift to the overall growth rate by enabling frictionless cross-selling of ancillary lines.
Federal BEAD and Middle-Mile Grants Stimulating Rural Build-outs
The USD 42.45 billion Broadband Equity, Access, and Deployment (BEAD) program requires funded projects to deliver at least 100/20 Mbps service, prompting states to prioritize fiber but still allocate wireless funds where trenching costs are prohibitive. By March 2025, 47 states and territories had completed challenge processes and begun obligating awards, accelerating backhaul deployments that mobile carriers can co-opt for macro-tower upgrades [4]. Louisiana’s early success shows that coordinated subsidy stacking delivers universal coverage ahead of schedule, highlighting the catalytic role of middle-mile assets that lower transport costs for 5G nodes. Grants collectively contribute 0.6 percentage points to the forecast CAGR for the US Telecom MNO market.
Restraints Impact Analysis*
| Restraint | (~) % Impact on CAGR Forecast | Geographic Relevance | Impact Timeline |
|---|---|---|---|
| Inflation-induced ARPU pressure in prepaid | -0.7% | Price-sensitive urban and rural segments | Short term (≤ 2 years) |
| Fiber over-builds eroding FWA economics | -0.5% | Select suburban counties | Medium term (2-4 years) |
| C-band aviation mitigation costs | -0.2% | National flight paths | Short term (≤ 2 years) |
| Heightened FCC scrutiny on M&A | -0.3% | Nationwide | Long term (≥ 4 years) |
| Source: Mordor Intelligence | |||
Inflation-Induced ARPU Pressure in Prepaid
Elevated energy and labor expenses compel carriers to raise plan prices, yet prepaid customers exhibit immediate churn when monthly bills climb by more than USD 5. AT&T’s 2025 upward revisions triggered a temporary 190-basis-point increase in prepaid churn, forcing larger retention credits and marketing spend. Operators now extend inclusive content bundles, high-data allotments, and buy-now-pay-later device financing to defend subscriber counts, trimming EBITDA margin by 40-60 basis points over the near term.
Fiber Over-builds Eroding FWA Economics
Regional electric co-ops, cable incumbents, and municipal utilities collectively announced 5.4 million new fiber passings for 2025-2027. Where fiber overlays mature FWA footprints, operators record up to 30% defection within 12 months as households migrate toward symmetrical gigabit speeds. Carriers pivot by steering new FWA installs toward markets with limited fiber competition and by launching Wi-Fi 7 gateways to bolster in-home performance. Even with mitigation, revenue erosion subtracts 0.5 percentage points from the baseline CAGR projected for the US Telecom MNO market.
*Our forecasts treat driver/restraint impacts as directional, not additive. The impact forecasts reflect baseline growth, mix effects, and variable interactions.
Segment Analysis
By Service Type: Data-Centric Revenues Outpace Legacy Streams
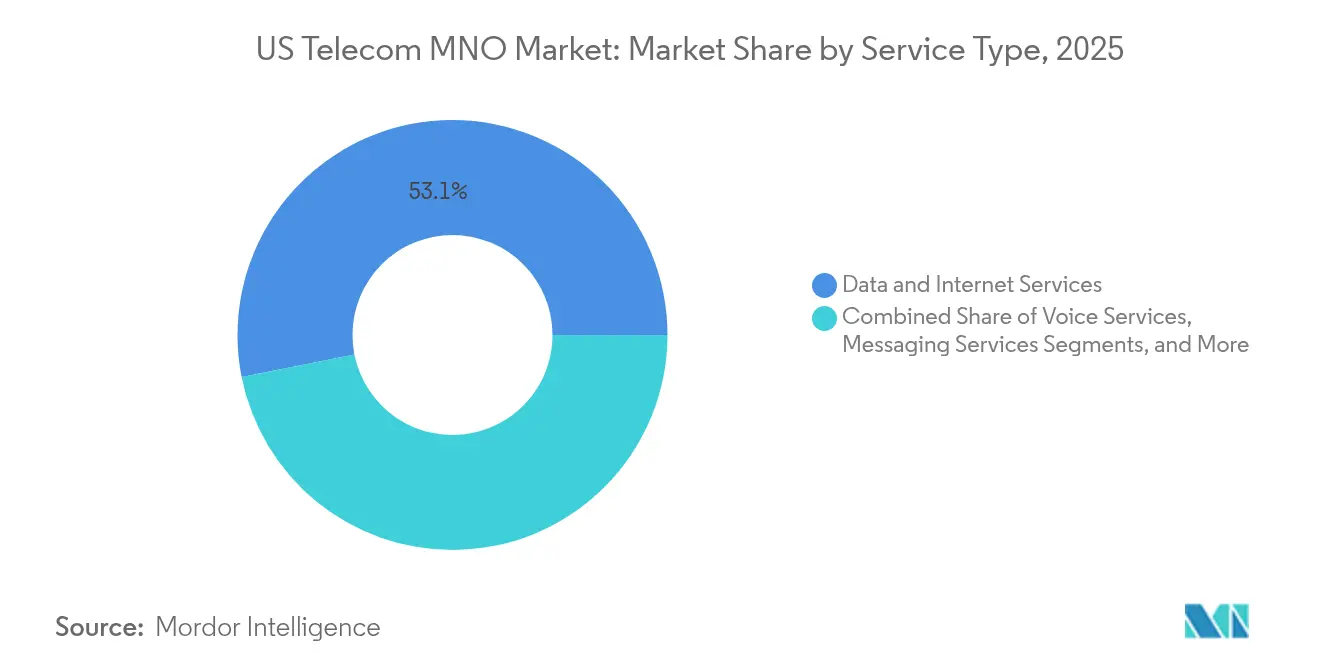
The data and internet category represented 53.12% of 2025 revenue, delivering the single-largest contribution to the US Telecom MNO market size. Unlimited smartphone plans, FWA subscriptions, and enterprise dedicated access collectively underpinned a 7.8% uplift in mobile data traffic per user year-on-year. Premium tiers exploiting carrier aggregation hit verified 5.5 Gbps throughput during 2025 field tests, reinforcing perceived speed leadership and justifying price differentials. Voice and SMS collectively fell below 10% revenue share as over-the-top substitutes drove double-digit usage declines. Meanwhile, IoT and M2M services posted the fastest trajectory, supported by 30 million incremental licensed cellular endpoints and a swelling pipeline of private network installs inside factories, ports, and hospitals. The sub-segment’s 3.92% CAGR through 2031 adds a long-run lift that offsets eroding legacy lines, thereby sustaining expansion in the US Telecom MNO market.
Enterprise data contracts increasingly request SLA-backed throughput and network-slice isolation, commands that draw higher margins and longer-term commitments than consumer lines. Wholesale roaming and virtual operator partnerships add incremental revenue but primarily serve to amortize spectrum assets during off-peak hours. Advanced analytics embedded in self-optimizing networks slash power draw by around 15% and thereby release opex for reinvestment in additional small cells, further reinforcing data-centric positioning across the US Telecom MNO market.

By End User: Enterprise Lines Gain Strategic Weight
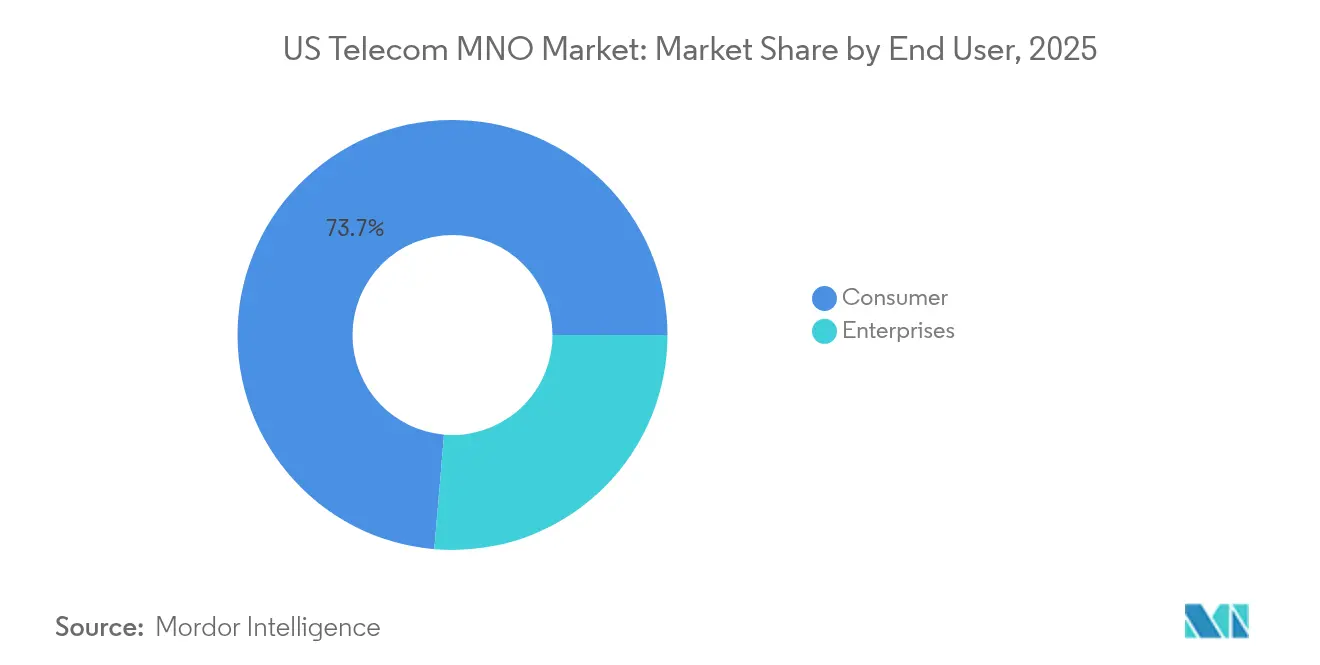
The consumer segment still generated 73.65% of 2025 turnover; however, unit growth slowed to low single digits as smartphone penetration neared 90%. To protect yields, carriers package cloud storage, cybersecurity, and premium support inside loyalty bundles that lift revenue per account by 6-8%. In parallel, enterprise subscriptions rose at a 4.15% CAGR and are forecast to reach almost one-quarter of the total US Telecom MNO market size by 2031. Manufacturing, mining, logistics, and university campuses procure stand-alone private networks to enable latency-sensitive automation, CCTV analytics, and asset tracking. Carriers bundle consulting, edge computing, and managed security, turning connectivity into a full-stack offer that secures wallet share and lengthens contract duration. Integrated mobile-edge applications often command multi-year minimum revenue commitments exceeding USD 10 million, a material boost to average contract value throughout the US Telecom MNO industry.
Enterprises also press for open APIs that unlock real-time quality-of-service adjustments, stimulating standardized interface launches such as the Aduna platform. Carriers anticipate platform fees supplementing bandwidth sales, positioning themselves as orchestration hubs across multi-cloud and multi-site environments. Consumer and enterprise businesses increasingly share distributed computing nodes, spectrum assets, and tariff management systems, enabling carriers to sweat capital investments across the full US Telecom MNO market.
Geography Analysis
Although treated as one national market, the United States exhibits pronounced urban-rural performance divergence that impacts deployment schedules and capital intensity. Dense metropolitan clusters captured early 5G stand-alone launches because spectrum-layer cake architectures yield immediate monetization through premium smartphone tiers and network slices. Through 2025, operators installed nearly 11,000 additional C-band radios across the top 50 markets, lifting average downlink speed 28% and shoring up customer satisfaction metrics.
Rural strategy revolves around FWA, low-band coverage, and BEAD-funded fiber backhaul. Nearly USD 7.9 billion of planned BEAD awards are allocated to counties where wireline density is too sparse to justify private investment, enabling carriers to co-locate antennas on fiber-fed poles at subsidized rates. Where terrain frustrates aerial or buried fiber, carriers explore direct-to-device satellite roaming agreements to guarantee emergency coverage. These hybrid models secure voice and text continuity across 99.5% of the US landmass, a milestone operators highlight in marketing aimed at travelers, public safety agencies, and agriculture clients.
Sub-regional differentiation also emerges around the spectrum mix. Mid-band holdings dominate east-coast and Great Lakes clusters, whereas 600 MHz band layers carry a larger traffic share across the Great Plains. Millimeter-wave small cells concentrate in NFL stadiums, downtown promenades, and high-footfall transit terminals, supporting multi-gigabit bursts that accompany immersive fan and retail experiences. Spectrum-sharing trials under the Citizens Broadband Radio Service regime are most active along manufacturing belts from Michigan through Tennessee, reflecting the spread of Industry 4.0 pilots feeding enterprise revenue pools.
Regulatory Landscape
US telecom MNO operations are governed primarily by the Federal Communications Commission (FCC) through spectrum policy, infrastructure deployment rules, and equipment authorization, alongside federal broadband funding administered by the National Telecommunications and Information Administration (NTIA). In July 2026, the FCC set a tentative agenda that included rules tied to an Upper C-band auction framework (160 MHz), reinforcing the centrality of mid-band spectrum policy to national 5G capacity and monetization strategies.
Policy focus has also shifted toward future-proofing networks and supply chains. In May 2026, the FCC initiated a Notice of Proposed Rulemaking to modernize High-Cost universal service mechanisms (WC Docket Nos. 26-96 and 10-90) in the context of an all-IP transition. It also issued a Third Report and Order to target equipment-authorization supply-chain loopholes by strengthening restrictions connected to Covered List entities. Parallel FCC initiatives under its Build America agenda emphasize permitting and deployment acceleration for fiber and wireless infrastructure, which shapes operator rollout timelines and compliance requirements.
Competitive Landscape
Market power remains highly concentrated because Verizon, AT&T, and T-Mobile collectively control a significant share of subscribers, spectrum parcels, and retail storefronts. Such concentration places the US Telecom MNO market on the cusp of a natural oligopoly; price competition stays rational while differentiation centers on network quality, value-added services, and enterprise solution depth. Verizon retains the largest retail base at 157 million connections but has ceded 5G speed leadership to T-Mobile, which leverages its 2.5 GHz trove to post a 158.5 Mbps nationwide average. AT&T counters with enterprise-heavy positioning, bundling wireline, cloud, and security around its FirstNet public-safety franchise.
Each carrier aggressively deploys AI for predictive maintenance, traffic steering, and load balancing, reducing network opex by an estimated 15% and shrinking energy consumption per gigabyte. Strategic moves illustrate divergence: Verizon negotiated a 195,000-square-foot headquarters lease in Manhattan to centralize innovation labs; T-Mobile invested in satellite partner SpaceX to secure early direct-to-device texting and emergency roaming; AT&T focused on integrating network APIs into its Aduna collaboration to target fintech, healthcare, and insurance software developers. Outside the “big three,” regional carriers such as UScellular leverage CBRS and fixed wireless to defend rural bases, while MVNOs lean on price transparency and digital-only care to nibble at prepaid niches.
Competitive experimentation increasingly involves ecosystem alliances. Verizon, Ericsson, and Intel operate an open radio innovation center in Dallas; AT&T joined Qualcomm to pilot RedCap chipsets aimed at industrial sensors; T-Mobile inked an exclusive distribution deal for AR glasses bundled with unlimited 50 Mbps uplink slices. Satellite integration adds another vector: in 2025 Verizon and AT&T completed the first cellphone-to-satellite video call over AST SpaceMobile’s BlueBird platform, signaling early momentum toward direct-to-device coverage for sparsely populated corridors. These collaborative wagers seek to redefine market boundaries and maintain relevance as data traffic compounds.
US Telecom MNO Industry Leaders
-
Verizon Communications Inc.
-
AT&T Inc.
-
T-Mobile US, Inc.
- *Disclaimer: Major Players sorted in no particular order
Market Opportunities and Future Outlook
Rural coverage and transport upgrades keep creating whitespace for operators to extend 5G and fixed-wireless economics beyond top metros. Federally funded fiber and middle-mile assets improve backhaul availability in underserved counties, and the BEAD program remains a concrete demand catalyst for tower backhaul and last-mile solutions. By July 2026, the NTIA reported 50 of 56 states and territories had final proposals approved, moving more geographies into execution phase where carriers can participate directly or benefit indirectly through improved regional transport.
Enterprise monetization is also broadening as carriers productize 5G capabilities into developer-facing and industry-specific offers. The February 2025 launch of standardized 5G network APIs via the Aduna platform supports paid exposure of network functions (authentication, quality, and routing controls) for sectors such as fintech, healthcare, and insurance that require deterministic connectivity. At the same time, FCC actions in 2026 that address high-cost modernization and supply-chain controls encourage operators to rationalize legacy networks and tighten vendor governance, creating room to pair AI-driven network automation with managed services for enterprises that need SLA-backed performance and security across private cellular, campus networks, and IoT/M2M deployments.
Recent Industry Developments
- July 2026: AT&T hosts immersive fan experiences at Fanatics Fest NYC at the Jacob K. Javits Convention Center using enhanced 5G network capacity. The deployment monetizes 5G capabilities through experiential scenarios and supports enterprise partnerships in the live-events vertical.
- July 2026: AT&T and Ericsson demonstrate drone detection and tracking using 5G network sensing outside AT&T Stadium in Arlington, Texas. The demonstration highlights a network sensing capability that can be commercialized with enterprise clients and large venues.
- July 2026: Verizon named US connectivity provider for newly manufactured BMW Group vehicles through KDDI partnership. The contract deepens connected-vehicle capabilities and broadens Verizon's addressable market in the automotive sector.
Research Methodology Framework and Report Scope
Market Definition and Coverage
For this methodology, the United States telecom market is defined as the revenue generated from connectivity services delivered by mobile network operators to consumers and enterprises, covering voice, data, messaging, and related service bundles.
Scope exclusions: We exclude pure device sales and one-off infrastructure construction revenue where it is not billed as an ongoing telecom service.
Segmentation Overview
- Overall Telecom Revenue and ARPU
- Service Type
- Voice Services
- Data and Internet Services
- Messaging Services
- IoT and M2M Services
- OTT and PayTV Services
- Other Services (VAS, Roaming and International Services, Enterprise and Wholesale Services, etc.)
- End-user
- Enterprises
- Consumer
Data Sources, Market Sizing, and Validation
Desk Research
Desk work starts by building facts that are hard to debate, then narrowing them into a telecom operator revenue view. We used public statistics and regulatory releases such as FCC communications reports and related public attachments, Bureau of Labor Statistics price indexes for telecom services, and US Census Bureau population and household series to normalize per-capita and per-household demand signals.
To keep assumptions realistic, we also reviewed sources such as trade association publications (for example, wireless connections, traffic growth, and capex indicators), operator filings and earnings decks, and reputable press coverage of plan pricing and major network build topics. Select paid subscriptions were used only for company financials and news tracking, plus patent databases to sanity check longer-term technology direction. The sources listed here are illustrative, and many other public documents and datasets were also referenced for data collection, cross-checks, and clarification.
Primary Interviews and Surveys
Primary work focused on validating revenue boundaries and the service mix that sits inside the telecom operator definition, rather than relying only on published totals. We spoke with operator-side commercial teams, network planning roles, enterprise connectivity buyers, and channel or ecosystem experts across the United States, so gaps from desk findings could be closed and assumptions re-tested before totals were finalized.
Distribution of primary research fieldwork respondents
| Company type | Respondent position |
|---|---|
| Top tier: 33% | CXOs: 13% |
| Mid tier: 50% | Functional/Unit leaders: 37% |
| Smaller Players: 17% | Managers: 50% |
Market-Sizing & Forecasting
Sizing is built from the demand pool, where subscriber connections, service adoption, and typical plan-level pricing are used to reconstruct operator service revenue at the country level, and then split into the included service lines. We state the top-down and bottom-up logic together because the model starts with macro checks (connections, traffic growth, and service pricing direction) and then corroborates through selective roll-ups from operator reported service revenue and sampled price points, so totals stay realistic.
Inputs we track for this market include mobile subscriber connections and churn direction, 5G coverage expansion and capacity adds, mobile data usage growth, plan pricing and discounting patterns, and the mix shift between consumer and enterprise usage (including IoT and M2M lines). Where a service line is not consistently disclosed, the gap is handled through ratio-based splits that were tested in interviews and then rechecked against the direction in filings.
For forecasting, we rely on scenario analysis supported by simple trend models where needed, using expected changes in connections, usage intensity, and pricing per line as the main drivers. The forecast path is reviewed with experts so the assumptions reflect realistic adoption timing and competitive pricing behavior, rather than applying a straight-line uplift.
Data Validation & Update Cycle
Validation is done through multiple passes, where outputs are compared against independent signals such as regulated revenue references, publicly discussed service revenue trends, and adoption indicators like connections and network investment. Outliers are investigated at the assumption level, and if a variance cannot be explained by scope or timing, we re-contact sources and rerun the affected blocks before analyst sign-off.
Reports are refreshed annually, and interim updates are made when major events materially change pricing, regulation, or network build plans. Before delivery, an analyst performs a fresh review of key inputs and recent disclosures so clients receive an updated view aligned with the latest available information.
Mordor Intelligence's United States Telecom Market Size Compared With Other Published Estimates
Published market sizes for US telecom can differ even when they sound similar, mainly because firms draw the market boundary in different places and use different revenue cut rules. Differences also show up when one model leans on reported totals only, and another rebuilds the market from demand and pricing indicators.
Wireless service revenue time series, subscriber connection counts, and observed plan pricing movements are the checks that keep Mordor Intelligence's estimate tied to the operator service revenue pool, which is why adjacent items like device sales or non-service construction work are not blended into the total.
Benchmark comparison
| Source | Market Size | Gaps in Research Methodology |
|---|---|---|
| Mordor Intelligence | USD 344.45 B (2025) | |
| Industry Association A | USD 224.91 B (2024) | Uses wireless services revenue as the primary anchor, which can under-count the broader operator mix when additional telecom service lines are included or when definitions differ on bundled items. |
| Regulatory Dataset B | USD 228.50 B (2023) | Relies on reported telecommunications revenue categories and reporting periods, which can lag the market and may not align cleanly with the study's operator service scope and timing conventions. |
The spread is mainly explained by scope and timing, not by one simple math difference. When the same market boundary is held steady and the totals are cross-checked against connections and pricing direction, the resulting number is easier to reproduce and to track over time with clear steps.
Key Questions Answered in the Report
How large is the US Telecom MNO market in 2026?
It stands at USD 357.57 billion and is projected to reach USD 431.03 billion by 2031, implying a 3.81% CAGR.
Which service line is growing the fastest?
IoT and M2M connections lead with a 3.92% CAGR, benefiting from private cellular and industrial automation roll-outs.
Who are the market leaders?
Verizon, AT&T, and T-Mobile control more than 95% of total revenue, shaping pricing and network investment patterns.
What role does fixed-wireless access play?
FWA surpassed 10 million lines in 2024, providing 300 Mbps household broadband where fiber is not yet economical.
How are federal subsidies influencing expansion?
The USD 42.45 billion BEAD program funds middle-mile and last-mile projects, enabling carriers to upgrade rural towers and backhaul.
Why is 5G stand-alone important?
SA cores enable network slicing and latency below 10 ms, unlocking premium enterprise use cases and multi-gigabit consumer speeds.