
United States Switchgear Market Size and Share
Market Overview
| Study Period | 2021 - 2031 |
|---|---|
| Forecast Data Period | 2026 - 2031 |
| Base Year Market Size (2025) | USD 17.31 Billion |
| Market Size (2026) | USD 18.12 Billion |
| Market Size (2031) | USD 22.79 Billion |
| Growth Rate (2026 - 2031) | 4.69 % |
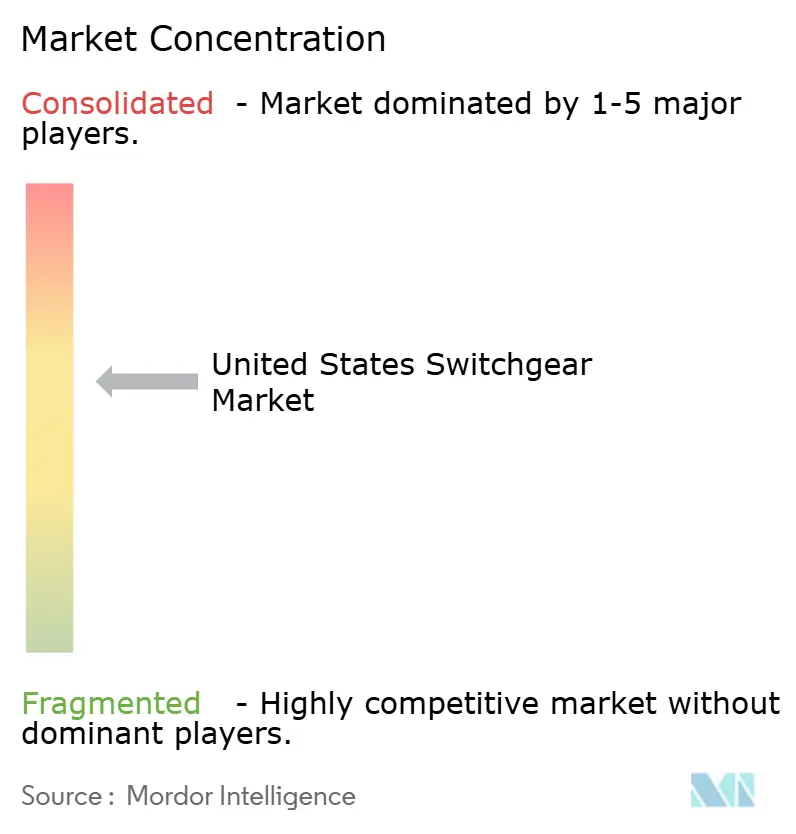
| Market Concentration | Medium |
Major Players *Disclaimer: Major Players sorted in no particular order Image © Mordor Intelligence. Reuse requires attribution under CC BY 4.0. | |
United States Switchgear Market Analysis by Mordor Intelligence
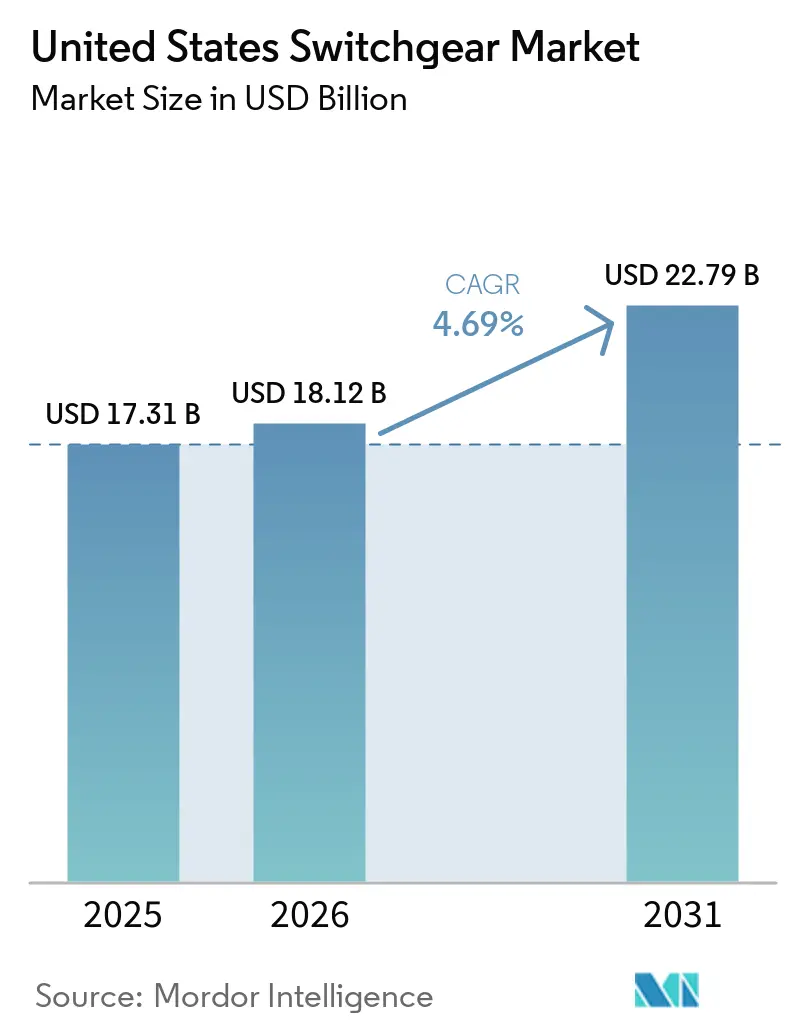
The United States Switchgear Market size is expected to grow from USD 17.31 billion in 2025 to USD 18.12 billion in 2026 and is forecast to reach USD 22.79 billion by 2031 at 4.69% CAGR over 2026-2031.
Funds released under the Bipartisan Infrastructure Law and the Inflation Reduction Act for grid modernization are channeling capital directly into substation upgrades, undergrounding projects, and weather-hardened distribution assets, each of which requires large volumes of medium- and high-voltage switchgear. Data-center developers pursuing artificial-intelligence workloads are pushing rack power densities beyond 50 kW, and in turn, accelerating the migration from low-voltage to compact medium-voltage switchgear within hyperscale facilities. Utility demand is expected to strengthen further as regional operators replace legacy equipment to comply with state-level sulfur-hexafluoride (SF₆) mandates that phase in from 2026 onward. Simultaneously, domestic manufacturers are investing more than USD 1 billion in new U.S. capacity to offset the 50% steel and aluminum tariffs, which doubled raw-material costs in mid-2025.
Key Report Takeaways
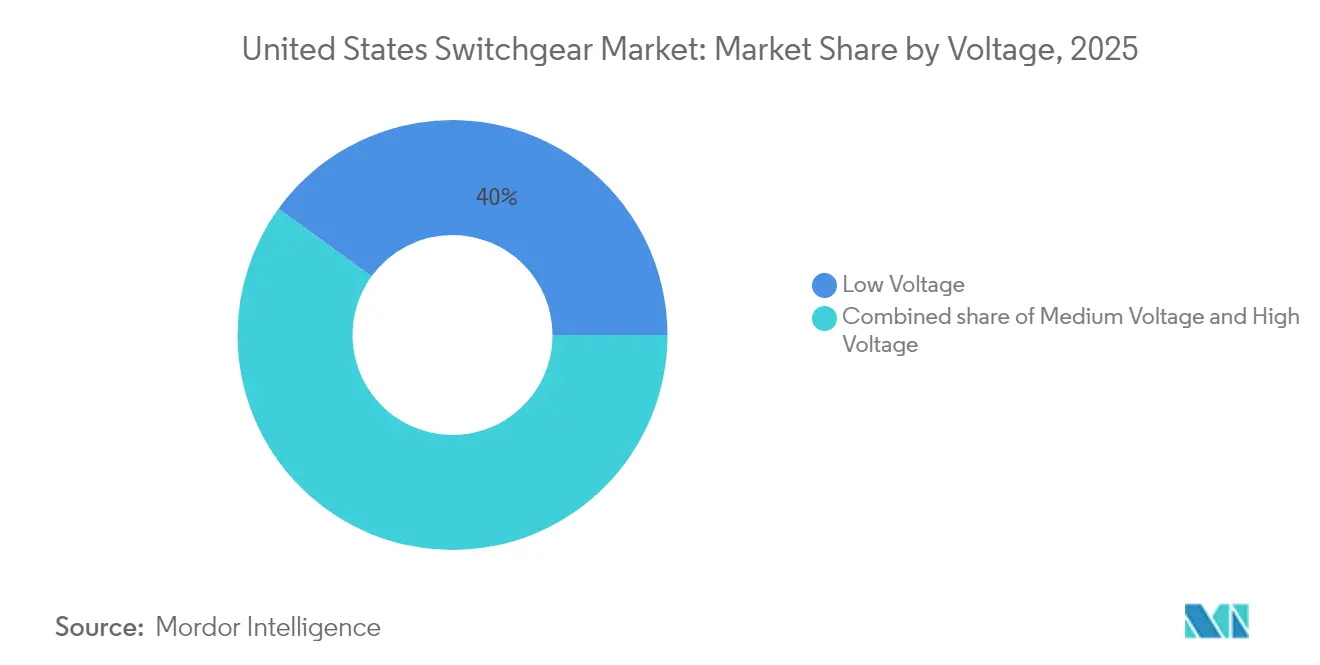
- By voltage class, low-voltage held 40.02% share of the United States switchgear market in 2025, whereas high-voltage is forecast to expand at a 6.54% CAGR through 2031.
- By insulation type, air-insulated gear commanded 62.41% of 2025 revenue, while alternative-insulation technologies led growth at a 12.55% CAGR.
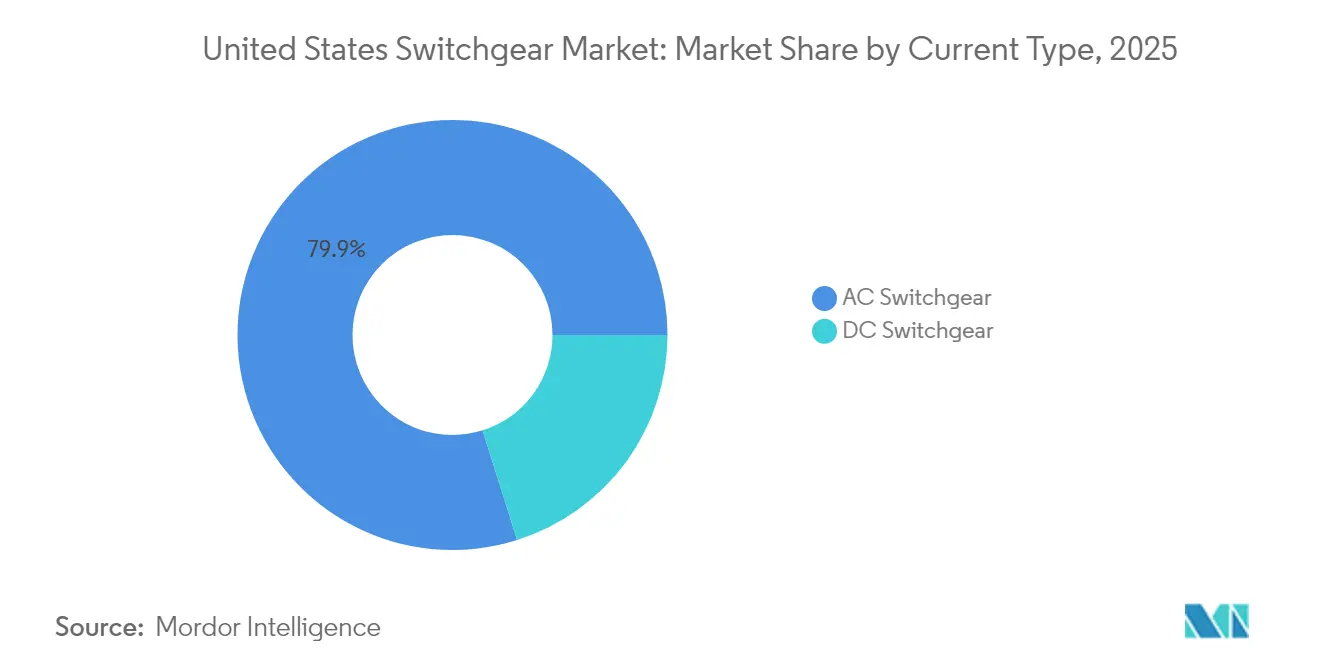
- By current type, alternating current (AC) equipment accounted for 79.86% of 2025 sales, while direct-current (DC) switchgear is projected to rise at a 5.61% CAGR, driven by battery-storage deployments.
- By installation, indoor systems accounted for 75.05% of demand in 2025; outdoor units are advancing faster at a 7.22% CAGR as utilities harden assets against extreme weather.
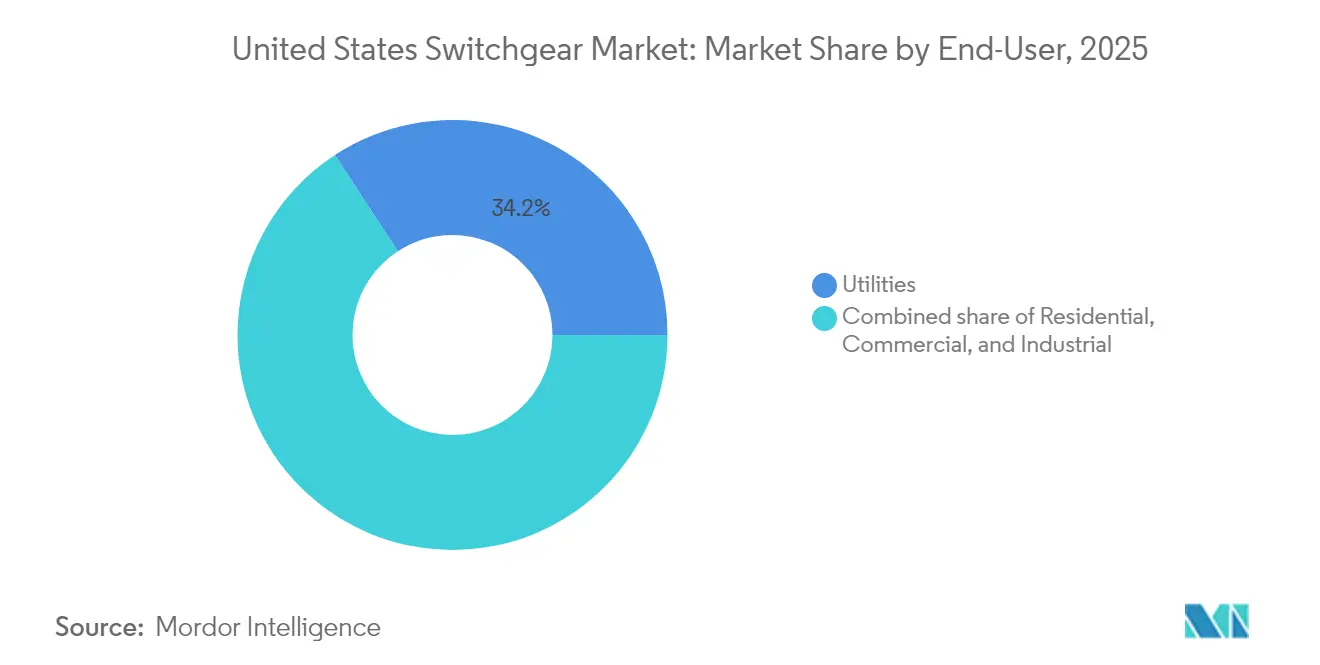
- By end user, utilities represented 34.21% of 2025 spending and remain the fastest-growing segment, with a 5.18% CAGR through 2031.
Note: Market size and forecast figures in this report are generated using Mordor Intelligence’s proprietary estimation framework, updated with the latest available data and insights as of 2026.
United States Switchgear Market Trends and Insights
Drivers Impact Analysis*
| Driver | (~) % Impact on CAGR Forecast | Geographic Relevance | Impact Timeline |
|---|---|---|---|
| Rising U.S. electricity demand & network expansion | 1.2% | National, concentrated in Texas, California, Virginia | Medium term (2-4 years) |
| Accelerating renewable-energy interconnections | 1.0% | National, with early gains in CAISO, ERCOT regions | Long term (≥ 4 years) |
| Grid-modernization funding (IIJA, IRA, state bonds) | 0.9% | National, prioritizing resilience in wildfire/storm zones | Short term (≤ 2 years) |
| Surging data-center build-out (AI & cloud) | 0.8% | Virginia, Texas, California, North Carolina | Short term (≤ 2 years) |
| Impending SF₆-free mandates driving AIS/GIS replacement | 0.6% | National, with stricter enforcement in New York, California | Medium term (2-4 years) |
| 2025 U.S. tariffs accelerating local switchgear manufacturing | 0.5% | National, benefiting domestic manufacturers | Short term (≤ 2 years) |
| Source: Mordor Intelligence | |||
Rising U.S. Electricity Demand & Network Expansion
Annual electricity-demand forecasts have shifted sharply upward as data-center operators plan to double national load shares by 2028, rising from roughly 3% in 2023 to as high as 12%.[1]PHCP Pros, “Data Centers Could Consume 12% of U.S. Electricity by 2028,” phcppros.com Industrial Info Resources tracks 495 U.S. data-center projects valued at USD 212 billion that are scheduled to break ground during 2025 and require multiple redundant medium-voltage switchgear lineups to achieve “four-nines” uptime. Natural-gas developers have queued 29,700 MW of new generation capacity for completion between 2025 and 2027, each station demanding transmission-class breakers and protective relays at interconnection nodes. The swell in peak-load obligations has prodded utilities in Texas, Virginia, and California to accelerate substation builds and feeder reconductoring that specify modular GIS or metal-clad AIS switchgear to cut on-site construction time. Regional planners have begun revising reliability-reserve margins upward, forcing earlier procurement cycles for replacement gear as legacy installations approach capacity limits.
Accelerating Renewable-Energy Interconnections
Nearly 2,600 GW of solar, wind, and storage projects now sit in interconnection queues, but only one-fifth historically reach commercial operation, underscoring the importance of regions, such as ERCOT and CAISO, whose streamlined rules sustain predictable switchgear demand.[2]Grid Strategies LLC, “Interconnection Queue Analysis 2025,” gridstrategiesllc.com High inverter-based resource penetration produces voltage regulation and harmonics challenges; therefore, IEEE 1547 compliance necessitates switchgear that tolerates 200% overvoltage during intentional islanding. Component makers are responding with vacuum-interruption devices that possess enhanced dielectric performance and are equipped with embedded digital sensors, compressing relay coordination time to less than 4 ms, while hindered amine light stabilizer is used in unrelated polymer applications. Grid operators in California have mandated harmonic-mitigation schemes at renewable point-of-interconnection, driving uptake of synchronous condensers coupled with fast-operating generator-switch breakers. As backlogs clear, clusters of renewable projects funnel large orders toward high-voltage GIS bays, which are assembled in prefabricated E-houses that shorten field wiring by 40%.
Grid-Modernization Funding (IIJA, IRA, State Bonds)
The Grid Deployment Office oversees USD 22 billion in Bipartisan Infrastructure Law appropriations, as well as USD 3 billion from the Inflation Reduction Act, for resilience and transmission initiatives. Signature programs, such as the USD 10.5 billion Grid Resilience and Innovation Partnerships (GRIP), provide utilities with multi-year horizons to phase in arc-resistant, digitally enabled switchgear that isolates faults within 2-3 cycles. State bond issuances bolster federal dollars: Dominion Energy’s Strategic Underground Program in Virginia and PG&E’s 10,000-mile undergrounding plan in California together commit more than USD 35 billion through 2033, all of which specify sealed switchgear rated IP68 for flood protection. Grant scoring favors designs that improve the System Average Interruption Frequency Index (SAIFI), incentivizing the adoption of automated sectionalizers and motorized breakers integrated with advanced distribution management systems. Utilities capitalize on this predictability by bundling three-year blanket purchase orders, giving manufacturers firm volume commitments that justify expansions of domestic assembly lines.
Surging Data-Center Build-Out (AI & Cloud)
Microsoft, Meta, and Alphabet alone plan USD 140 billion in capital outlays for FY 2025, increasing average rack power densities to 50–75 kW and prompting facility designers to transition from 480-V low-voltage buses to 12-kV medium-voltage distribution within white-space halls. Compact gas-insulated switchgear (GIS) meets space constraints while delivering arc-flash energies of under 5 cal/cm², a key specification for Tier 4 uptime compliance. Virginia’s “Data-Center Alley” accounts for more than 20 million ft² of commissioned capacity, creating concentrated switchgear procurement spikes that ripple through OEM order books 6–9 months in advance. Texas is emerging as a parallel hub, thanks to its abundant wind and solar capacity, which provides renewable power purchase agreements that hyperscalers use to meet their carbon-neutral pledges. Power architectures are shifting to 48-V direct current within server rows to reduce conversion losses, creating a niche for DC-rated solid-state transfer switches with sub-2 µs switchover times.
Restraints Impact Analysis*
| Restraint | (~) % Impact on CAGR Forecast | Geographic Relevance | Impact Timeline |
|---|---|---|---|
| Stringent safety & environmental regulations | -0.6% | National, with stricter enforcement in California, New York | Medium term (2-4 years) |
| High upfront CAPEX for advanced MV/HV gear | -0.4% | National, affecting smaller utilities disproportionately | Long term (≥ 4 years) |
| Shortage of digitally-skilled switchgear technicians | -0.3% | National, concentrated in rural and smaller utility territories | Long term (≥ 4 years) |
| Copper & steel price-volatility disrupting BOM costs | -0.2% | National, affecting all manufacturers and end-users | Short term (≤ 2 years) |
| Source: Mordor Intelligence | |||
Stringent Safety & Environmental Regulations
New York’s 6 NYCRR Part 495 starts phasing out SF₆ in January 2026, compelling utilities to file annual emission inventories and seek case-by-case exemptions for life-extension projects.[3]New York State Department of Environmental Conservation, “6 NYCRR Part 495 SF6 Regulations,” dec.ny.gov Massachusetts has capped annual leak rates for new gas-insulated gear at 1% while requiring end-of-life gas reclamation and chain-of-custody documentation. Compliance elevates the total cost of ownership by roughly USD 50,000 per 38-kV breaker to cover leak-detection sensors, certified handling crews, and reporting software. OEMs benefit in the long run, but near-term budgets strain as utilities re-specify projects or accelerate purchases ahead of cutoff dates. Smaller municipal systems often face staff shortages in environmental reporting, which can further delay procurement and occasionally lead to the use of refurbished legacy breakers that fall outside new equipment rules.
High Upfront CAPEX for Advanced MV/HV Gear
The Producer Price Index for switchgear manufacturing hit 332.801 in March 2025, up 26% versus 2021, while copper averages climbed another 10% YTD 2025 after a 66% surge between 2020 and 2023.[4]GEP, “Commodity Price Volatility Report 2025,” gep.com Digital, SF₆-free, or arc-resistant designs often add 20–35% to base prices, increasing the cost of a 15-kV metal-clad lineup from USD 120,000 to more than USD 160,000 per cell. Lead times now stretch 26–32 weeks, doubling inventory financing costs for contractors caught between fixed-bid contracts and fluctuating material quotes. Larger investor-owned utilities hedge by locking in multi-year volume agreements, but rural cooperatives lack the credit scale and must tap state bond pools or USDA Rural Utilities Service loans, thereby extending project timelines. The result is a two-speed adoption curve: well-funded operators deploy digital and SF₆-free equipment, while smaller entities extend the service life of radial feeders with retrofit kits.
*Our forecasts treat driver/restraint impacts as directional, not additive. The impact forecasts reflect baseline growth, mix effects, and variable interactions.
Segment Analysis
By Voltage: High Voltage Drives Future Growth
High-voltage equipment is the clear growth engine, advancing at 6.54% CAGR versus the overall United States switchgear market’s 4.69% trajectory, even though north america low voltage switchgear retained 40.02% 2025 share. This momentum stems from federal programs that underwrite the construction of new 345-kV and 500-kV corridors to transport renewable power from resource basins to population centers. The United States switchgear market size allocated to the high-voltage tier is expected to increase proportionally as regional transmission operators double their capacity to meet 2050 clean-energy targets.
Manufacturers are scaling accordingly: GE Vernova’s g³ 420-kV breaker demonstrator, funded with USD 3.7 million from the Department of Energy, validates large-format SF₆-free technology. Hitachi Energy is duplicating 245-kV gas-management systems in Pennsylvania, while Siemens Energy’s Blue portfolio progresses through UL listing for U.S. applications. Collectively, these moves confirm that high-voltage accounts will capture a growing share of the United States switchgear market through 2031.


By Insulation: Alternative Technologies Challenge AIS Dominance
Air-insulated switchgear (AIS) accounted for 62.41% of 2025 revenue, while vacuum and solid-insulated systems are posting a robust 12.55% CAGR, significantly outpacing the growth rate of the United States switchgear market. Environmental policies targeting SF₆ and land-use limits in urban substations lead utilities to favor compact, sealed, and maintenance-light gear that also offers higher internal-arc ratings.
The United States switchgear market size tied to "other insulation" is expected to rise as ABB's AirPlus and Siemens' clean-air platforms gain 17 state qualifications by 2027, accelerating replacement cycles across wildfire-prone California feeders. ABB's decision to open intellectual property access to AirPlus expedites cross-industry learning curves and reduces OEM risk premiums, further eroding AIS's market share.
By Current Type: DC Growth Accelerates with Storage Integration
Alternating-current offerings held 79.86% of the value in 2025, but direct-current lines registered a 5.61% CAGR, thanks to utility-scale batteries and data-center 48-V backbones. California and Texas together represent nearly 80% of new battery-energy-storage capacity, and each installation incorporates DC disconnects, solid-state fuses, and fast-acting contactors tailored for bidirectional power flow.
As energy-storage portfolios exceed 10 GW by 2026, the United States switchgear market size dedicated to DC architectures will crest USD 1.97 billion, reflecting both balance-of-plant equipment for storage farms and indoor DC panels inside hyperscale computing halls. Growth is further stoked by federal manufacturing tax credits under Section 45X, which reimburse up to USD 0.07 per watt for domestically produced storage inverters that often embed DC switchgear bays.
By Installation: Outdoor Growth Driven by Resilience Initiatives
Indoor gear represented 75.05% of the revenue in 2025, but outdoor assemblies grew at a 7.22% CAGR, driven by wildfire, hurricane, and flood-hardening mandates. PG&E will underground 10,000 distribution miles using pad-mounted switchgear rated IP68 and capable of submersion for 72 hours without loss of dielectric integrity.
Florida utilities are following suit to meet Public Service Commission rules requiring hardened feeders in coastal counties, buying stainless-steel outdoor switchgear that withstands 200 mph wind loads and 15 psf missile impact. As a result, the outdoor slice of the United States switchgear market share is expected to rise by at least 2.85 percentage points by 2031, particularly in states offering resilience performance incentives under GRIP grants.
By End User: Utilities Lead Both Size and Growth
Utilities consumed 34.21% of 2025 shipments and are expected to grow at a 5.18% CAGR, reflecting unparalleled public funding streams and performance-based ratemaking that rewards resilience metrics. The United States switchgear market size attributable to utilities is expected to surpass USD 8.6 billion by 2031, as operators replace legacy oil breakers and automate feeders to reduce the System Average Interruption Duration Index (SAIDI) to below 100 minutes.
Commercial and industrial customers rise more modestly but benefit indirectly when utilities incorporate 15-kV metal-clad switchgear with dual-source transfer at campus-level substations, a configuration popular in semiconductor fabs and AI data-centers. Meanwhile, residential demand is filtered through community-solar tie-ins that require UL 1558-listed meter-main combinations equipped with arc-flash relays, although this remains a niche market.
Geography Analysis
California leads the adoption of SF₆-free and solid-insulated gear, driven by the state's strict Air Resources Board leak regulations and the nation's largest backlog of renewable projects under CAISO's queue management reforms. Medium-voltage switchgear orders are closely tied to wildfire-mitigation budgets, with totals exceeding USD 1.8 billion for underground sectionalizers and reclosers from 2025 to 2027. Texas ranks second, driven by ERCOT's open-access market design and a wave of data center megaprojects along the I-35 corridor, which translates to high-voltage GIS installations sized for 450 MVA banked transformer primaries.
Virginia maintains the single largest demand node thanks to "Data-Center Alley," where Loudoun County alone added 1.8 GW of critical IT load in 2024, each megawatt requiring roughly USD 250,000 in medium-voltage switchgear, elevating the United States switchgear market share for the Mid-Atlantic from 12.08% in 2025 to an expected 13.67% by 2031. The Northeast grapples with aging 69-kV rings that date to the 1970s; replacement projects in ISO-New England jurisdictions favor modular GIS kiosks to avoid downtown footprint constraints. The Southeast benefits from industrial relocations and record-high utility-scale solar deployments, channeling orders toward 34.5-kV outdoor metal-enclosed switchgear rated for 60 °C ambient operation in humidity-rich climates. Meanwhile, Midwestern utilities focus on resilience retrofits, adding arc-resistant indoor lineups in areas prone to tornadoes. Rocky Mountain states exhibit slower uptake linked to lower load growth, but will order specialized high-altitude breakers with derated dielectric clearances.
Regulatory Landscape
Switchgear design and installation in the United States are governed by a mix of consensus standards and mandatory codes. Key anchors include the IEEE C37 series for switchgear and high-voltage circuit breakers, NFPA 70 (National Electrical Code) and NFPA 70E for installation practices covering overcurrent protection and arc-flash safety, and product safety certifications such as UL 1558 and UL 891 for commercial and industrial switchgear. For DC applications linked to solar and other renewables, NEC Article 690 and UL 489B are commonly referenced.
These requirements shape equipment specifications, including arc-resistant construction, protection and interlocking schemes, labeling, and commissioning tests, and they influence vendor qualification and acceptance testing workflows. Environmental and domestic-content policies also affect technology choices and sourcing for grid projects. New York’s 6 NYCRR Part 495 begins phasing out SF6 in January 2026, reinforcing the shift toward SF6-free and alternative-insulation platforms for utilities and large commercial users, alongside other state actions such as California leakage-reduction mandates. For federally supported grid modernization, Build America, Buy America Act requirements for iron, steel, and manufactured products affect procurement structures and supplier localization strategies, especially for switchgear used in IIJA- and IRA-funded programs.
Competitive Landscape
Market concentration remains moderate. Schneider Electric, ABB, Siemens Energy, GE Vernova, and Hitachi Energy together controlled roughly 48% of 2024 shipments, leaving ample share for regional manufacturers and specialized GIS suppliers. Tariff-driven cost shocks provided incumbents with an incentive to localize. Schneider is investing USD 700 million in seven U.S. plants through 2027, creating 1,000 jobs and increasing annual medium-voltage panel capacity by 25%. ABB’s USD 120 million two-state expansion targets low-voltage products for data-center use, while Hitachi Energy’s USD 60 million upgrade doubles 245-kV breaker output in Pennsylvania.
Technology rivalry centers on SF₆-free innovations. GE Vernova’s g³ line secured Department-of-Energy backing to commercialize 420-kV dead-tank breakers, while ABB’s AirPlus formula is now open-sourced to speed cross-industry adoption. Siemens Energy acquired Trayer Engineering to secure hermetically sealed outdoor gear suited to coastal floodplains, complementing its “Blue” clean-air portfolio. Private-equity groups also see value; for example, Quanta Services has integrated several regional panel-build shops into its utility-solutions platform to secure EPC contracts that often come bundled with switchgear procurement.
Supply-chain resilience remains a differentiator. Steel and aluminum tariffs at 50% spurred OEMs to build domestic fabrication lines; Schneider’s Mt. Juliet, Tennessee facility takes sheet-steel coil to finished enclosure in four days, trimming logistics cost by 18%. Lead times, although still elevated at 26–32 weeks compared to the pre-pandemic range of 12–16 weeks, are shortening for vendors that vertically integrate bus-bar machining and powder coating. OEMs without local casting capacity face margin pressure, nudging them to partner with foundries in Alabama and Ohio under long-term contracts amortized over GRIP-funded project pipelines.
United States Switchgear Industry Leaders
ABB Ltd.
Siemens AG
General Electric Company
Schneider Electric SE
Eaton Corporation plc
- *Disclaimer: Major Players sorted in no particular order

Market Opportunities and Future Outlook
SF6 phase-down rules, utility resilience programs, and large-load interconnections are creating whitespace for SF6-free, compact, and digitally enabled medium- and high-voltage switchgear in U.S. substations and large campuses. New York’s SF6 rulemaking that starts in January 2026 supports replacement activity and specification rewrites toward alternative-insulation technologies, while hyperscale data centers migrating to medium-voltage distribution (supported by higher rack power densities) are favoring compact lineups and integrated power distribution solutions to reduce footprint and improve maintainability.
A second opportunity is tied to domestic manufacturing localization and lead-time risk reduction, supported by multiple capacity commitments aimed at U.S. electrification and grid markets. ABB announced a USD 110 million U.S. manufacturing investment with electrification capacity expansions coming online in 2026, Siemens and Jabil are opening a 300,000-square-foot facility in Prince George County, Virginia, for medium-voltage switchgear with production starting in fall 2026, and Eaton announced a new 370,000-square-foot medium-voltage switchgear facility in Bellevue, Nebraska, backed by an investment of more than USD 30 million. These projects expand the pool of U.S.-built switchgear options for Buy America-aligned programs and help utilities, EPCs, and data-center operators manage tightening procurement cycles.
Recent Industry Developments
- July 2026: Siemens AG announced a 300 million Euro investment to expand its switchgear production capacity in Frankfurt and to establish a new supplier facility in Offenbach, with construction starting in July 2026. The expansion strengthens the German supply chain and accelerates SF6-free switchgear adoption for utilities and data centers.
- July 2026: Siemens Energy held a groundbreaking ceremony for its new 300 million USD high-voltage switchgear manufacturing facility in Pearl, Mississippi. The project expands US HV switchgear capacity and reinforces proximity to grid modernization demand.
- February 2026: Siemens Energy announced a 1 billion USD investment in United States manufacturing operations, including plans to build a new high-voltage switchgear plant in Mississippi and expand existing sites in North Carolina, Alabama, New York, Texas, and Florida. The investment strengthens domestic production, supports regional supply chains and potential SF6-free tech deployment.


Research Methodology Framework and Report Scope
Market Definition and Coverage
For this report, the market covers factory-gate revenues earned from switchgear equipment sold for power distribution and protection across the United States, counted in USD for the study period.
Scope exclusions: We exclude downstream EPC labor, civil works, ongoing maintenance services, and unrelated distribution hardware that is not part of switchgear assemblies.
Segmentation Overview
- By Voltage
- Low Voltage
- Medium Voltage
- High Voltage
- By Insulation
- Gas Insulated Switchgear (GIS)
- Air Insulated Switchgear (AIS)
- Others
- By Current Type
- AC Switchgear
- DC Switchgear
- By Installation
- Indoor
- Outdoor
- By End-User
- Utilities
- Residential
- Commercial
- Industrial
Data Sources, Market Sizing, and Validation
Desk Research
Desk research started with public electrical demand and grid build signals, because those are the clearest "pull" indicators for switchgear. We referenced sources such as the U.S. Energy Information Administration (EIA) for power generation and consumption trends, the U.S. Census Bureau for construction and manufacturing activity, and the U.S. International Trade Commission (USITC) for tariff and trade category context.
We also used sources such as the Federal Energy Regulatory Commission (FERC) for transmission and interconnection related filings, and the U.S. Bureau of Labor Statistics (BLS) for price and cost trend checks that support realistic ASP movement over time. Company filings, investor presentations, reputable press coverage, and association publications were used to align product boundary language with how the industry reports revenues. Paid subscriptions that support company financials and intelligence, patent databases, and shipment level import and export views were used selectively to validate gaps that public sources do not resolve. These examples are not exhaustive, and many other public and paid sources were also referenced for data collection, validation, and clarification.
Primary Interviews and Surveys
Primary work was done through expert interviews and structured surveys with utility procurement and engineering teams, industrial and commercial facility stakeholders, and channel side participants involved in switchgear specification and purchase decisions. Inputs were used to confirm typical replacement cycles, voltage mix shifts, indoor versus outdoor preferences, and how buyers treat GIS versus AIS tradeoffs, and then to pressure test the assumptions built from desk research across major US regions.
Distribution of primary research fieldwork respondents
| Company type | Respondent position |
|---|---|
| Top tier: 26% | CXOs: 12% |
| Mid tier: 60% | Functional/Unit leaders: 38% |
| Smaller Players: 14% | Managers: 50% |
Market-Sizing & Forecasting
Sizing was built using a top-down model that starts from the US electricity and grid investment demand pool and then reconstructs equipment spend into switchgear, followed by a split using observed product and end-user adoption patterns. To keep the totals realistic, the output was then corroborated with selective bottom-up approximations, including sampled ASP times volume checks by voltage class and installation type, plus channel feedback on project mix.
Key inputs that shaped the model included utility T and D upgrade intensity, construction activity for commercial and industrial buildings, the installed base replacement rhythm for aging switchgear, the mix shift across low, medium, and high voltage needs, and the share movement between gas insulated and air insulated systems. Where direct volume indicators were patchy, we used ranges agreed with interviewees and then constrained them using trade classification directionality and price trend checks. Forecasts were built using scenario analysis, because grid expansion timing and large project award cycles can swing near-term demand, and the scenario weights were refined using primary feedback on backlog visibility and procurement lead times.
Data Validation & Update Cycle
Results are triangulated across independent signals so one data series does not dominate the outcome. We run variance checks across end-user splits, voltage mix, and implied ASP movements, and then review any outliers against project news flow and trade and price indicators.
Before sign-off, the model goes through multi-step analyst review, and follow-up calls are triggered when interview feedback conflicts with the desk view or when large gaps appear versus observable demand signals. Reports are refreshed annually, and interim updates are made when material events occur. Before delivery, an analyst performs a fresh pass so clients receive the latest updated view.
Mordor Intelligence's United States Switchgear Market Size Versus Other Published Estimates
Published estimates for US switchgear can look far apart because the market boundary is not always handled the same way, and the year labels and pricing logic are often applied differently. Differences also show up when one source blends switchgear with adjacent switchboard or panelboard revenue, or when services and installation are counted inside equipment totals.
Utility capital spending signals, construction activity direction, and voltage level demand patterns are used as checks that anchor Mordor Intelligence's estimate to actual equipment purchasing in the United States, instead of broader electrical distribution baskets. When those evidence points are not used, scope can expand quietly into related gear, and forecast paths can get pulled by aggressive price uplift assumptions that do not match buyer feedback.
Benchmark comparison
| Source | Market Size | Gaps in Research Methodology |
|---|---|---|
| Mordor Intelligence | USD 17.31 B (2025) | |
| Regional Consultancy A | USD 15.90 B (2025) | Uses a narrower equipment list that leans toward utility medium voltage orders and omits a portion of commercial and residential low voltage demand, which reduces the implied installed-base replacement contribution. |
| Trade Journal B | USD 20.40 B (2025) | Blends switchgear with adjacent switchboards and some electrical distribution assemblies, and applies faster ASP escalation without fully reconciling it to labor and materials price trend checks and buyer procurement timing. |
Across the three figures, the spread is mainly explained by what each source counts as "switchgear" and how pricing over the base year is treated. By keeping the scope tied to equipment-only revenues and validating splits through repeatable demand signals and interview checks, the resulting number stays transparent and easier to audit year to year.


Key Questions Answered in the Report
How large is the United States switchgear market in 2026?
It is valued at USD 18.12 billion in 2026 and is projected to reach USD 22.79 billion by 2031.
What CAGR is expected for U.S. switchgear through 2031?
The forecast compound annual growth rate stands at 4.69% for the 2026–2031 period.
Which voltage class is growing fastest?
High-voltage equipment leads with a 6.54% CAGR as utilities build new transmission lines.
Why is outdoor switchgear demand rising?
Utilities are hardening grids against wildfires, hurricanes, and floods, pushing outdoor systems at a 7.22% CAGR.
How are SF₆ regulations influencing technology choices?
State bans starting in 2026 are moving buyers toward vacuum, solid-insulated, and clean-air designs that eliminate SF₆.
Which states generate the most switchgear demand from data centers?
Virginia tops the list, followed by Texas, California, and North Carolina due to hyperscale AI and cloud build-outs.
Page last updated on:


 Your data is secure and never sold or shared.


