
Market Overview
| Study Period | 2020 - 2031 |
|---|---|
| Forecast Data Period | 2026 - 2031 |
| Base Year Market Size (2025) | USD 85.45 Billion |
| Market Size (2026) | USD 92.67 Billion |
| Market Size (2031) | USD 139.03 Billion |
| Growth Rate (2026 - 2031) | 8.45 % |
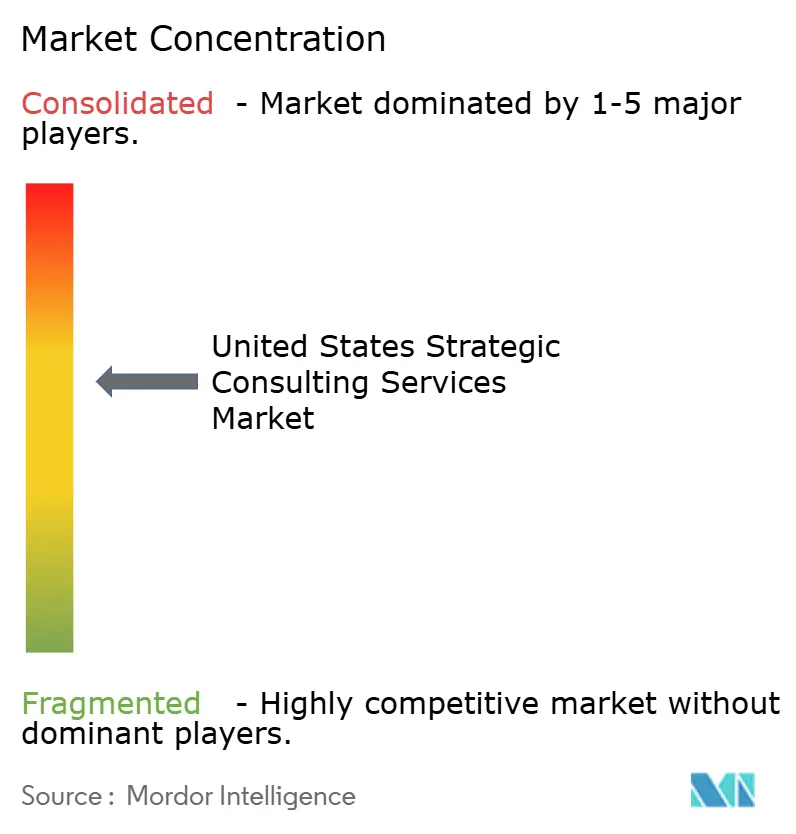
| Market Concentration | Medium |
Major Players *Disclaimer: Major Players sorted in no particular order Image © Mordor Intelligence. Reuse requires attribution under CC BY 4.0. | |
United States Strategic Consulting Services Market Analysis by Mordor Intelligence
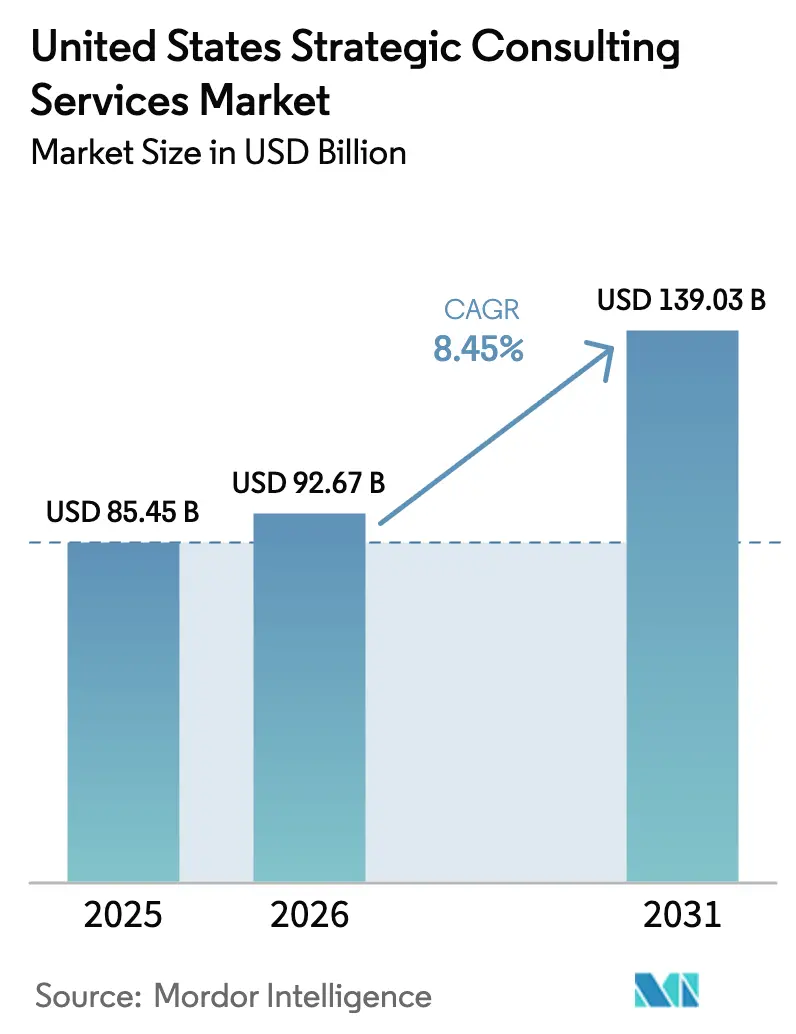
The United States strategic consulting services market size is expected to grow from USD 85.45 billion in 2025 to USD 92.67 billion in 2026 and is forecast to reach USD 139.03 billion by 2031 at 8.45% CAGR over 2026-2031. Growth is sustained as enterprises modernize mainframe-era processes, embed artificial intelligence in decision cycles, and tap external advisors to structure a record volume of mid-market mergers. A steady pipeline of regulatory mandates in banking, insurance, and healthcare guarantees continuous compliance-driven work, while large cloud-migration programs in technology, retail, and manufacturing deepen demand for cross-functional transformation expertise. Consulting providers that fuse strategy design with full-stack implementation secure more wallet share because clients now expect partners to deliver quantifiable value, not slide-deck recommendations. Competitive intensity is rising, yet new white space emerges for specialists that validate AI-generated roadmaps, orchestrate supply-chain reshoring, and steer companies through ESG and climate-disclosure obligations.
Key Report Takeaways
- By client industry, Banking, Financial Services, and Insurance captured 24.20% of the United States strategic consulting services market share in 2025, reflecting sustained regulatory activity and digital-banking transformation, while healthcare is forecast to expand at a 9.55% CAGR through 2031.
- By organization size, enterprises with revenue exceeding USD 1 billion held 62.85% of the 2025 United States strategic consulting services market size; small and medium enterprises are advancing at a 10.25% CAGR through 2031.
- By region, the Northeast generated the largest revenue of the United States strategic consulting services market in 2025, whereas the West is set to record the fastest growth at a double-digit pace through 2031.
Note: Market size and forecast figures in this report are generated using Mordor Intelligence’s proprietary estimation framework, updated with the latest available data and insights as of 2026.
Market Trends and Insights
Drivers Impact Analysis of United States Strategic Consulting Services Market*
| Driver | (~) % Impact on CAGR Forecast | Geographic Relevance | Impact Timeline |
|---|---|---|---|
| Intensifying digital-transformation mandates | +2.00% | National, strongest in the Northeast and the West | Medium term (2–4 years) |
| Record mid-market M&A wave | +1.70% | Nationwide, early gains in Northeast, South, West | Short term (≤ 2 years) |
| ESG and climate-disclosure compliance | +1.30% | Nationwide, high in Northeast and West Coast | Long term (≥ 4 years) |
| Healthcare value-based-care shift | +1.10% | Nationwide, notable in Northeast and Midwest | Medium term (2–4 years) |
| U.S. supply-chain reshoring incentives | +0.80% | Nationwide, focus on South and Midwest | Long term (≥ 4 years) |
| AI-generated-strategy validation demand | +1.50% | Nationwide, technology hubs in West | Short term (≤ 2 years) |
| Source: Mordor Intelligence | |||
Intensifying digital-transformation mandates
Eighty-five percent of chief executives accelerated digital agendas in the past 18 months, igniting the largest wave of cloud, data platform, and automation projects since 2020. McKinsey’s digital practice generated USD 16 billion in 2023 revenue, with 40% linked to AI consulting, underscoring how clients now view applied analytics as a competitive requirement [1]. Buyers routinely ask external advisors to benchmark technology ROI, calibrate cybersecurity controls, and sequence agile implementation waves that internal teams lack capacity to manage. Providers respond by launching multi-disciplinary AI studios, certifying tens of thousands of cloud engineers, and co-developing reference architectures with hyperscalers. Embedded teams typically remain on site for transformation sprints of 9–18 months, ensuring accountability for business-case realization.
Record mid-market M&A wave
Global M&A volume ended 2024 at USD 3.5 trillion despite tighter credit spreads [2]. More than half of completed U.S. transactions involved acquirers valued below USD 5 billion, a cohort keen on scale synergies, product adjacency, and geographic expansion. Bain expects one in three deal teams to adopt generative-AI diligence tools by 2025, cutting analysis cycles from weeks to days and shifting consultant effort toward scenario validation and integration readiness. Advisory firms expand regulatory benches, deploy industry-specific playbooks, and deepen post-merger integration toolkits that align operating models from Day One. Complex cross-border deals in energy and financial services command premium fees, rewarding specialists fluent in sanctions risk, geopolitical uncertainty, and climate-impact modeling.
ESG and climate-disclosure compliance
The Securities and Exchange Commission’s proposed climate-risk rule and the Centers for Medicare & Medicaid Services five-pillar health-equity framework impose rigorous data-collection, assurance, and attestation requirements. Corporations now seek consulting partners able to map materiality, quantify scope 3 emissions, and operationalize climate data inside finance and supply-chain systems. Firms have created ESG studios that blend auditors, environmental scientists, and software engineers who deploy proprietary dashboards that translate carbon baselines into investment decisions. Clients also rely on advisors to unlock sustainability-linked loan tranches whose interest rates decline when emissions targets are met, embedding consultants throughout treasury and capital-allocation workflows.
Healthcare value-based-care shift
Payment reform accelerates as federal and private payers tie reimbursement to outcomes, compelling providers to adopt predictive health analytics and redesign care coordination protocols. Consulting teams integrate clinicians, actuaries, and technologists who model risk adjustment, optimize episode pricing, and stand up digital-front-door capabilities. Updates to NCQA maternal health and behavioral-health measures in 2024 force hospitals to reconfigure quality dashboards and workforce incentives. Engagements typically span multiple budget cycles, with advisors returning each quarter to recalibrate metrics, ensuring recurring revenue and long-lived client relationships.
Restraints Impact Analysis of United States Strategic Consulting Services Market*
| Restraint | (~) % Impact on CAGR Forecast | Geographic Relevance | Impact Timeline |
|---|---|---|---|
| In-house strategy teams' expansion | −1.2% | Large-enterprise clusters nationwide | Medium term (2–4 years) |
| Fee pressure from procurement offices | −0.7% | Federal and Fortune 500 procurement centers | Short term (≤ 2 years) |
| Client distrust of GenAI's generic outputs | −0.5% | Regulated industries nationwide | Short term (≤ 2 years) |
| Antitrust scrutiny of audit–advisory mixes | −0.3% | Big-Four engagements in multiple sectors | Long term (≥ 4 years) |
| Source: Mordor Intelligence | |||
In-house strategy teams expansion
Currently, eighty-two percent of Fortune 500 companies have established internal consulting groups, demonstrating strong satisfaction with their ability to handle baseline analytical tasks. This trend has redirected routine operational work away from external consulting firms, compelling them to prioritize delivering objective insights and leveraging cross-sector benchmarking. External consultants are also focusing on offering specialized expertise that internal teams typically lack, ensuring their relevance in a competitive landscape. Furthermore, these firms are designing capability-building programs aimed at enhancing the skills of internal teams, thereby fostering long-term organizational growth. By adopting this approach, external consultants are strategically exchanging short-term revenue opportunities for sustained advisory roles within these corporations. This shift underscores the evolving dynamics between internal and external consulting functions in the corporate ecosystem.
Fee pressure from procurement offices
Private-sector sourcing groups are implementing structured approaches by issuing comprehensive rate cards, requesting shadow billing to ensure transparency, and mandating the use of value-tracking dashboards for performance monitoring. These measures aim to enhance accountability and optimize cost management. In response, firms are leveraging automation to streamline data collection processes, ensuring efficiency and accuracy in fact-gathering. Senior partners are being strategically redeployed to focus on high-value tasks, such as framing critical business strategies. Additionally, firms are aligning fee structures with milestone achievements to establish clear performance benchmarks. This approach fosters a results-driven environment while maintaining alignment with client expectations.
*Our forecasts treat driver/restraint impacts as directional, not additive. The impact forecasts reflect baseline growth, mix effects, and variable interactions.
United States Strategic Consulting Services Market Segment Analysis
By Client Industry:
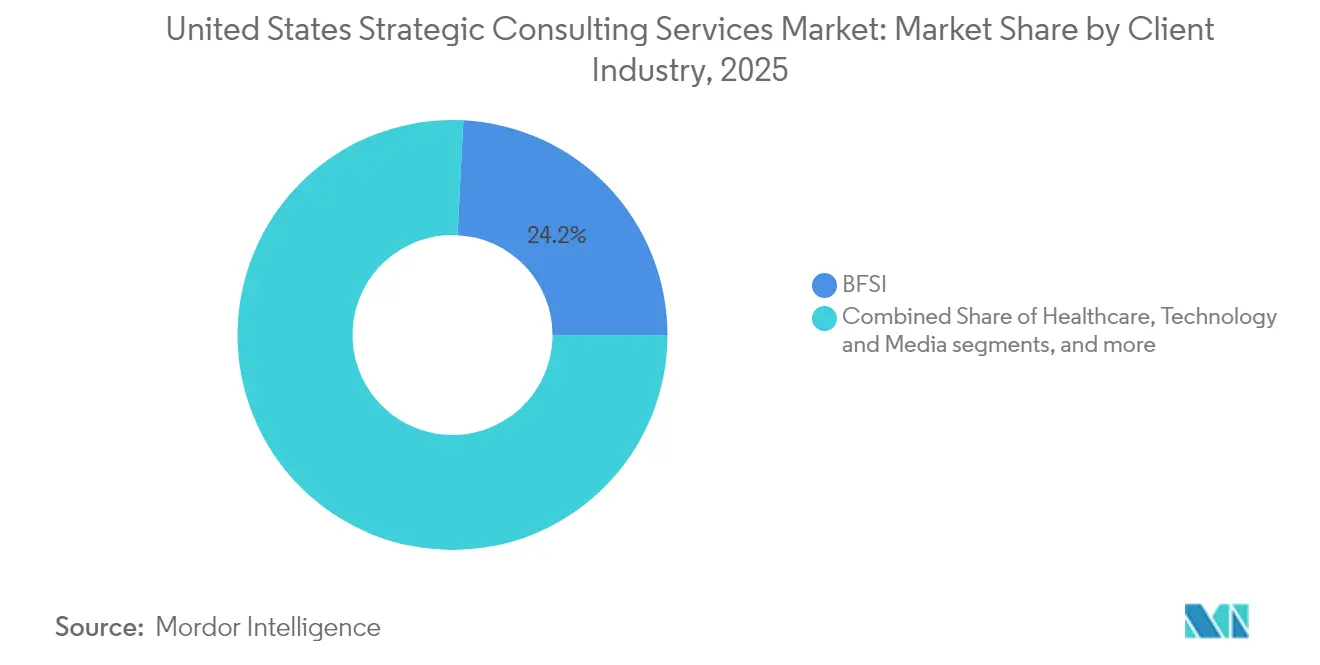
Healthcare accelerates digital transformationHealthcare generated the fastest revenue expansion, clocking a 9.55% CAGR through 2031 as providers overhaul care delivery and reimbursement models. The strategic consulting services market size associated with healthcare is positioned to double because hospitals employ population-health analytics, automate prior authorization, and embed ESG-compliance workflows. Banking, Financial Services, and Insurance retained the largest slice, contributing 24.20% strategic consulting services market share in 2025 as institutions navigate Basel III capital, combat real-time fraud, and re-platform core banking systems. Technology, energy, and consumer-retail clients add momentum, each propelled by AI integration, grid decarbonization, and omnichannel reinvention. Manufacturing and industrials lean on advisors for reshoring feasibility and smart-factory deployments that de-risk global supply shocks.
Consultants tailor delivery blueprints to each vertical. In hospitals, multidisciplinary squads merge clinicians with actuaries and data scientists to align value-based contracts with quality scores. Banks contract risk specialists to recalibrate capital planning and deploy AI credit-scoring engines. Utilities engage advisors to modernize transmission grids and model hydrogen-ready assets. Retailers retool last-mile logistics using computer-vision inventory audits that cut stock-outs twenty percent. Across industries, firms attach managed-services wrappers that sustain improvement and ensure compliance, embedding recurring revenue streams within the strategic consulting services industry.

By Organization Size:
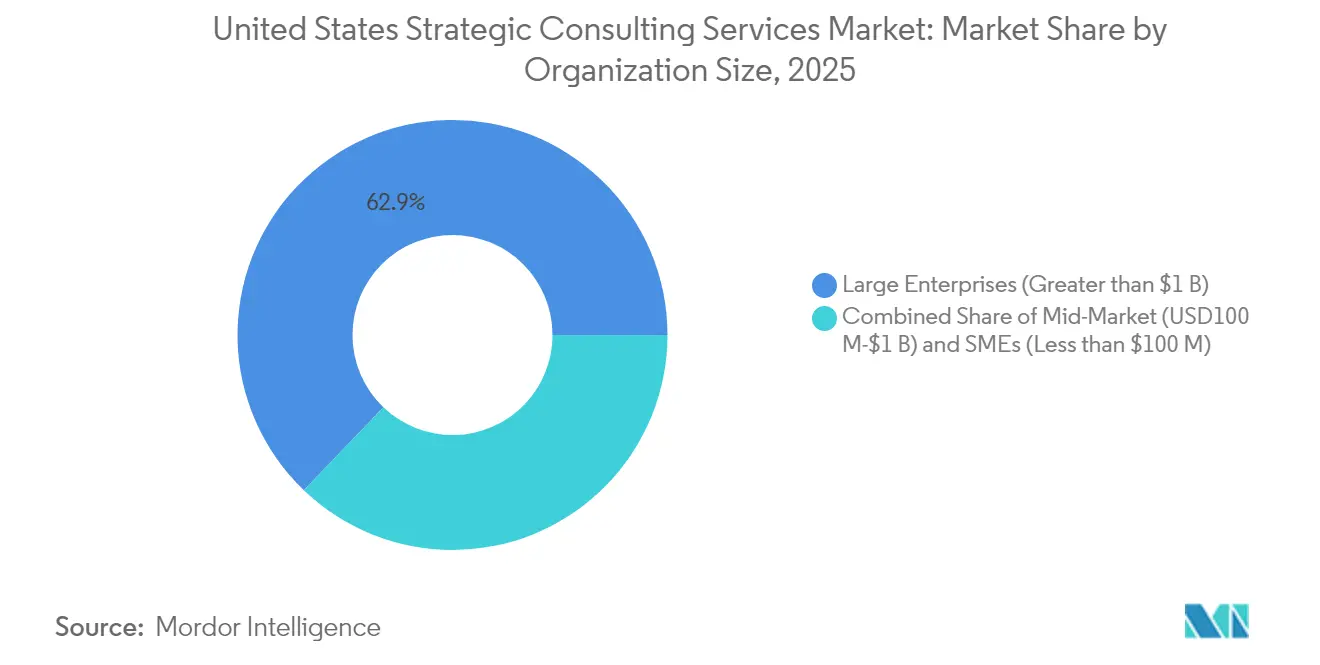
SMEs drive unexpected growthSmall and medium enterprises represent the fastest-growing client category, advancing consulting spend at a 10.25% CAGR through 2031. Their share remains smaller than large enterprises’ 62.85%, yet the aggregate revenue contribution from SMEs is no longer negligible. The underlying driver is an urgent need to bridge digital and regulatory capability gaps without building expensive internal departments. Mid-market companies between USD 100 million and USD 1 billion favor targeted engagements that bundle market-entry strategy with finance-function modernization.
Consultancies have responded by disaggregating classic three-phase methodologies into modular work packages that lower upfront fees. Digital delivery hubs leverage reusable code libraries, enabling SMEs to deploy dashboards and process automation in weeks, not months. Outcome-based pricing aligns fees with measurable metrics such as revenue lift or cost-to-serve reduction. Enterprise clients, by contrast, sign multi-year master service agreements covering end-to-end transformation, cybersecurity, and managed operations. This barbell demand pattern helps smooth revenue volatility and diversifies the strategic consulting services market.
Geography Analysis
The Northeast anchors the strategic consulting services market, benefiting from the confluence of Wall Street, global insurers, and leading academic medical centers. Clients there invest continuously in stress-testing frameworks, anti-money-laundering analytics, and precision-medicine commercialization, reinforcing premium fee rates. A rich ecosystem of policymakers and think tanks further elevates demand for scenario planning and regulatory navigation, making the region an indispensable revenue pillar.
The West posts the fastest volume expansion. Technology conglomerates headquartered in California and Washington accelerate investment in AI-native operating models, edge-computing architectures, and zero-trust cybersecurity frameworks. Venture capital funding surpasses USD 300 billion annually, seeding an ever-growing pool of high-growth start-ups that require product-market fit validation, pricing strategy, and international expansion roadmaps. Consulting firms embed multidisciplinary pods in San Francisco, Seattle, and Los Angeles to capture this momentum while exporting best practices to other regions.
The South capitalizes on an influx of advanced-manufacturing and renewable-energy projects. Texas leads utility-scale solar installations while Louisiana upgrades petrochemical complexes to meet low-carbon intensity targets. Advisors guide site selection, incentives negotiation, supply-chain recalibration, and environmental-impact mitigation. Florida’s insurance sector, grappling with climate-driven risk exposure, turns to consultants for scenario modeling and reinsurance-structure optimization. The Midwest, anchored by Detroit’s electric-vehicle transition and Chicago’s logistics network, sustains predictable demand for operational-excellence programs and supply-chain digital twins. Remote-first delivery models let coastal specialists plug capability gaps in smaller metros, balancing workforce utilization and client proximity.
Regulatory Landscape
Strategic consulting engagements in the United States operate under a mix of federal procurement rules, professional standards, and sector regulators that shape how firms scope work, manage independence, and evidence outcomes. For federal advisory and assistance services, conflict-of-interest requirements under 41 USC 2304 influence staffing, disclosures, and firewalls, particularly where providers also deliver technology implementation or assurance-adjacent services.
A near-term compliance driver is the fragmented, state-by-state approach to AI governance that affects consulting workflows and client deliverables. Examples include Texas TRAIGA and Illinois HB 3773 becoming effective January 1, 2026, Colorado CPAIA requiring risk-assessment actions with a June 30, 2026 deadline, and Oregon HB 4154 taking effect in March 2026. These measures increase demand for AI inventories, vendor oversight, and documentation practices that advisory teams increasingly incorporate into operating-model, HR, and digital-transformation programs. Professional guidance such as AICPA Statement on Standards for Consulting Services No. 1 also reinforces expectations around documentation, objectivity, and client responsibility boundaries for CPAs delivering consulting services, which are commonly cited in regulated-industry engagements.
Value Chain Analysis
The United States strategic consulting services value chain spans upstream talent, standards, and data or tooling inputs, through client acquisition, diagnostic and solution design, and downstream implementation and managed support. Firms build differentiated capability through recruitment and training pipelines, proprietary methods and assets (benchmarks, playbooks, GenAI copilots), and partner ecosystems with hyperscalers and enterprise software vendors. Delivery typically follows a pyramid staffing model, with partners and directors steering workstreams supported by managers, consultants, and analysts to balance specialization with billing efficiency.
Go-to-market is influenced by provider archetypes. Strategy-led firms such as McKinsey, BCG, and Bain emphasize independent advisory, diligence, and operating-model design. Big Four organizations such as Deloitte, EY, KPMG, and PwC link strategy to technology implementation, tax, and risk services, which supports cross-selling while also increasing independence and conflict-management requirements in certain engagements. Quality and credibility are reinforced by professionalization mechanisms such as IMC USA's Certified Management Consultant (CMC) designation (ISO/IEC 17024:2003 accredited), which standardizes consulting competencies and ethics, and can support procurement qualification for regulated or public-sector buyers.
Competitive Landscape
In 2024, the top five consultancies accounted for half of the market revenue, indicating a moderately consolidated market structure with room for competition. These firms benefit from scale-driven advantages, including strong brand equity, extensive global delivery networks, and strategic multi-cloud partnerships that simplify client implementation processes. Their dominance is further reinforced by significant investments in generative AI technologies aimed at enhancing operational efficiency and client outcomes. Specifically, these consultancies have established proprietary generative AI copilots designed to accelerate the discovery process and automate initial analytical tasks. Such innovations enable these market leaders to reduce project timelines and deliver value more effectively. This strategic focus on technology adoption positions them to maintain a competitive edge in a dynamic and evolving market environment.
Mid-tier specialists exploit white space by focusing on emerging themes such as AI ethics audit, carbon-accounting automation, and geopolitical scenario planning. Boston Consulting Group’s Center for Geopolitics exemplifies this niche strategy, providing clients with supply-chain contagion maps and sanctions-risk dashboards. Baker Tilly’s USD 7 billion merger with Moss Adams signals ongoing consolidation aimed at building scale in the middle market [3].
Strategic alliances redefine service delivery. PwC’s Agents Factory with Microsoft packages domain-specific AI agents that automate month-end close and capital-planning scenarios. McKinsey’s partnership with C3 AI embeds SaaS analytics inside transformation blueprints for energy and financial services clients. Heightened antitrust scrutiny on audit-advisory mixes nudges some clients toward pure-play consultancies, encouraging market entrants to emphasize independence. Procurement-driven cost discipline pressures margins, motivating providers to automate internal processes and adopt hybrid-work schedules that reduce overhead without sacrificing expertise.
United States Strategic Consulting Services Industry Leaders
-
McKinsey & Company
-
Deloitte
-
Boston Consulting Group
-
Accenture Strategy
-
Bain & Company
- *Disclaimer: Major Players sorted in no particular order
United States Strategic Consulting Services Market Companies Covered in this Report
- Accenture
- Deloitte
- McKinsey & Company
- Boston Consulting Group
- Bain & Company
- PwC
- EY
- KPMG
- IBM Consulting
- Strategy& (PwC)
- Oliver Wyman
- Booz Allen Hamilton
- Alvarez & Marsal
- L.E.K. Consulting
- Roland Berger
- Kearney
- Capgemini Invent
- EY-Parthenon
- West Monroe
- FTI Consulting
Read Analysis of United States Strategic Consulting Services Companies
Market Opportunities and Future Outlook
State-level AI compliance creates a clear services wedge for consultants that can operationalize governance across multi-state footprints, moving beyond policy writing into inventories of automated decision systems, high-risk use-case assessments, and vendor oversight embedded in procurement and SDLC controls. The 2026 effective dates and deadlines referenced in statutes such as Texas TRAIGA (effective January 1, 2026), Illinois HB 3773 (effective January 1, 2026), Colorado CPAIA (deadline June 30, 2026), and Oregon HB 4154 (effective March 2026) provide near-term triggers for advisory demand, especially where clients already run AI-enabled customer decisions, underwriting, fraud detection, or workforce screening.
Another whitespace area is strategy-to-execution delivery that compresses time-to-value for finance, risk, and ERP-heavy transformations, aligning with the broader shift toward measurable outcomes instead of slide-deck recommendations. Buyer appetite for accelerated, platform-led delivery is visible in recent programs, including Accenture completing a financial data and insights platform for INFRONEER in three months alongside rapid SAP Cloud ERP deployment, and PwC and Microsoft introducing an Agents Factory to deploy domain-specific AI agents for reconciliation and scenario planning. As procurement offices tighten rate cards and require value tracking, modular offerings and outcome-linked pricing expand addressable mid-market work where clients want bounded engagements that still include implementation, controls, and change management.
Recent Industry Developments in United States Strategic Consulting Services Market
- June 2026: Accenture delivered a new financial data and insights platform for INFRONEER Holdings Inc. in three months, enabled by rapid SAP Cloud ERP deployment. The launch enhances Accenture's enterprise analytics capabilities and accelerates value delivery for large finance transformation programs. It strengthens end-to-end transformation capability for ERP-heavy clients and accelerates time-to-value for large-scale finance tech programs.
- May 2026: Accenture announced a strategic collaboration with HUMAIN (owned by Saudi PIF) to accelerate AI adoption across public and private sectors. The partnership expands Accenture's government and enterprise AI footprint and access to large-scale public-sector opportunities. It broadens Accenture’s government and enterprise AI footprint and access to large-scale public-sector opportunities.
- May 2026: Bain & Company invested in the newly launched OpenAI Deployment Company. The investment provides Bain with an equity stake in an AI deployment capability for large-scale transformations. It bolsters Bain’s capabilities in production-grade AI deployments and accelerates client-ready AI roadmaps.
United States Strategic Consulting Services Market Report Scope and Research Methodology
Market Definition and Coverage
This market covers revenues earned from strategic consulting engagements delivered to clients in the United States, where the work is focused on enterprise direction, growth choices, business model decisions, and major transformation roadmaps.
Scope exclusions: We exclude internal corporate strategy teams and purely internal labor costs. We also exclude services that are fully outsourced execution with no advisory component.
Segments Covered in This Report
- By Client Industry (Value)
- Healthcare
- BFSI
- Technology & Media
- Energy & Utilities
- Consumer & Retail
- Manufacturing & Industrials
- Government & Public Sector
- By Organization Size (Value)
- Large Enterprises (Less than $1 B)
- Mid-Market (USD100 M–$1 B)
- SMEs (Greater than $100 M)
- By U.S. Region (Value)
- Northeast
- Midwest
- South
- West
Data Sources, Market Sizing, and Validation
Desk Research
Desk research was used to build the basic demand picture for strategy work in the United States, before we tested it against what firms and buyers were seeing on the ground. We leaned on public indicators that reflect where large decision-making programs are happening, such as macro output and industry activity, and then tied them to typical consulting spend patterns.
Sources used included items such as U.S. Bureau of Economic Analysis data, U.S. Bureau of Labor Statistics employment and wage series, U.S. Census Bureau business counts, SEC filings and annual reports for publicly listed consultancies, and Federal Reserve releases that signal investment cycles. We also referenced association and institute publications (management and consulting focused bodies), reputed business press coverage, and selective paid subscriptions for company financials and news context. When tracking advisory demand linked to AI governance and analytics, we also used patent databases. The sources listed here are not exhaustive, and many additional public and internal references were used to collect data, validate assumptions, and clarify open questions.
Primary Interviews and Surveys
Primary work focused on validating what buyers actually purchased as strategy consulting, and how budgets were being shifted across growth, cost, digital, risk, and operating model topics. We spoke with consulting delivery leaders, practice heads, client strategy owners, and procurement or finance stakeholders. This set of interviews helped reconcile utilization trends, pricing behavior, and how large multi-quarter programs affect spending across different regions in the United States.
Distribution of primary research fieldwork respondents
| Company type | Respondent position |
|---|---|
| Top tier: 31% | CXOs: 14% |
| Mid tier: 51% | Functional/Unit leaders: 30% |
| Smaller Players: 18% | Managers: 56% |
Market-Sizing & Forecasting
The market model starts with a top-down build where US consulting demand is reconstructed from broad professional services activity, addressable client spend pools, and observed consulting intensity by major end user industries. That view is then checked using selective bottom-up approximations, such as sampled revenue disclosures, channel checks on project mix, and an ASP times volume sanity check using typical engagement sizes and delivery team footprints.
To keep the sizing grounded, we used a set of practical inputs that can be repeatedly updated, including US enterprise IT and transformation spending signals, M&A and restructuring activity levels, regulation-driven advisory intensity in sectors like BFSI and healthcare, utilization and hiring momentum for management consulting roles, and pricing direction for senior advisory time (often reflected through billing rate movement and project duration). When gaps show up in bottom-up checks, they are handled by expanding the sample set, adjusting for delivery location mix, and applying conservative ranges for unreported private revenue based on peer patterns.
For forecasting, scenario analysis was used because strategy consulting demand swings with business confidence and investment cycles. The scenarios were anchored on input ranges validated through expert conversations. The forecast path was then smoothed to avoid one-time spikes becoming permanent assumptions, and it was further aligned to expected multi-year programs that clients indicated were already budgeted.
Data Validation & Update Cycle
Outputs were validated through triangulation across independent signals, including macro indicators, labor market data for consulting roles, and revenue trend direction from relevant company disclosures. Variance checks were run across years and across client industries, and any outliers were reviewed until a clear reason was found, such as a one-time M&A cycle, a regulatory deadline, or a pricing shift.
Before sign-off, the model and assumptions go through multiple analyst reviews, and respondents are re-contacted when new data creates a visible mismatch in utilization, pricing, or industry demand signals. Reports are refreshed annually, and interim updates are made when material events occur that can move buyer budgets or delivery capacity. Right before delivery, a final pass is completed so clients receive the latest updated view.
Mordor Intelligence's United States Strategic Consulting Services Market Size Versus Other Published Estimates
Published market values for US strategic consulting services can look far apart because the boundary of what counts as strategy work is not consistent. Some estimates are built from supply-side rollups, while others start from buyer spend pools. Differences also come from when revenue is recognized, how hybrid strategy plus implementation programs are treated, and which year is used as the base.
By tracking service line boundaries, refreshing pricing and utilization assumptions, and validating them with interview feedback, Mordor Intelligence keeps the estimate focused on revenue that is truly strategic consulting in the United States rather than broader management consulting bundles. Some published totals can move up if they fold in large scale implementation delivery, or they can move down if they only count pure boardroom strategy projects and exclude adjacent transformation advisory.
Benchmark comparison
| Source | Market Size | Gaps in Research Methodology |
|---|---|---|
| Mordor Intelligence | USD 85.45 B (2025) | |
| Industry Report Publisher A | USD 78.00 B (2024) | Uses an earlier base year and appears to apply a narrower definition that can undercount multi workstream strategy programs that include operating model and transformation roadmaps. |
| Press Release Summary B | USD 59.03 B (2024) | Tracks a broader management consulting bucket but the disclosed 2024 value suggests partial coverage, which may exclude large enterprise strategy mandates and large multi year engagements booked across industries. |
The spread mainly comes down to scope choices and timing, not math errors. The most useful comparison is made only after aligning what services are included and which year is being measured. When the same boundaries, pricing logic, and demand signals are applied consistently, the market size becomes easier to trace back to clear drivers and to update year after year.
Key Questions Answered in the Report
What is the projected size of the United States strategic consulting services market by 2031?
The strategic consulting services market size is forecast to reach USD 139.03 billion by 2031 at an 8.45% CAGR.
Which industry segment contributes the largest revenue today?
Banking, Financial Services, and Insurance leads with 24.20% of 2025 revenue as institutions tackle regulatory and digital-banking priorities.
Why is healthcare consulting growing faster than other segments?
Healthcare posts a 9.55% CAGR because providers must adapt to value-based reimbursement, comply with health-equity mandates, and modernize digital infrastructure.
How concentrated is the competitive landscape?
The market is moderately concentrated: the five largest consultancies command half of the share, but numerous mid-tier and specialist firms remain competitive.
What factors are driving demand for AI-related advisory services?
Enterprises generate strategic options with large-language models but rely on consultants to validate feasibility, manage risk, and ensure regulatory compliance, fueling AI-strategy validation engagements.
How are small and medium enterprises shaping market growth?
SMEs drive a 10.25% CAGR in consulting spend as modular, cloud-enabled service packages make high-quality advisory support accessible at smaller budgets.