
Market Overview
| Study Period | 2021 - 2031 |
|---|---|
| Forecast Data Period | 2026 - 2031 |
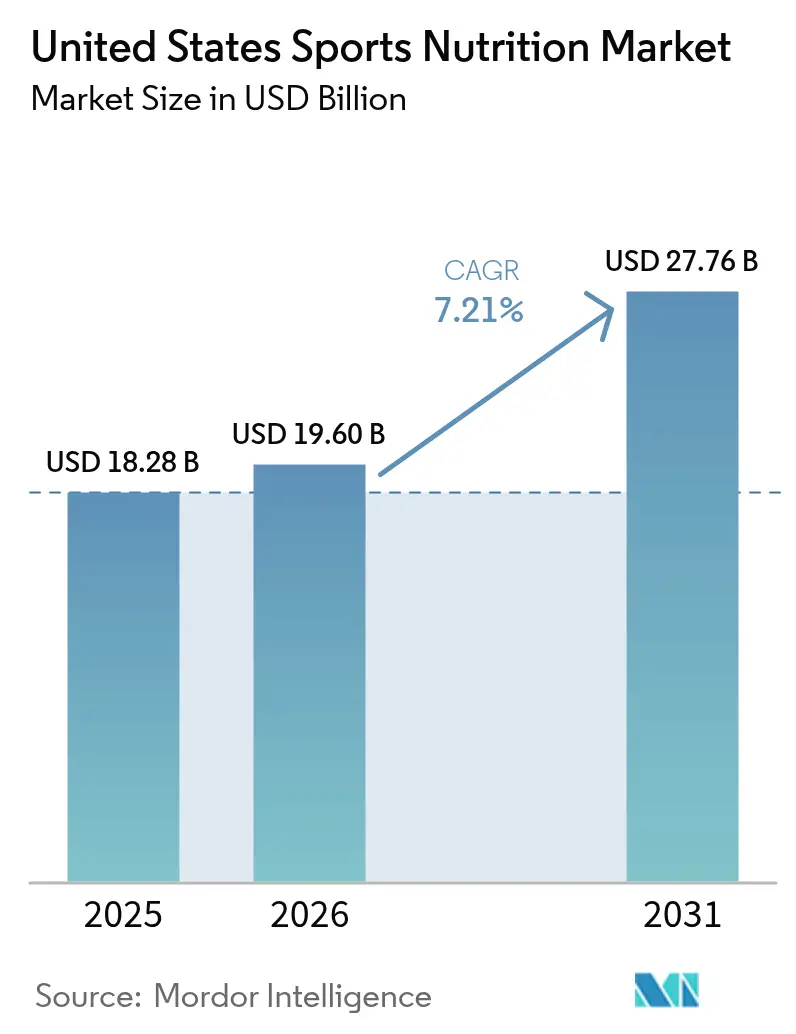
| Base Year Market Size (2025) | USD 18.28 Billion |
| Market Size (2026) | USD 19.6 Billion |
| Market Size (2031) | USD 27.76 Billion |
| Growth Rate (2026 - 2031) | 7.21 % |
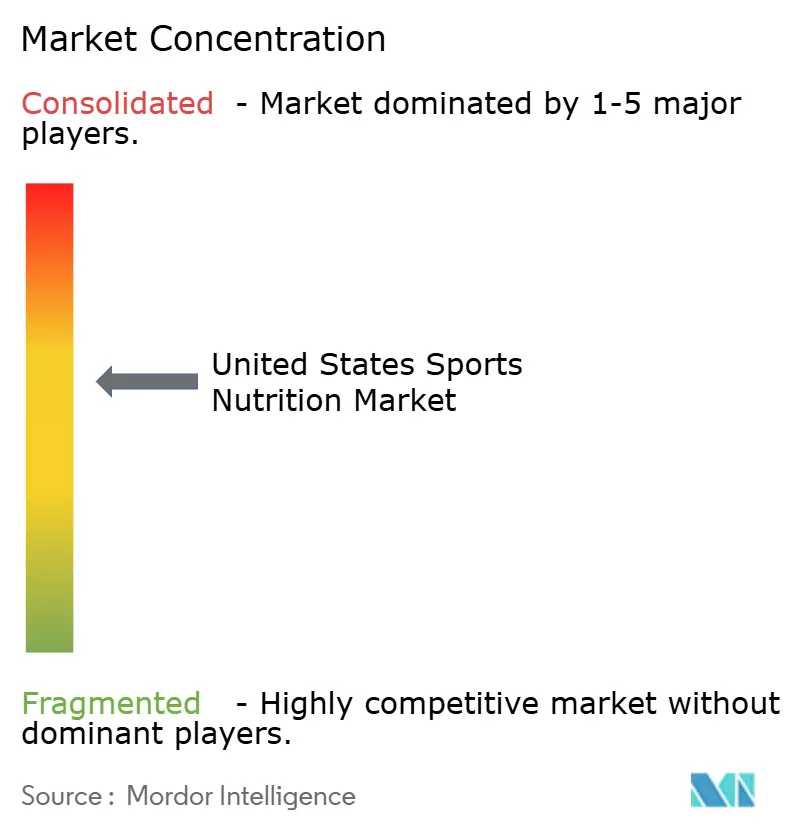
| Market Concentration | Medium |
Major Players *Disclaimer: Major Players sorted in no particular order Image © Mordor Intelligence. Reuse requires attribution under CC BY 4.0. | |
United States Sports Nutrition Market Analysis by Mordor Intelligence
The United States sports nutrition market size was valued at USD 18.28 billion in 2025 and estimated to grow from USD 19.6 billion in 2026 to reach USD 27.76 billion by 2031, at a CAGR of 7.21% during the forecast period (2026-2031). While athletes and bodybuilders remain core consumers, the market has expanded significantly to include recreational users, weekend warriors, and lifestyle enthusiasts, driven by increased health awareness and rising disposable income. This evolution from a niche athletic segment to a mainstream wellness category is supported by the democratization of fitness culture, digital health integration, and regulatory modernization across key markets. The growth is further amplified by the increasing number of health and fitness centers that actively promote sports nutrition products to their members. The market's transformation reflects a broader shift in consumer preferences toward sustainable nutrition, indicating that traditional users alone cannot sustain the market's growth trajectory. As the industry continues to evolve, manufacturers must adapt their product offerings and marketing strategies to meet the diverse needs of this expanding consumer base while maintaining high quality and safety standards.
Key Report Takeaways
- By product type, protein products led with 83.05% of the United States sports nutrition market share in 2025, whereas non-protein products are projected to register an 8.35% CAGR to 2031.
- By source, animal-based ingredients accounted for 60.72% share of the United States sports nutrition market size in 2025, while plant-based sources are forecast to expand at 9.78% CAGR between 2026-2031.
- By distribution channel, online retail stores captured 40.02% of the United States sports nutrition market size in 2025 and are poised to grow at a 10.74% CAGR through 2031.
Note: Market size and forecast figures in this report are generated using Mordor Intelligence’s proprietary estimation framework, updated with the latest available data and insights as of 2026.
United States Sports Nutrition Market Trends and Insights
Drivers Impact Analysis*
| Driver | (~) % Impact on CAGR Forecast | Geographic Relevance | Impact Timeline |
|---|---|---|---|
| Spike in outdoor fitness activities | +1.8% | Global, with concentration in North America and Europe | Medium term (2-4 years) |
| University athletics programs | +1.2% | North America and Europe, expanding to Asia-Pacific | Long term (≥ 4 years) |
| Availability of functional combination products | +1.5% | Global | Short term (≤ 2 years) |
| Rise in plant based sports nutrition products | +2.1% | North America and Europe core, spill-over to Asia-Pacific | Medium term (2-4 years) |
| Growing influence of social media and fitness influencers | +1.7% | Global, strongest in North America and Asia-Pacific | Short term (≤ 2 years) |
| Rising demand for personalized nutrition solutions | +1.4% | North America and Europe, early adoption in urban Asia-Pacific | Long term (≥ 4 years) |
| Source: Mordor Intelligence | |||
Spike in outdoor fitness activities
The post-pandemic period witnessed a significant shift in sports nutrition demand patterns, driven by increased outdoor fitness participation. According to the Sports and Fitness Industry Association [1], 242 million Americans (78.8% of the population) engaged in physical activities in 2023, marking a 2.2% increase from the previous year. This trend, which has shown consistent growth for ten consecutive years with 5 million new participants in 2023, has influenced product development in the sports nutrition market. Manufacturers are now focusing on portable, weather-resistant formulations, particularly energy gels and ready-to-drink protein beverages, to support extended outdoor activities. The emphasis on outdoor fitness has also increased demand for hydration and electrolyte replacement products. In response, companies are developing specialized formulations incorporating natural preservatives and temperature-stable ingredients to maintain product efficacy across various environmental conditions. This ongoing evolution in consumer preferences and product development is expected to continue shaping the sports nutrition market, driving innovation and growth in outdoor-focused nutritional solutions.
University athletics programs
University athletics programs drive the sports nutrition market in the United States through their comprehensive nutrition and supplementation programs for student-athletes. These programs create demand for protein powders, energy drinks, and recovery supplements to support athletic performance and recovery. The expanding student-athlete population and increased nutrition awareness contribute to market growth. The sports nutrition market in the United States benefits from a well-established distribution network of specialty retailers, online platforms, and university partnerships. Professional sports teams and training facilities across the country have also adopted similar nutrition protocols, creating a trickle-down effect that influences amateur athletes and fitness enthusiasts. The National Collegiate Athletic Association's (NCAA) [2] mandatory nutrition education requirement, effective August 2024, further strengthens the demand for sports nutrition supplements among collegiate athletes. The market continues to evolve with innovations in personalized nutrition solutions and clean-label products that cater to specific athletic performance requirements.
Availability of functional combination products
The convergence of multiple nutritional benefits into single-serving formats addresses consumer demand for convenience while maximizing bioactive compound synergies, particularly in pre-workout and recovery formulations. Companies are developing sophisticated combination products that merge protein, electrolytes, vitamins, and adaptogens to support multiple physiological pathways simultaneously. This trend extends beyond traditional categories, as demonstrated by Caribe Juice's May 2024 launch of WTRMLN ADE, an electrolyte-rich hydration beverage available in three flavors, indicating a significant market opportunity for recovery-focused combination products. The integration of multiple functional ingredients in a single product reduces the need for consumers to purchase and consume multiple supplements separately, thereby improving adherence to supplementation regimens. The growing awareness among athletes and fitness enthusiasts about the importance of comprehensive nutrition support has prompted manufacturers to invest in research and development of these multi-functional formulations. Additionally, the success of combination products in the market has encouraged retailers to allocate more shelf space to these innovative offerings, further accelerating their adoption among consumers.
Rise in plant-based sports nutrition products
Plant-based protein adoption is accelerating beyond environmental considerations, driven by digestibility advantages and amino acid profile innovations that challenge traditional whey protein dominance. According to Glanbia Nutritionals, [3] 25% of US consumers identify as flexitarian. This trend is evident in new product launches, such as Plezi Nutrition's sports drink introduction in March 2025. The beverage, available in Lemon Lime, Tropical Punch, and Orange Mango Twist flavors, features naturally gluten-free and plant-based ingredients, reflecting the market's shift toward plant-based alternatives in sports nutrition. The increasing consumer awareness about plant-based protein benefits has prompted established sports nutrition companies to expand their product portfolios with vegan options. Additionally, improvements in taste and texture of plant-based formulations have addressed previous barriers to adoption among athletes and fitness enthusiasts. The integration of diverse protein sources, including pea, hemp, and rice proteins, has also enabled manufacturers to create complete amino acid profiles that match the nutritional benefits of animal-based proteins.
Restraints Impact Analysis*
| Restraint | (~) % Impact on CAGR Forecast | Geographic Relevance | Impact Timeline |
|---|---|---|---|
| Stringent regulatory standards by FDA and FTC | -1.3% | North America, with spillover effects globally | Medium term (2-4 years) |
| Prevalence of counterfeit or adulterated products | -0.9% | National, concentrated in emerging markets | Short term (≤ 2 years) |
| Limited consumer awareness in certain demographic segments | -0.7% | Emerging markets and rural areas | Long term (≥ 4 years) |
| High product costs limiting adoption among price-sensitive consumers | -0.8% | National, particularly in price-sensitive markets | Medium term (2-4 years) |
| Source: Mordor Intelligence | |||
Stringent regulatory standards by FDA and FTC
Regulatory requirements in the United States sports nutrition market operate within a complex framework established by the Food and Drug Administration (FDA) and Federal Trade Commission (FTC). The FDA mandates manufacturers to follow Good Manufacturing Practices and provide accurate product labels containing ingredients, nutritional information, and allergen warnings. New dietary ingredients require pre-market FDA approval, involving extensive time and financial resources. Companies that fail to meet these regulatory standards risk substantial financial penalties and product recalls, which increase operational risks and costs. Product development timelines extend, and production costs increase due to required documentation, testing procedures, and certification processes. These comprehensive regulatory measures, while ensuring product safety and consumer protection, significantly impact market dynamics and operational strategies in the U.S. sports nutrition industry.
Prevalence of counterfeit or adulterated products
The prevalence of adulterated products in the sports nutrition market, particularly in supplements and performance enhancers, presents significant challenges to market growth. These counterfeit products not only pose severe health risks to consumers but also result in substantial revenue losses for legitimate manufacturers and retailers. The FDA has documented numerous cases of supplements containing undeclared ingredients, banned substances, and incorrect labeling, leading to increased regulatory scrutiny and enforcement actions across the supply chain. In February 2025, One Source Nutrition, Inc. issued a voluntary nationwide recall of Vitality Capsules due to the presence of undeclared Sildenafil and Tadalafil [4] according to FDA. The rise in adulteration cases has prompted regulatory bodies to implement stricter quality control measures and testing protocols for sports nutrition products. Consumer trust has been negatively impacted by these incidents, resulting in heightened skepticism toward supplement manufacturers and their products. The increasing costs associated with quality assurance and compliance measures have forced many smaller manufacturers to exit the market. These challenges collectively hamper the growth potential of the United States sports nutrition market, necessitating industry-wide efforts to maintain product integrity and rebuild consumer confidence.
*Our forecasts treat driver/restraint impacts as directional, not additive. The impact forecasts reflect baseline growth, mix effects, and variable interactions.
Segment Analysis
By Product Type: Protein Products Dominate Despite Non-Protein Acceleration
Sports protein products maintain market leadership with an 83.05% share in 2025, reflecting protein's essential role in muscle synthesis and recovery across athletic performance levels. Sports non-protein products represent the fastest-growing segment with an 8.35% CAGR through 2031, driven by advanced pre-workout formulations and specialized recovery compounds that address specific physiological needs beyond protein supplementation. The dominance of protein products is further reinforced by increasing awareness among recreational athletes and fitness enthusiasts about the importance of protein timing and dosage for optimal results.
Within protein products, powder formulations remain dominant due to cost efficiency and customization flexibility, while ready-to-drink formats gain market share through convenience benefits. Energy gels and BCAA powders in the non-protein segment show growth as consumers become more knowledgeable about targeted supplementation approaches and their specific performance benefits. The market also witnesses increased demand for multi-component protein blends that offer varied absorption rates and amino acid profiles to support different training phases.


By Source: Plant-Based Disruption Accelerates Animal-Based Dominance
Animal-based protein sources hold a 60.72% market share in 2025, primarily due to whey protein's complete amino acid profile and strong reputation among performance-focused athletes. Plant-based alternatives are projected to grow at a 9.78% CAGR through 2031, supported by better digestibility, environmental sustainability benefits, and improved protein isolation technologies that enhance taste and solubility. The dominance of animal-based proteins is further reinforced by their established supply chains and widespread consumer acceptance in traditional sports nutrition markets.
The plant-based segment continues to expand beyond traditional pea and soy proteins, incorporating hemp, pumpkin seed, and fermentation-derived proteins with distinct nutritional benefits. The rise of flexitarian consumers has increased demand for hybrid products that combine plant and animal proteins to balance performance and sustainability. While the segment faces higher production costs compared to whey protein, ongoing technological advancements and increased production scale are reducing this gap. New fermentation methods and agricultural technologies enable the development of plant proteins with amino acid compositions comparable to animal proteins. Market research indicates that consumer education about plant protein benefits and increased retail availability are key factors driving adoption across diverse demographic groups.
By Distribution Channel: Online Retail Achieves Dual Leadership
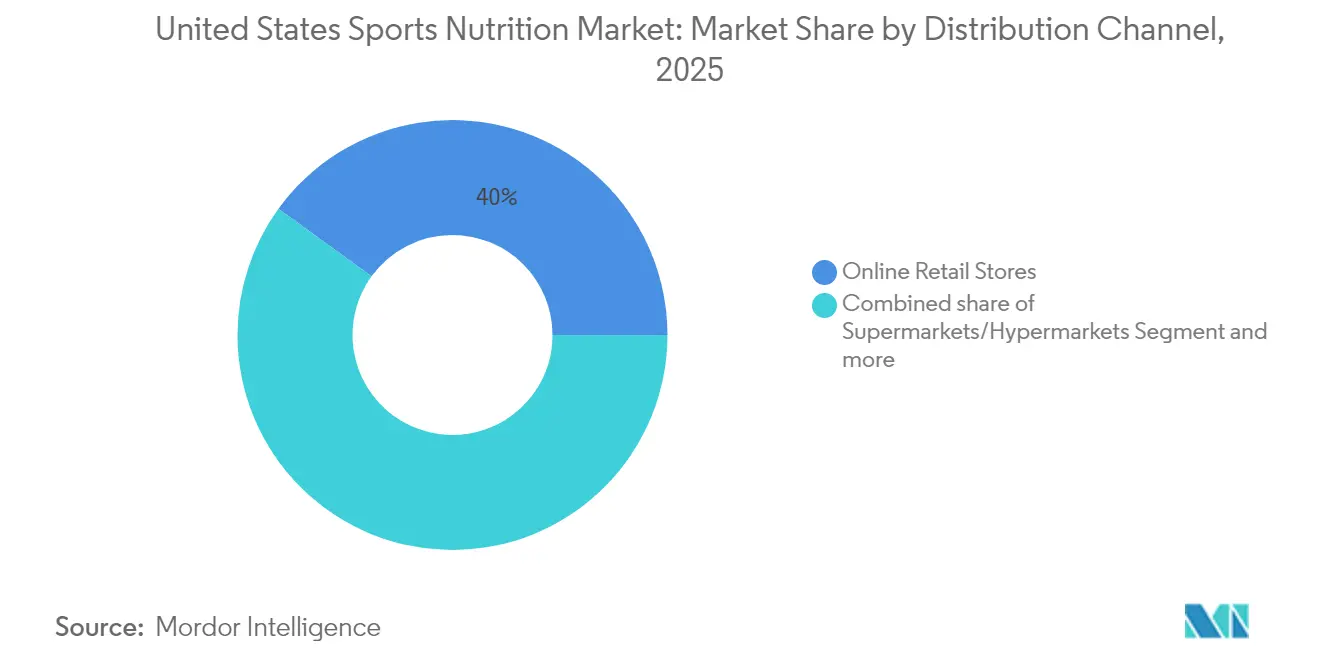
Online retail stores hold 40.02% market share in 2025 and are projected to grow at 10.74% CAGR through 2031. This growth stems from the channel's ability to provide product education, subscription options, and direct consumer engagement. The trend indicates a shift in purchasing patterns, especially among younger consumers who value convenience, user reviews, and personalized product suggestions. The expansion of mobile shopping applications and secure payment gateways further strengthens the dominance of online retail in the United States Sports Nutrition market.
Traditional retail channels, including supermarkets, pharmacies, and specialty stores, retain substantial market presence but experience increasing competition from online platforms that offer wider product selection and competitive prices. The integration of social commerce through Instagram and TikTok creates additional sales opportunities, particularly in reaching Gen Z consumers. Online channel growth is supported by improved logistics networks, lower delivery costs, and enhanced product verification systems that address consumer concerns about supplement quality. Despite these challenges, physical stores maintain their relevance through expert staff consultation and immediate product availability, which remain valuable to certain consumer segments.
Geography Analysis
The United States market benefits from high disposable income levels and an advanced distribution infrastructure across specialty retailers and mainstream supermarkets. The Dietary Supplement Health and Education Act (DSHEA) regulatory framework provides manufacturers with operational clarity while enabling product innovation. However, increased FDA oversight creates compliance requirements that benefit larger companies with substantial resources. The market's robust e-commerce infrastructure further enhances accessibility and consumer reach across the country.
The region's consumer base has expanded beyond traditional bodybuilders to include fitness enthusiasts, aging populations, and health-conscious individuals. This demographic shift drives demand for convenient, multi-functional formulations. Social media significantly influences purchasing decisions, particularly among younger consumers. Market research indicates that personalized nutrition and targeted supplementation continue to gain traction among these diverse consumer segments.
The adoption of GLP-1 medications for weight management presents growth opportunities as consumers seek nutrition products to maintain muscle mass during weight loss. Companies are developing specialized formulations for this market segment. In June 2024, Pure Protein launched an all-in-one protein powder for GLP-1 users, offering an accessible solution to address nutrient deficiency side effects associated with these medications. Industry analysts project this specialized segment to experience substantial growth as GLP-1 adoption increases across the United States.
Regulatory Landscape
Sports nutrition products in the United States operate under the Dietary Supplement Health and Education Act (DSHEA) within the Federal Food, Drug, and Cosmetic Act framework. The FDA is the primary regulator for dietary supplements (including key sports nutrition formats such as protein powders, amino-acid blends, and creatine), with compliance anchored in labeling requirements, Good Manufacturing Practices, and New Dietary Ingredient (NDI) notification expectations, while the FTC oversees advertising and marketing claims.
Regulatory focus areas have remained active through the base year and current year. In January 2025, the FDA proposed front-of-package nutrition labeling for most packaged foods via the Federal Register, adding another labeling-related compliance consideration for companies that operate across both conventional food and supplement-adjacent portfolios. In March 2026, the FDA Office of Dietary Supplement Programs held a public meeting (March 27, 2026) to discuss the scope of dietary supplement ingredients, including the implications of newer production technologies such as precision fermentation, signaling continued clarification work for novel ingredient pathways used in sports nutrition formulations. H.R. 7366 was also introduced in February 2026 to address federal preemption questions in dietary supplement regulation, reflecting ongoing policy attention on national uniformity amid state-level activity.
Value Chain Analysis
The United States sports nutrition value chain starts with raw material and specialty ingredient inputs (dairy-derived proteins such as whey and casein, plant proteins, amino acids, sweeteners, flavors, functional actives, and packaging), followed by formulation, blending, and manufacturing that is often handled through contract manufacturers. Brands then route finished goods through distributors and wholesalers into multi-channel retail, with online retail stores forming a major route to market alongside supermarkets/hypermarkets, pharmacy/health stores, and specialty outlets. Third-party testing and certifications (for example, NSF Certified for Sport in athlete-facing segments) function as a parallel service layer for quality assurance and brand credibility.
Supply chain performance is shaped by both capacity constraints and compliance overhead. Industry reporting in 2026 highlighted whey protein concentrate tightness as protein fortification expands across broader food categories, encouraging reformulation toward alternatives such as soy and pea proteins and increasing the importance of ingredient sourcing diversity. Processing capacity for high-purity isolates and specialized formats can also be a bottleneck, with longer lead times for expansions, while warehousing and fulfillment congestion can show up seasonally in manufacturing and logistics clusters. On the policy and coordination side, trade associations such as the Council for Responsible Nutrition (CRN) intensified engagement in 2025, including briefings tied to the re-established Congressional Dietary Supplement Caucus and outreach on topics such as tariff relief and HSA/FSA eligibility, reinforcing the role of advocacy and regulatory intelligence within the operating model.
Competitive Landscape
The United States sports nutrition market exhibits moderate fragmentation with established multinational corporations competing alongside specialized direct-to-consumer brands that leverage digital marketing and niche positioning strategies. Market leaders including Glanbia, Abbott, and PepsiCo maintain competitive advantages through scale economies, distribution reach, and Research and Development capabilities, while emerging players disrupt traditional categories through innovative formulations and targeted demographic focus. The market's competitive dynamics continue to evolve as companies adapt to changing consumer preferences and technological advancements.
Companies are pursuing vertical integration strategies by investing in ingredient sourcing, manufacturing capabilities, and direct-to-consumer channels to improve profit margins. Success in the market depends on regulatory compliance, supply chain transparency, and sustainability practices while maintaining product effectiveness and competitive pricing. These strategic initiatives enable companies to better control quality standards and respond quickly to market demands.
Companies are forming strategic partnerships to increase their market presence. In September 2024, C4 partnered with The Hershey Company to launch confectionery-inspired products across multiple categories. The collaboration introduced new Energy Drinks, Pre-Workout supplements, and a Protein Powder line featuring three candy-inspired variants, marking the first protein powder products for both companies. This partnership demonstrates the industry's trend toward innovative flavor profiles and cross-category expansion to attract new consumer segments.
United States Sports Nutrition Industry Leaders
-
Glanbia PLC
-
Now Foods
-
The Coca Cola Company
-
Abbott Laboratories Inc.
-
PepsiCo Inc.
- *Disclaimer: Major Players sorted in no particular order
Market Opportunities and Future Outlook
Capacity additions and local-for-local moves in 2026 create whitespace for faster innovation cycles, shorter replenishment lead times, and tighter quality control, particularly in protein powders, RTD protein, and functional combination products that depend on consistent ingredient specs. Applied Nutrition acquiring Nutrablend Group assets in June 2026 for USD 16 million to add a 107,000-square-foot facility in Buffalo, New York, is one example that expands US manufacturing capacity. SDC Nutrition also opened a 140,000-square-foot integrated production facility in Pittsburgh in May 2026 to increase manufacturing, testing, and storage capacity. Taken together, these steps support brands seeking scalable co-manufacturing, compliant testing, and rapid product refreshes as demand broadens from core athletes to lifestyle users.
Distribution and fulfillment capability is another near-term opportunity area because online retail remains a primary buying route for sports nutrition in the United States. In April 2026, Nutrabolt expanded its partnership with ID Logistics US by adding a 375,000-square-foot distribution hub near Milwaukee, Wisconsin, while scaling operations in Salt Lake City, Utah, which supports online-first discovery, subscriptions, and faster delivery expectations. On the regulatory and ingredient side, the FDA Office of Dietary Supplement Programs convened a public meeting on March 27, 2026 to discuss the scope of dietary supplement ingredients and new production technologies, including precision fermentation, creating a more defined forum for companies developing novel proteins, enzymes, and microbials that differentiate plant-based and next-generation sports nutrition formulations within the DSHEA framework.
Recent Industry Developments
- June 2026: NOW Foods partnered with LeafWorks to implement next-generation sequencing capabilities for botanical identity testing at its facility in Sparks, Nevada. The step strengthens raw material verification and quality assurance for botanical-containing supplement products, supporting tighter control against adulteration risks in the broader supplement supply chain.
- January 2026: NOW Health Group announced the transition of 30% of family shares to employees through a newly established Employee Stock Ownership Plan (ESOP). The ownership shift can support long-term continuity and operational investment priorities, including manufacturing quality systems and compliance processes that are critical in sports nutrition and supplement categories.
- April 2024: Glanbia completed the acquisition of Flavor Producers LLC for USD 300 million to expand capabilities in natural and organic flavors within its Nutritional Solutions business. The acquisition adds formulation inputs that matter for taste-led differentiation across protein powders, RTD protein, and functional blends as brands compete for mainstream wellness consumers.
Research Methodology Framework and Report Scope
Market Definition and Coverage
For this study, the United States sports nutrition market is defined as value sales of nutrition products that are clearly marketed for workout performance, muscle recovery, or body composition, and are bought by athletes as well as regular fitness users.
Scope exclusions: Traditional hydration beverages and energy drinks that are mainly positioned for casual refreshment are excluded from this market.
Segmentation Overview
- By Product Type
- Sports Protein Products
- Powder
- Whey And Casein Powder
- Plant based Protein Powder
- Other Sports Protein Powder
- Protein Ready to Drink
- Protein /Energy Bars
- Powder
- Sports Non Protein Products
- Energy Gels
- BCAA Powder
- Creatine Powder
- Other Sports Non Protein Products
- Sports Protein Products
- By Source
- Animal-based
- Plant-based
- By Distribution Channel
- Supermarkets/Hypermarkets
- Pharmacy/Health Stores
- Online Retail Stores
- Other Distribution Channels
Data Sources, Market Sizing, and Validation
Desk Research
Desk work starts with building a clean picture of demand signals, product claims, and channel structure for sports nutrition in the United States. We refer to public sources such as USDA food availability and ingredient context, U.S. Census Bureau retail and ecommerce indicators, Bureau of Labor Statistics CPI series to understand price movement, and U.S. International Trade Commission trade statistics for relevant nutrition inputs and finished formats.
On top of that, we review company annual reports, investor decks, and earnings call notes to map how revenue is discussed by category and by channel, and we cross-check with reputable press and association publications for product trends, including shifts to RTD protein and functional blends. A paid subscription focused on company financials and news is used selectively to standardize revenue references across private and public firms, and a patent database is used to sanity-check innovation intensity around core actives like amino-acid blends and creatine. The sources listed here are illustrative only, and many other public references are consulted to fill gaps and confirm assumptions.
Primary Interviews and Surveys
Primary work is used to pressure-test the demand pool and pricing logic for sports nutrition across the United States, especially where labels and usage overlap across fitness and lifestyle shoppers. We speak with brand-side leaders, contract manufacturers, ingredient specialists, and channel participants across specialty retail, mass retail, and ecommerce, and then re-contact a subset when a major assumption moves, for example when RTD mix shifts or promotional intensity changes.
Distribution of primary research fieldwork respondents
| Company type | Respondent position |
|---|---|
| Top tier: 26% | CXOs: 17% |
| Mid tier: 57% | Functional/Unit leaders: 29% |
| Smaller Players: 17% | Managers: 54% |
Market-Sizing & Forecasting
Sizing is built using a top-down approach where the U.S. nutrition spend pool is reconstructed through category splits and channel mix, then narrowed to products with explicit sports and performance positioning. That total is checked using selective bottom-up approximations, such as sampled brand revenue mapping, channel checks, and price-per-unit times estimated unit movement for major formats. The model is adjusted when the two views do not align.
Inputs that commonly shape the model include growth in fitness participation and training frequency, shifts between powders and RTD protein, average selling price movement linked to CPI and promo activity, ingredient cost pressure for key actives, and ecommerce share changes across sports nutrition baskets. Because not every company discloses category-level revenue cleanly, gaps are handled using conservative share assumptions that are anchored to interview feedback and then re-tested against public filings and channel observations. For forecasting, scenario analysis is used, with demand drivers and price progression tuned using expert expectations so the final curve reflects a realistic base case rather than a single straight-line extrapolation.
Data Validation & Update Cycle
Results are validated through several passes that compare the final number against independent signals, including price indexes, trade indicators for relevant inputs, and channel performance commentary. When an outlier appears, the driver is traced back to either volume, price, or mix, and then the assumption is revisited. If needed, the respondent set is tapped again for quick confirmation.
Before sign-off, the full model and its logic are reviewed by another analyst to catch variances and arithmetic issues. Then a final reasonability check is run at the total market level and at the major format level. Reports are refreshed on an annual cycle, with interim updates when material events occur, and a fresh pass is completed right before delivery so clients receive the most current view.
Mordor Intelligence's United States Sports Nutrition Market Size Measured Against Other Published Estimates
Published market values for U.S. sports nutrition can look far apart, even when the growth story sounds similar. The spread usually comes from how each source defines what counts as sports nutrition, how pricing is carried forward, and how closely the assumptions are checked against real market signals.
A common difference is scope creep into adjacent categories, especially when sports drinks, meal replacements, or weight loss products are grouped into the same bucket as performance supplements. Some estimates also apply aggressive price expansion or assume rapid premiumization without enough cross-checks against CPI movement and channel promotions, and the year used for currency timing and refresh cadence can add another layer of variation.
Benchmark comparison
| Source | Market Size | Gaps in Research Methodology |
|---|---|---|
| Mordor Intelligence | USD 18.28 B (2025) | |
| Global Consultancy A | USD 31.42 B (2025) | Uses a broader product basket that explicitly includes sports drinks, meal replacement products, and weight loss products, which lifts the total beyond performance-focused supplements and bars. |
| Industry Publisher B | USD 9.93 B (2025) | Runs a narrower definition and lower starting base that can undercount specialty formats, and the model leans more on broad segment labels with limited cross-checking of channel mix and pricing behavior. |
The table mainly points to a scope and pricing logic gap. Some sources fold in sports drinks and weight-loss adjacent items, then apply broad price progression across the whole basket, while Mordor Intelligence counts only sports-targeted powders, RTD protein, bars, amino-acid blends, creatine, and similar formulas, with conventional hydration and casual energy drinks kept out. With clear inclusions and repeatable checks on mix, price, and channel signals, the result is easier to trace and explain in practical decision-making.
Key Questions Answered in the Report
What is the projected value of the sports nutrition supplements market by 2031?
The market is forecast to reach USD 27.76 billion in 2031 on a 7.21% CAGR trajectory.
Which product segment currently commands the largest revenue share?
Protein-based products held 83.05% share in 2025, reflecting their entrenched role in muscle recovery routines.
How fast is the plant-based source segment growing?
Plant-based ingredients are set to expand at 9.78% CAGR between 2026-2031, the highest rate among source categories.
Why is online retail outperforming other channels?
Subscription models, influencer-driven education, and expedited last-mile logistics help online retail advance at 10.74% CAGR through 2031.