Market Overview
| Study Period | 2021 - 2031 |
|---|---|
| Base Year For Estimation | 2025 |
| Forecast Data Period | 2026 - 2031 |
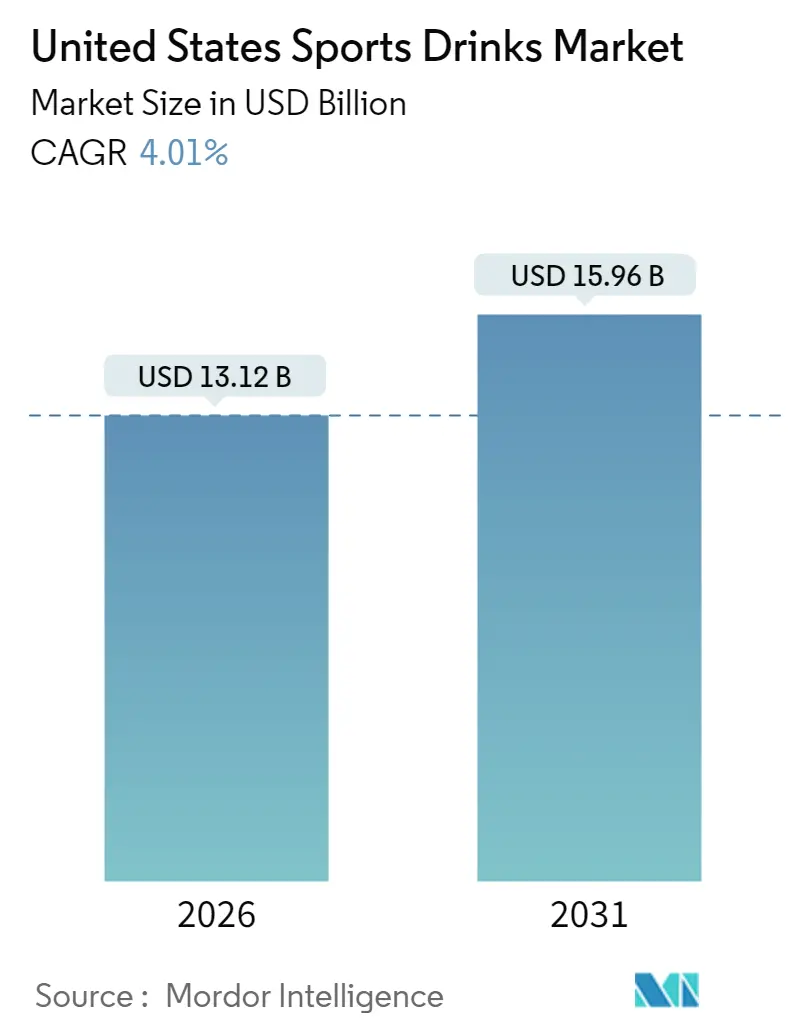
| Market Size (2026) | USD 13.12 Billion |
| Market Size (2031) | USD 15.96 Billion |
| Growth Rate (2026 - 2031) | 4.01% CAGR |
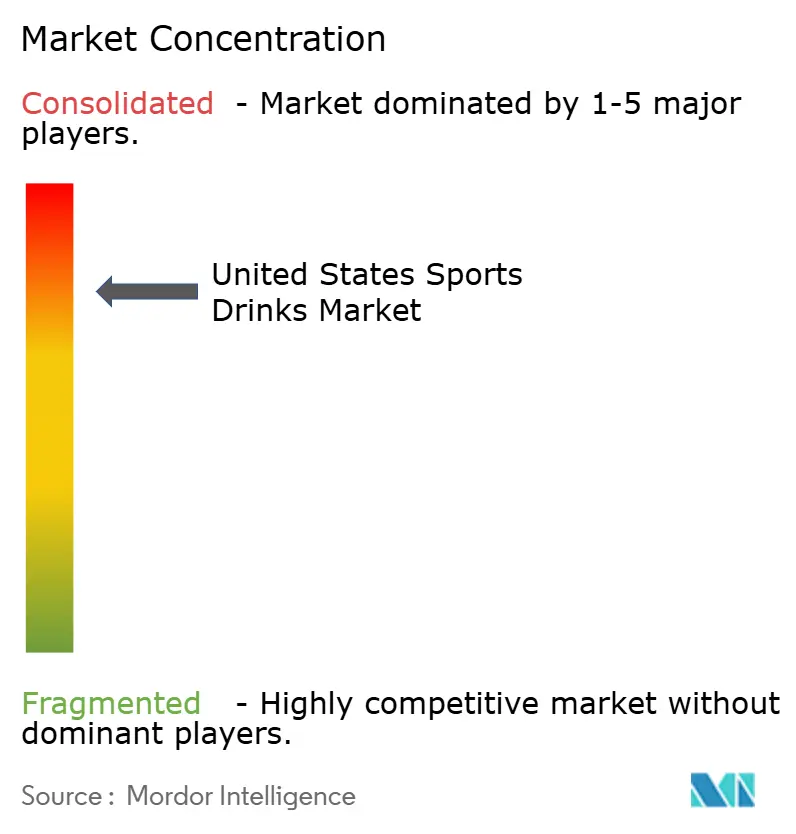
| Market Concentration | High |
Major Players *Disclaimer: Major Players sorted in no particular order Image © Mordor Intelligence. Reuse requires attribution under CC BY 4.0. | |
United States Sports Drinks Market Analysis by Mordor Intelligence
The United States sports drinks market was valued at USD 12.61 billion in 2025 and estimated to grow from USD 13.12 billion in 2026 to reach USD 15.96 billion by 2031, at a CAGR of 4.01% during the forecast period (2026-2031). Sustained active-lifestyle participation, premiumization, and functional innovation anchor growth even as the category matures. Established brands emphasize electrolyte science, clean-label recipes, and data-enabled personalization to preserve relevance among fitness-centric consumers. E-commerce expansion, direct-to-consumer subscriptions, and smart packaging strengthen shopper convenience while generating high-margin occasions. At the same time, rising input expenses and heightened sugar-label scrutiny encourage cost discipline and recipe reformulation. Competitive pressure from functional waters and plant-based beverages spurs product differentiation and propels strategic partnerships that keep performance credentials in focus.
Key Report Takeaways
- By product type, isotonic sports drinks led with 54.02% of the United States sports drinks market share in 2025, while hypertonic formulations posted the highest 7.06% CAGR through 2031.
- By packaging type, PET bottles captured 95.57% share of the United States sports drinks market size in 2025, and aseptic packages are projected to grow at 6.77% CAGR to 2031.
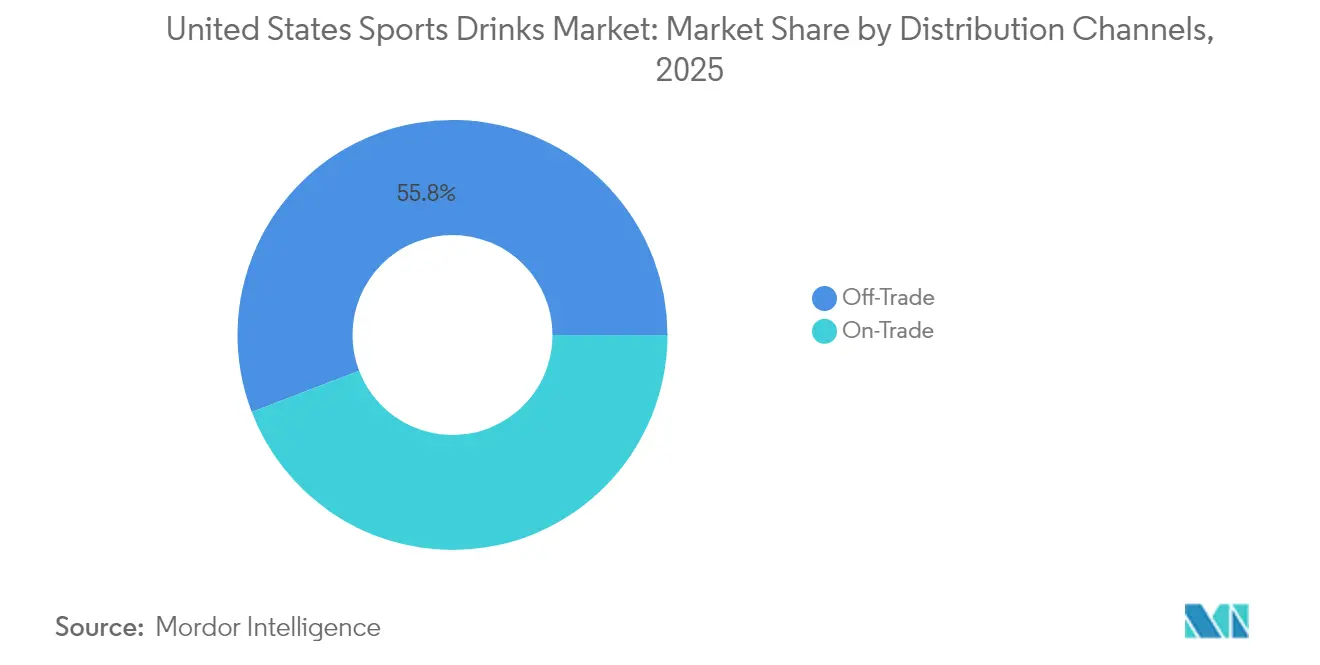
- By distribution channel, off-trade outlets controlled 55.82% revenue in 2025 and are expanding at a 9.33% CAGR through 2031, led by rapid e-commerce adoption.
- By functionality, post-workout products held 77.41% share of the United States sports drinks market size in 2025, while pre-workout lines are advancing at a 6.64% CAGR.
Note: Market size and forecast figures in this report are generated using Mordor Intelligence’s proprietary estimation framework, updated with the latest available data and insights as of January 2026.
United States Sports Drinks Market Trends and Insights
Drivers Impact Analysis
| Drivers | (~)% Impact on CAGR Forecasts | Geographic Relevance | Impact Timeline |
|---|---|---|---|
| Growing health and fitness consciousness among consumers | +1.2% | National, with stronger influence in coastal metropolitan areas | Medium term (2-4 years) |
| Innovative product formulations including natural ingredients, low sugar, and plant-based components | +0.8% | National, with premium adoption in high-income demographics | Long term (≥ 4 years) |
| Strategic partnerships with sports organizations, athletes, and fitness influencers | +0.6% | National, with concentrated impact in major sports markets | Short term (≤ 2 years) |
| Rising demand for protein-infused and performance-enhancing sports beverages | +0.7% | National, with early adoption in fitness-focused communities | Medium term (2-4 years) |
| Consumer shift towards clean-label, sustainable packaging | +0.5% | National, with stronger preference in environmentally conscious regions | Long term (≥ 4 years) |
| Increased marketing investments and promotional campaigns | +0.4% | National, with concentrated spending during major sporting events | Short term (≤ 2 years) |
| Source: Mordor Intelligence | |||
Understand The Key Trends Shaping This Market
Download PDF
Growing Health and Fitness Consciousness Among Consumers
In 2024, 68% of regular American consumers, as reported by the Sports & Fitness Industry Association[1]Sports & Fitness Industry Association, “2024 Sports & Fitness Participation Report,” sfia.org, perceive sports drinks as functional nutrition rather than simple refreshments. This shift aligns with a 35% adoption rate of wearable fitness technology among US adults. These devices have increased hydration awareness, turning sports drinks into intentional nutritional choices rather than impulse buys. The integration of fitness tracking with hydration guidance has driven collaborations between beverage brands and technology companies. Gatorade's Smart Gx system exemplifies how traditional manufacturers use biometric data to offer personalized product recommendations. Consumer education campaigns focusing on electrolyte science and hydration timing have enhanced the category's credibility. These initiatives have moved the messaging from generic "thirst-quenching" claims to evidence-based performance benefits. This trend resonates strongly with millennials and Gen Z, who prioritize fitness goals and lifestyle alignment in their purchases and are willing to pay premium prices. As a result, average selling prices have risen by 8% annually since 2022.
Innovative Product Formulations Including Natural Ingredients, Low Sugar, and Plant-Based Components
In 2024, major brands invested USD 2.3 billion in R&D, accelerating the shift toward natural ingredients and clean-label alternatives to synthetic additives. Coconut water, previously considered niche, has gained traction in premium segments, with hybrid formulations combining traditional electrolytes and natural coconut-derived potassium experiencing a strong 23% year-over-year growth. The adoption of plant-based proteins, such as pea, hemp, and algae, is transforming the market, enabling sports drinks to compete with post-workout protein supplements while maintaining convenience and taste. Low-sugar formulations using stevia, monk fruit, and allulose have reached taste parity with high-sugar variants, overcoming a key barrier for health-conscious consumers. A significant milestone in 2024 was the FDA's [2]U.S. Food and Drug Administration, “Allulose Sweetener Approval,” fda.govrecognition of allulose as a non-caloric sweetener, which accelerated reformulation efforts. This allowed brands to reduce added sugar content by up to 40% without compromising taste or functionality.
Strategic Partnerships with Sports Organizations, Athletes, and Fitness Influencers
In 2024, sports drink manufacturers achieved a milestone by investing a record USD 1.8 billion in athlete endorsements and organizational sponsorships, reflecting a notable 31% increase from 2023. The industry's shift toward micro-influencer strategies has delivered remarkable outcomes; fitness personalities now surpass traditional celebrities in engagement rates while offering more authentic opportunities for product integration. Partnerships with professional sports leagues have advanced, evolving from basic logo placements to comprehensive nutrition programs. For example, the NFL's official hydration partnership now includes customized formulations designed for different playing conditions and recovery phases. Similarly, college athletics partnerships have become more refined. Brands are no longer just providing products; they are implementing extensive hydration education programs, building long-term loyalty among young adult consumers. Additionally, the growth of esports partnerships highlights a strategic expansion beyond traditional athletics. With specialized gaming formulations and sponsorships, brands are targeting the 41 million Americans involved in competitive gaming, who increasingly recognize hydration's vital role in cognitive performance and reaction times.
Rising Demand for Protein-Infused and Performance-Enhancing Sports Beverages
In 2024, protein-enhanced sports drinks recorded a 34% growth, marking a significant shift as protein integration evolved from an experimental addition to a core category driver. While traditional formulations remained unchanged, whey protein continued to lead the market due to its complete amino acid profile and rapid absorption. However, plant-based alternatives are steadily gaining traction, particularly among lactose-intolerant and vegan consumers seeking equivalent performance benefits. The combination of sports drinks with post-workout recovery has resulted in hybrid products that eliminate the need for separate protein supplementation. These products cater to convenience-driven consumers, many of whom are willing to pay a premium for multifunctional solutions. Additionally, the inclusion of creatine monohydrate represents a new milestone in performance enhancement. Several brands have launched creatine-infused variants targeting strength training enthusiasts who previously relied on standalone supplements. Moreover, the addition of branched-chain amino acids (BCAAs) has become a defining feature of premium formulations. With leucine, isoleucine, and valine promoting muscle protein synthesis, these components are particularly appealing to endurance athletes and dedicated fitness enthusiasts seeking well-rounded nutrition solutions.
Restraint Impact Analysis
| Restraints | (~)% Impact on CAGR Forecasts | Geographic Relevance | Impact Timeline |
|---|---|---|---|
| High price sensitivity among consumers | -0.9% | National, with stronger impact in lower-income demographics | Short term (≤ 2 years) |
| Regulatory and labeling challenges | -0.6% | National, with varying state-level implementation | Medium term (2-4 years) |
| Rising raw material, production costs, and potential taxes on sugar-sweetened beverages | -0.8% | National, with concentrated impact in tax-implementing jurisdictions | Medium term (2-4 years) |
| Increasing competition from alternative beverages | -0.7% | National, with stronger competition in health-conscious markets | Long term (≥ 4 years) |
| Source: Mordor Intelligence | |||
High Price Sensitivity Among Consumers
Economic pressures have made consumers more price-conscious, with 47% of sports drink buyers opting for private-label alternatives or reducing their purchase frequency when prices rise by more than 10%. Inflation has strained household budgets, prompting many consumers, particularly middle-income groups who previously drove growth through premium product adoption, to prioritize essential purchases over premium hydration products. The introduction of concentrate formats and powdered alternatives has provided cost-effective options for budget-conscious consumers. However, these formats generate lower per-serving margins and disrupt the positioning of traditional liquid products. Promotional activity has become increasingly critical, with major retailers reporting that 68% of sports drink sales now occur during promotional periods, up from 52% in 2022, highlighting diminished brand loyalty when price premiums are too high. Private-label products have gained traction, achieving an 18% market share in 2024 as retailers leverage cost advantages to deliver comparable functionality at prices 30-40% lower than national brands.
Rising Raw Material, Production Costs, and Potential Taxes on Sugar-Sweetened Beverages
Costs for natural flavoring have risen by 28%, while organic certification premiums are adding further financial strain, impacting profitability across all price segments. The introduction of sugar taxes in Seattle, Philadelphia, and Berkeley has caused significant demand reduction. For example, sports drink sales dropped by 21% in taxed areas but increased by 8% in nearby non-taxed regions, reflecting consumers' willingness to change purchasing behavior rather than absorb higher costs, as noted by the American Journal of Public Health. Transportation expenses have climbed due to fuel price volatility and driver shortages, leading to a 12-15% rise in distribution costs. To remain competitive, manufacturers are optimizing route efficiencies and exploring regional production strategies. Packaging material costs, particularly for sustainable options, have also risen sharply. Recycled PET now carries a 20% premium over virgin materials, while aseptic packaging innovations require substantial capital investments, creating hurdles for smaller manufacturers aiming to maintain a competitive position.
Segment Analysis
By Product Type: Isotonic Dominance Faces Hypertonic Challenge
In 2025, isotonic sports drinks retained a 54.02% market share, driven by their strong consumer recognition and optimal electrolyte balance, which suits the moderate exercise routines common among Americans, as reported by Sports Medicine International Open. Meanwhile, hypertonic formulations are growing rapidly, with a 7.06% CAGR, supported by rising participation in endurance sports and increasing consumer awareness of carbohydrate loading strategies for sustained energy during extended activities. Hypotonic variants, though niche, cater to those prioritizing quick hydration without calorie intake. These drinks appeal to weight-conscious consumers and individuals involved in short, high-intensity workouts, where immediate fluid replenishment is more important than energy provision.
Protein-based sports drinks are a significant area of innovation, combining hydration with post-workout recovery to attract busy consumers seeking convenient nutritional solutions. Within this category, electrolyte-enhanced water is the fastest-growing subsegment, appealing to health-conscious individuals who prefer hydration without the calories or artificial ingredients found in traditional formulations, as highlighted by the Journal of the International Society of Sports Nutrition. The distinction between sports drinks and functional beverages continues to blur. Manufacturers are now creating hybrid products that meet multiple consumer needs in a single formulation, driving premiumization and increasing margins across the segment.

Note: Segment shares of all individual segments available upon report purchase
Get Detailed Market Forecasts at the Most Granular Levels
Download PDF
By Packaging Type: PET Bottles Dominate While Aseptic Packages Gain Momentum
In 2025, PET bottles hold a dominant 95.57% market share, highlighting their popularity due to familiar packaging, efficient retail handling, and cost-effective production. Glass bottles face challenges in gaining market share due to their weight and the risk of breakage, particularly during athletic activities. Similarly, metal cans encounter resistance from consumers, mainly because of taste perception and temperature retention issues, which are critical for sports drink consumers. Disposable cups are primarily used in institutional and event settings but lack the portability and resealability features that individual consumers prefer.
Aseptic packages are the fastest-growing segment, with a 6.77% CAGR, driven by sustainability initiatives, extended shelf-life benefits, and innovative designs that distinguish premium products from traditional ones. The FDA's approval of new aseptic processing technologies in 2024 has enabled manufacturers to preserve nutritional integrity while reducing packaging weight and environmental impact. Tetra Pak's innovative solutions have resonated with environmentally conscious consumers, offering recyclable carton materials that provide a better sustainability profile than traditional plastic bottles while maintaining the quality and convenience essential for sports drinks.
By Distribution Channel: Off-Trade Leadership Accelerates Through E-commerce
In 2025, off-trade channels hold a leading 55.82% market share and exhibit the highest growth with a 9.33% CAGR. This reflects a notable shift towards convenience-focused purchasing behaviors, supported by the growth of e-commerce platforms that enable bulk buying and subscription-based deliveries. Supermarkets and hypermarkets remain the largest channel, benefiting from promotional strategies and cross-merchandising opportunities with fitness and nutrition products. Urban convenience stores thrive on impulse purchases, particularly where immediate consumption supports premium pricing.
Online retail is the fastest-growing subchannel within off-trade. For instance, Amazon's sports nutrition category achieves an impressive 43% growth in 2024, driven by consumer preference for subscription services and bulk purchasing, which offer both cost savings and convenience. Specialty stores continue to stay relevant by providing expert consultations and curating premium products, appealing to serious athletes seeking customized formulations and nutrition advice. On-trade channels, such as gyms, sports facilities, and foodservice establishments, play a key role in offering trial opportunities and catering to immediate consumption needs. However, their growth is limited by higher operational costs and slower inventory turnover compared to retail alternatives.
Note: Segment shares of all individual segments available upon report purchase
Get Detailed Market Forecasts at the Most Granular Levels
Download PDF
By Functionality: Post-Workout Dominance Challenged by Pre-Workout Innovation
In 2025, post-workout products hold a dominant 77.41% share of the market, highlighting widespread consumer awareness of recovery nutrition principles. This awareness is supported by established scientific research, particularly emphasizing the necessity of replenishing electrolytes and carbohydrates after exercise, as noted by the International Journal of Sport Nutrition and Exercise Metabolism. This market leadership is the result of decades of consumer education on the importance of rehydration and recovery, which has fostered deeply ingrained consumption habits favoring post-exercise product use. Intra-workout applications address specific needs, especially for endurance athletes who depend on these products for sustained energy and electrolyte replacement during prolonged sessions.
Pre-workout products are experiencing the fastest growth, with a 6.64% CAGR. This growth is driven by increasingly informed consumers who understand the value of exercise preparation. Additionally, the growing popularity of high-intensity interval training (HIIT) highlights the importance of strategic pre-exercise nutrition. Modern pre-workout sports drinks, now formulated with caffeine, B-vitamins, and other performance-enhancing ingredients, have evolved beyond simple hydration solutions. They now directly compete with traditional pre-workout supplements, as reported by Sports Medicine. Furthermore, other applications, such as general hydration, meal replacements, and specialized formulations for specific sports or environmental conditions, present new opportunities for product innovation and niche market growth.
Geography Analysis
Consumption patterns in the U.S. sports drinks market vary across regions, influenced by demographics, climate, and local fitness culture. Southern and Western states lead in per-capita consumption due to warmer climates and a strong outdoor recreation culture. California accounts for 18% of the total market volume, driven by its large population, health-conscious consumers, and well-developed fitness infrastructure, as reported by the USDA Economic Research Service.
The Northeast is the fastest-growing region, with a 5.73% CAGR projected through 2031, fueled by urbanization, increasing disposable incomes, and greater fitness center penetration. Midwestern markets prioritize value-oriented purchases, while Mountain West states favor premium products, supported by outdoor recreation participation rates that exceed the national average by 34%. The Northeast's high concentration of higher education institutions also drives demand from college-age consumers, who often develop long-term brand preferences, according to the National Association of Convenience Stores.
Climate significantly impacts seasonal consumption trends. Southern states maintain steady demand throughout the year, while Northern markets experience a 40-60% increase during summer, coinciding with peak outdoor activities, as per the National Weather Service. Urban areas consistently surpass rural ones in premium product adoption and new product trials, driven by higher disposable incomes, broader retail options, and greater exposure to fitness trends.
Competitive Landscape
The U.S. sports drinks market is highly concentrated, with established players maintaining dominance through extensive distribution networks, significant marketing investments, and ongoing product innovation, which create substantial barriers for new entrants. PepsiCo's Gatorade holds approximately 70% of the market share, driven by its scientific credibility, partnerships with professional sports, and a comprehensive product portfolio that caters to various price points and functional needs. Coca-Cola, with its multi-brand strategy including Powerade and the acquired BodyArmor, captures about 25% of the market. This strategy focuses on differentiated positioning and appealing to specific demographics, complementing Gatorade's mass-market dominance rather than competing directly.
Emerging players are focusing on premium positioning, clean-label formulations, and direct-to-consumer strategies, bypassing traditional retail channels. These brands are building authentic connections with health-conscious consumers who are willing to pay a premium for perceived quality and functional benefits. Congo Brands' Prime is a notable recent entrant, leveraging social media influence and celebrity endorsements to rapidly expand distribution and attract younger consumers who have traditionally been loyal to established brands. Technology has become a key competitive differentiator, with brands incorporating smart packaging, personalized nutrition apps, and biometric integrations to transition from simple product offerings to comprehensive wellness solutions.
Opportunities exist in specialized segments such as women-specific formulations, hydration products for seniors, and condition-specific variants designed for diabetes management, kidney health, and other medical needs requiring optimized electrolyte balance. Patent filings for functional ingredient combinations and delivery mechanisms have risen by 45% since 2022, reflecting intensifying innovation competition as brands seek proprietary advantages in an increasingly commoditized market.
United States Sports Drinks Industry Leaders
PepsiCo, Inc.
Pisa Global, S.A. de C.V.
Seven & I Holdings Co., Ltd.
Suntory Holdings Limited
The Coca-Cola Company
- *Disclaimer: Major Players sorted in no particular order
Need More Details on Market Players and Competitors?
Download PDF
Recent Industry Developments
- October 2025: Powerade launched its first new product, Powerade Power Water, a zero-sugar, electrolyte-enhanced flavored water containing 50% more electrolytes. Powerade Power Water was offered in four flavors: Mountain Berry Blast, Strawberry Kiwi, Tropical Pineapple, and Watermelon.
- August 2025: Walmart expanded its product range by introducing A-GAME Beverages' sports drinks on the Walmart Marketplace in 2025. This launch aimed to leverage Walmart's rapidly growing e-commerce platform and enhance its beverage offerings.
- March 2025: Stephen Curry teamed up with former First Lady Michelle Obama to launch PLEZi Hydration, a healthier sports drink designed with purposeful ingredients, including half the sugar and no added artificial sweeteners. PLEZi Nutrition, the drink offers three flavors — Lemon Lime, Tropical Punch, and Orange Mango Twist.
- June 2024: Lionel Messi launched his low-sugar sports drink, Mas+. Mas+ was created as a hydration beverage containing electrolytes, vitamins, minerals, antioxidants, natural flavors, and just 1 gram of sugar with 10 calories per serving.
United States Sports Drinks Market Report Scope
Electrolyte-Enhanced Water, Hypertonic, Hypotonic, Isotonic, Protein-based Sport Drinks are covered as segments by Soft Drink Type. Aseptic packages, Metal Can, PET Bottles are covered as segments by Packaging Type. Convenience Stores, Online Retail, Specialty Stores, Supermarket/Hypermarket, Others are covered as segments by Sub Distribution Channel.By Product Type
| Electrolyte-enhanced water |
| hypertonic |
| hypotonic |
| isotonic |
| protein-based sports drinks |
By Packaging Type
| PET Bottles |
| Glass Bottles |
| Metal Can |
| Aseptic packages (tetra pak, cartons, pouches) |
| Disposable Cups |
By Distribution Channel
| On-Trade | |
| Off-Trade | Supermarket/Hypermarket |
| Convenience Stores | |
| Specialty Stores | |
| Online Retail | |
| Other Distribution Channels |
By Functionality
| Pre-Workout |
| Intra-Workout |
| Post-Workout |
| Others |
| By Product Type | Electrolyte-enhanced water | |
| hypertonic | ||
| hypotonic | ||
| isotonic | ||
| protein-based sports drinks | ||
| By Packaging Type | PET Bottles | |
| Glass Bottles | ||
| Metal Can | ||
| Aseptic packages (tetra pak, cartons, pouches) | ||
| Disposable Cups | ||
| By Distribution Channel | On-Trade | |
| Off-Trade | Supermarket/Hypermarket | |
| Convenience Stores | ||
| Specialty Stores | ||
| Online Retail | ||
| Other Distribution Channels | ||
| By Functionality | Pre-Workout | |
| Intra-Workout | ||
| Post-Workout | ||
| Others | ||
Need A Different Region or Segment?
Customize Now
Market Definition
- Carbonated Soft Drinks (CSDs) - Carbonated soft drinks (CSDs) refer to non-alcoholic beverages that are carbonated and typically flavored, containing dissolved carbon dioxide to create effervescence. These beverages commonly include cola, lemon-lime, orange, and various fruit-flavored sodas. Marketed in cans, bottles, or fountain dispense.
- Juices - We have considered packaged juices which encompass non-alcoholic beverages derived from fruits, vegetables, or a combination thereof, processed and sealed in various packaging formats such as bottles, cartons, or pouches. Excluding fresh juices, this market segment involves commercially prepared and preserved juices, often with added preservatives and flavors.
- Ready-to-Drink (RTD) Tea and RTD Coffee - Ready-to-Drink (RTD) tea and RTD coffee are pre-packaged, non-alcoholic beverages that are brewed and prepared for consumption without further dilution. RTD tea typically includes various tea varieties, infused with flavors and sweeteners, and comes in bottles, cans, or cartons. Similarly, RTD coffee involves pre-brewed coffee formulations, often mixed with milk, sugar, or flavorings, and is conveniently packaged for on-the-go consumption.
- Energy Drinks - Energy drinks are non-alcoholic beverages formulated to provide a quick boost of energy and alertness. Whereas, sports drinks are beverages designed to hydrate and replenish electrolytes, particularly after physical exertion, exercise, or intense activity
| Keyword | Definition |
|---|---|
| Carbonated Soft Drinks | Carbonated soft drinks (CSDs) are a combination of carbonated water and flavouring, sweetened by sugar or a non-sugar sweeteners. |
| Standard Cola | Standard Cola is defined as the original flavor of cola soda. |
| Diet Cola | A cola-based soft drink containing no or low amounts of sugar |
| Fruit Flavored Carbonates | A carbonated beverage prepared from fruit juice/fruit flavor with carbonated water and containing sugar, dextrose, invert sugar or liquid glucose either singly or in combination. It may contain peel oil and fruit essences. |
| Juice | Juice is a drink made from the extraction or pressing of the natural liquid contained in fruit and vegetables. |
| 100% Juice | Fruit/vegetable juice made from fruit in the form of its juice with no water added to make up the volume. It is not permitted to add sugars, sweeteners, preservatives, flavourings or colourings to fruit juice. |
| Juice Drinks (up to 24% Juice) | Fruit/vegetable juice drinks with up to 24% fruits/vegetable extract. |
| Nectars (25-99% Juice) | Juices that can have between 25 and 99% of fruit, with the minimum legal limits defined depending on the type of fruit |
| Juice concentrates | Juice Concentrates are those form of juices when most of this liquid is removed resulting in a thick, syrupy product known as juice concentrate. |
| RTD Coffee | Packaged coffee beverages that are sold in a prepared form and are ready for consumption at the time of purchase. |
| Iced Coffee | An iced coffee is a cold version of coffee, usually a combination of hot espresso and milk with ice added to it. |
| Cold Brew Coffee | Cold brew also called cold water extraction or cold pressing is made by steeping ground coffee in room-temperature water for several hours. |
| RTD Tea | Ready-to-drink (RTD) tea is a packaged tea product ready for immediate consumption without brewing or preparation |
| Iced Tea | Ice tea or iced tea is a drink made from tea without milk but with sugar and sometimes fruit flavourings, drunk cold. |
| Green Tea | Green tea is a tea beverage which promotes mental alertness, relieving digestive symptoms and promoting weight loss. |
| Herbal Tea | Herbal tea beverages are made from the infusion or decoction of herbs, spices, or other plant material in hot water. |
| Energy Drink | A type of drink containing stimulant compounds, usually caffeine, which is marketed as providing mental and physical stimulation. They may or may not be carbonated and may also contain sugar, other sweeteners, or herbal extracts, among numerous possible ingredients. |
| Sugar-free or Low-calories Energy Drinks | Sugar-free or Low-calories Energy Drinks are sugar-free, artificially sweetened energy drinks with few or no calories. |
| Traditional Energy Drink | Traditional Energy Drinks are functional soft drinks containing ingredients designed to boost the consumer's energy. |
| Natural/Oraganic Energy Drinks | Natural/Organic energy drinks are energy drinks free of artificial sweeteners and synthetic colorings. Instead, they contain naturally derived ingredients such as green tea, yerba mate, and botanical extracts. |
| Energy Shots | A small but highly concentrated energy drink that contains large amounts of caffeine and/or other stimulants. The quantity is comparatively smaller compared to energy drinks. |
| Sports Drink | Sports drinks are beverages designed specifically for the rapid supply of fluid, carbohydrates, and electrolytes before, during or after exercise. |
| Isotonic | Isotonic drinks contain similar concentrations of salt and sugar as in the human body, and are designed to quickly replace fluids lost during exercise but with an increase of carbohydrate. |
| Hypertonic | Hypertonic drinks have a higher concentration of salt and sugar than the human body. They are best drunk after exercise as it is important to replace glycogen levels quickly after exercise. |
| Hypotonic | Hypotonic drinks are designed to quickly replace fluids lost during exercise. They have very low carbohydrate content and a lower concentration of salt and sugar than the human body. |
| Electrolyte-Enhanced Water | Electrolyte water is water infused with electrically-charged minerals, such as sodium, potassium, calcium, and magnesium. |
| Protein-based Sport Drinks | Protein-based sports drinks are those sports drinks which has added protein in it that will improve performance and reduce muscle protein breakdown. |
| On-Trade | The on-trade refers to places that sell beverages for immediate consumption on the premises like bars, restaurants, and pubs |
| Off-Trade | Off-trade usually means places like liquor stores, supermarkets and other places where you don't consume the beverage right away. |
| Convenience Store | A retail business that provides the public with a convenient location to quickly purchase a wide variety of consumable products and services, generally food and gasoline. |
| Specialty store | A specialty store is a shop/store that carries a deep assortment of brands, styles, or models within a relatively narrow category of goods |
| Online Retail | Online retail is a type of eCommerce whereby a business sells goods or services directly to consumers from a website. |
| Aseptic Packaging | Aseptic packaging refers to the filling of a cold, commercially sterile product under sterile conditions into a presterilized container and closure under sterile conditions to form a seal that effectively excludes microorganisms. These includes tetra packs, cartons, pouches etc. |
| PET Bottle | PET bottle means a bottle made of polyethylene terephthalate. |
| Metal Cans | Metal containers made of aluminum or tin- plated or zinc-plated steel, which are commonly used for packaging food, beverages or other products. |
| Disposable Cups | Disposable Cup means a cup or other container designed for single use to serve beverages, such as water, cold drinks, hot drinks and alcoholic beverages. |
| Gen Z | A way of referring to the group of people who were born in the late 1990s and early 2000s. |
| Millenial | Anyone born between 1981 and 1996 (ages 23 to 38 in 2019) is considered a Millennial |
| Taurine | Taurine is an amino acid that supports immune health and nervous system function. |
| Bars & Pubs | It is a drinking establishment licensed to serve alcoholic drinks for consumption on the premises. |
| Café | It is a foodservice establishment serving refreshments (mainly coffee) and light meals. |
| On the go | It means doing / dealing with while busily engaged with something and not diverting plans in order to accommodate. |
| Internet Penetration | The Internet Penetration Rate corresponds to the percentage of the total population of a given country or region that uses the Internet. |
| Vending Machine | A machine that dispenses small articles such as food, drinks, or cigarettes when a coin or token is inserted |
| Discount store | A discount store or discounter offers a retail format in which products are sold at prices that are in principle lower than an actual or supposed "full retail price". Discounters rely on bulk purchasing and efficient distribution to keep down costs. |
| Clean Label | Clean label on the beverage market are drinks that are made from few ingredients of natural origin and are not or only slightly processed. |
| Caffeine | An alkaloid compound which is a stimulant of the central nervous system. It is mainly used recreationally, as a mild cognitive enhancer to increase alertness and attentional performance. |
| Extreme sport | Action sports, adventure sports or extreme sports are activities perceived as involving a high degree of risk. |
| High-intensity interval training | It incorporates several rounds that alternate between several minutes of high intensity movements to significantly increase the heart rate to at least 80% of one's maximum heart rate, followed by short periods of lower intensity movements. |
| Shelf life | The length of time for which an item remains usable, fit for consumption, or saleable. |
| Cream Soda | Cream soda is a sweet soft drink. Generally flavored with vanilla and based on the taste of an ice cream float |
| Root Beer | Root beer is a sweet North American soft drink traditionally made using the root bark of the sassafras tree Sassafras albidum or the vine of Smilax ornata as the primary flavor. Root beer is typically, but not exclusively, non-alcoholic, caffeine-free, sweet, and carbonated. |
| Vanilla Soda | A carbonated soft drink flavoured with vanilla. |
| Dairy-Free | A product that does not contain any milk or milk products from cows, sheep or goats. |
| Caffeine-Free Energy Drinks | Caffeine-free energy drinks rely on other ingredients to boost the energy. Popular choices include amino acids, B vitamins, and electrolytes. |
Need More Details on Market Definition?
Ask a Question
Research Methodology
Mordor Intelligence follows a four-step methodology in all our reports.
- Step-1: IDENTIFY KEY VARIABLES: In order to build a robust forecasting methodology, the variables and factors identified in Step 1 are tested against available historical market numbers. Through an iterative process, the variables required for market forecast are set, and the model is built on the basis of these variables.
- Step-2: Build a Market Model: Market-size estimations for the forecast years are in nominal terms. Inflation is not a part of the pricing, and the average selling price (ASP) is kept constant throughout the forecast period for each country.
- Step-3: Validate and Finalize: In this important step, all market numbers, variables, and analyst calls are validated through an extensive network of primary research experts from the market studied. The respondents are selected across levels and functions to generate a holistic picture of the market studied.
- Step-4: Research Outputs: Syndicated reports, custom consulting assignments, databases & subscription platforms

Get More Details On Research Methodology
Download PDF


