Market Overview
| Study Period | 2017 - 2030 |
|---|---|
| Base Year For Estimation | 2024 |
| Forecast Data Period | 2025 - 2030 |
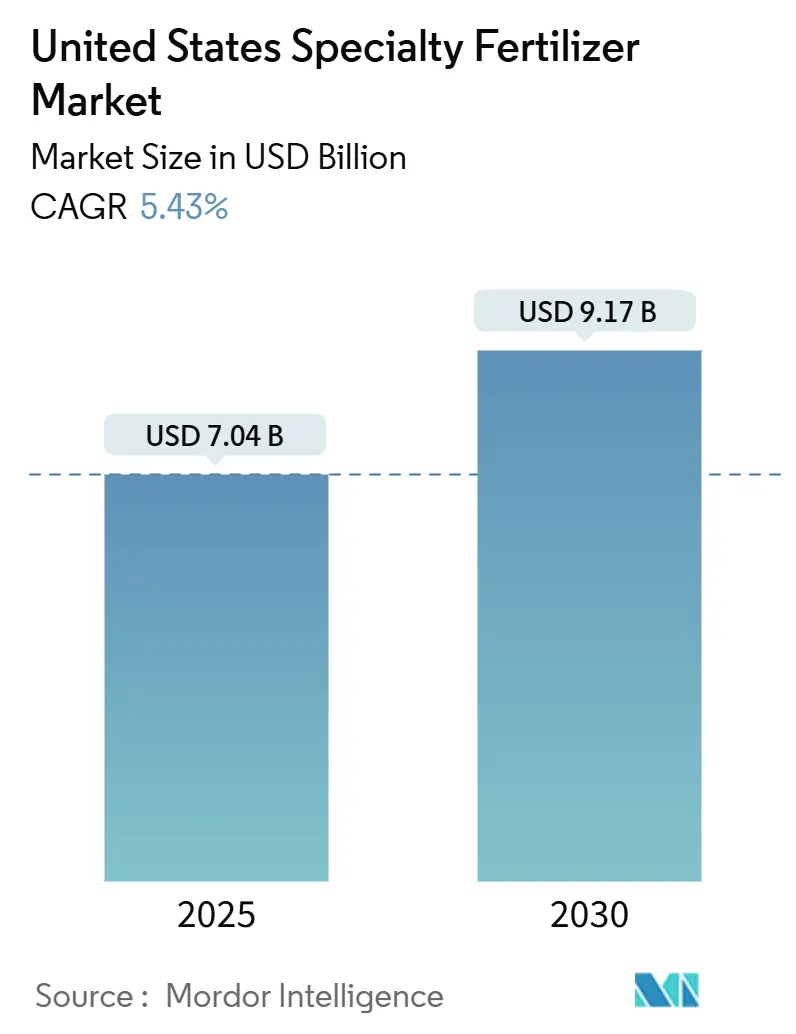
| Market Size (2025) | USD 7.04 Billion |
| Market Size (2030) | USD 9.17 Billion |
| Growth Rate (2025 - 2030) | 5.43% CAGR |
| Market Concentration | High |
Major Players*Disclaimer: Major Players sorted in no particular order Image © Mordor Intelligence. Reuse requires attribution under CC BY 4.0. |
|
United States Specialty Fertilizer Market Analysis by Mordor Intelligence
The United States specialty fertilizer market size stands at USD 7.0 billion in 2025 and is forecast to reach USD 9.1 billion by 2030, advancing at a 5.4% CAGR during 2025-2030. Rising investment in precision nutrient programs, stricter runoff regulations, and the economics of yield maximization are steering growers toward premium controlled-release, stabilized, and fully soluble nutrition solutions. The convergence of GPS-guided variable-rate spreaders with polymer-coated formulations enables site-specific application that trims nutrient losses while lifting net returns per acre. Price premiums of 20%-40% over commodity NPK blends persist because these products integrate coating chemistries, micronutrient enrichment, and proprietary blending services that boost agronomic efficiency. Market expansion in the region is further supported by micro-irrigation upgrades on 2 million drip-irrigated acres since 2021 till now and the construction of more than 1,200 acres of indoor farming space that demands ultra-clean soluble feeds.
Key Report Takeaways
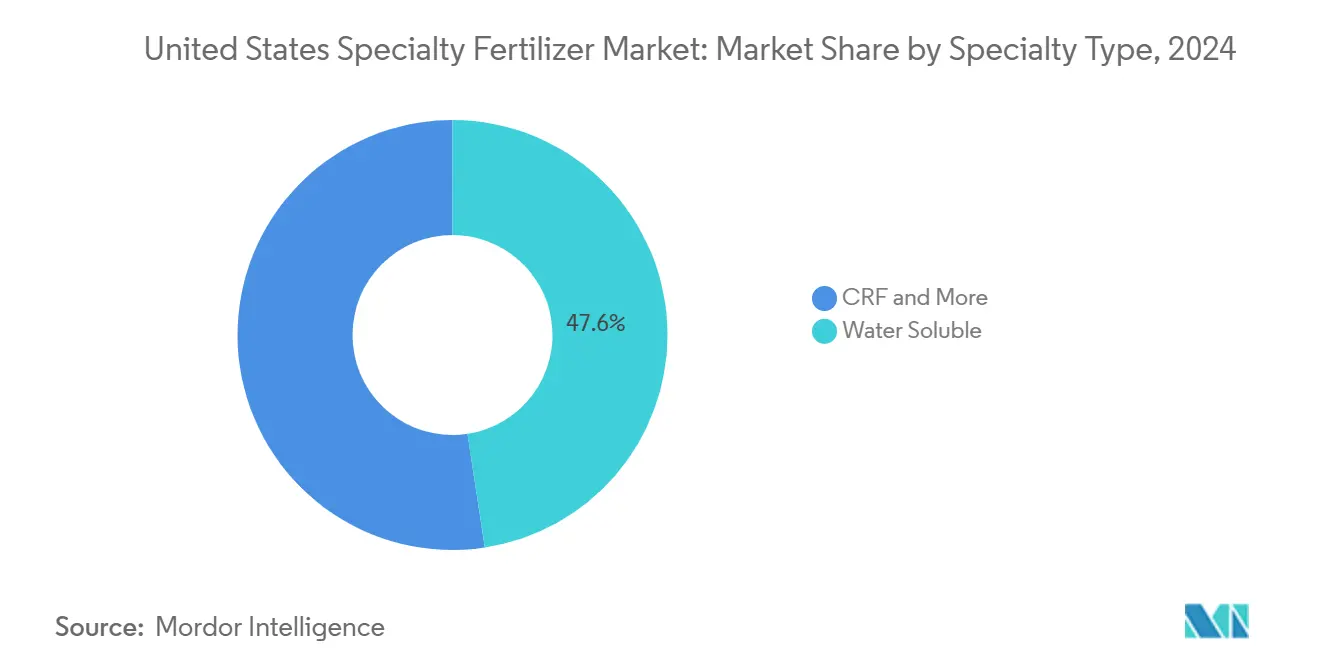
- By specialty type, water-soluble fertilizers held 47.6% of the United States specialty fertilizer market share in 2024, whereas controlled-release fertilizers are projected to advance at an 8.17% CAGR through 2030.
- By application mode, fertigation commanded a 48.2% share of the United States specialty fertilizer market size in 2024, and soil application methods are on track to expand at an 8.05% CAGR between 2025 and 2030.
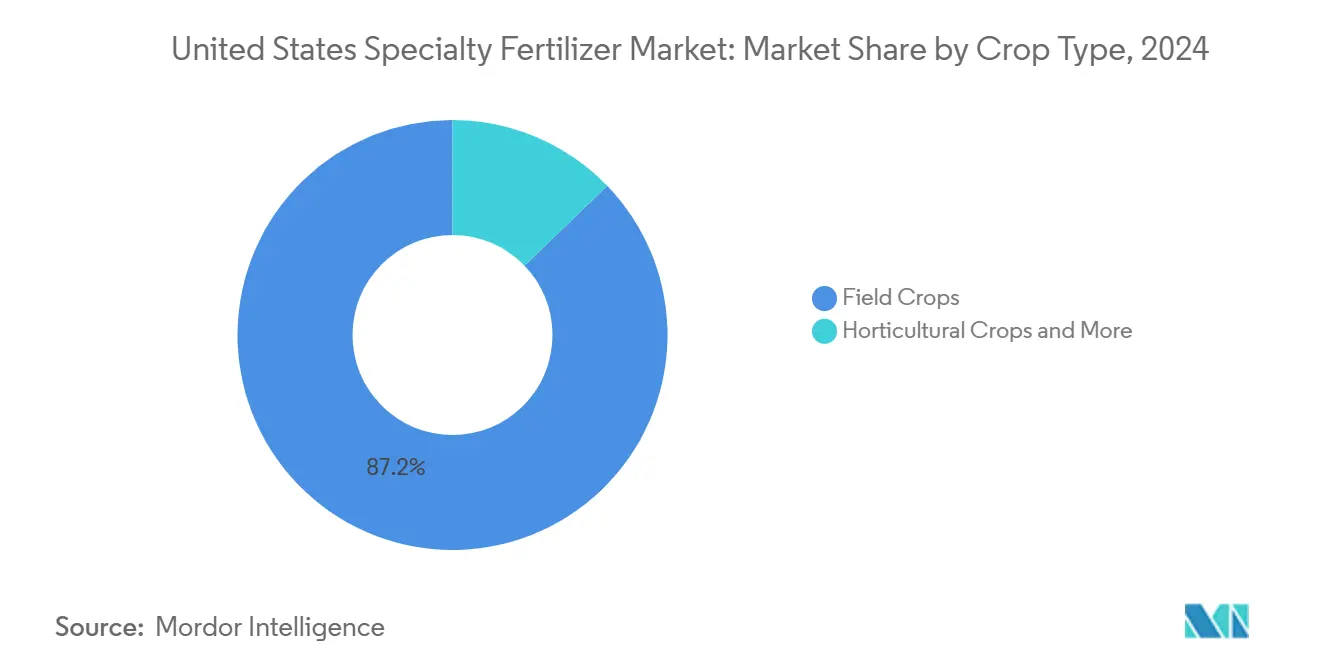
- By crop type, field crops accounted for 87.2% of the market in 2024, whereas horticultural crops are forecast to post a 9.38% CAGR through 2030.
United States Specialty Fertilizer Market Trends and Insights
Drivers Impact Analysis
| Driver | (~) % Impact on CAGR Forecast | Geographic Relevance | Impact Timeline |
|---|---|---|---|
| Precision agriculture adoption accelerates demand for high-efficiency inputs | +1.2% | Midwest Corn Belt, California Central Valley, Great Plains | Medium term (2-4 years) |
| Environmental rules on nutrient runoff favor controlled release and soluble products | +1.5% | Great Lakes states, Chesapeake Bay watershed, Gulf Coast | Long term (≥ 4 years) |
| Micro-irrigation expansion boosts fertigation-grade fertilizers | +0.8% | Western states, Southeast specialty crops, Texas High Plains | Medium term (2-4 years) |
| Turf and ornamental boom drives specialty usage | +0.6% | Sunbelt states, urban corridors, resort regions | Short term (≤ 2 years) |
| Food retailer carbon scoring rewards low-loss nitrogen technologies | +0.4% | National, concentrated in major agricultural regions | Long term (≥ 4 years) |
| Drip, Controlled Environment Agriculture (CEA) and vertical-farm buildout needs soluble, ultra-clean nutrition | +0.3% | Urban centers, the Northeast corridor, and California | Medium term (2-4 years) |
| Source: Mordor Intelligence | |||
Understand The Key Trends Shaping This Market
Download PDF
Precision Agriculture Adoption Accelerates Demand for High-Efficiency Inputs
Seventy-five percent of corn and soybean acres in leading states used GPS-enabled variable-rate systems in 2024, opening the door for fertilizers that synchronize nutrient release with crop uptake. Growers see 10-15% reductions in application rates without yield loss, which offsets specialty fertilizer premiums. Field sensors, NDVI imagery, and soil conductivity mapping feed real-time prescriptions that lean toward stabilized, polymer-coated, and inhibitor-enhanced formulations. Artificial-intelligence decision tools are now pairing with programmable-release granules able to stagger nutrient availability across a 90-day window. Together, these technologies anchor long-term demand for premium inputs such as specialty fertilizers on high-value acres [1]Source: USDA National Agricultural Statistics Service, “Precision Agriculture Technologies,” nass.usda.gov.
Environmental Rules on Nutrient Runoff Favor Controlled-Release and Soluble Products
Environmental Protection Agency (EPA) total Maximum Daily Load programs in the Chesapeake Bay and other impaired watersheds require a 25% nitrogen reduction by 2025. Compliance pushes growers to products that keep nutrients in the soil profile, such as polymer-coated urea and dual-inhibitor blends. Several Midwest states have expanded voluntary cost-share incentives, while water-quality credit trading programs allow farmers to monetize nutrient savings achieved through the use of enhanced-efficiency fertilizers. The trend favors suppliers able to validate loss reductions with third-party data.
Turf and Ornamental Boom Drives Specialty Usage
The managed golf course area increased by 16% from 2020 to 2024, with professional turf managers requiring nitrogen sources that provide steady nutrient release without growth surges. Additionally, golf course managers and professional landscapers require specialized products that deliver consistent, reliable results. The residential landscaping segment is growing as homeowners continue to develop outdoor spaces. Municipal contracts now include sustainability requirements that mandate enhanced-efficiency fertilizers, driving institutional demand for controlled-release and inhibitor technologies. These fertilizers enable precise nutrient delivery through fertigation or foliar sprays, targeting the root zone or plant foliage. This application method improves efficiency and minimizes waste, supporting conservation objectives in turf and ornamental areas.
Drip, CEA and Vertical-Farm Buildout Needs Soluble, Ultra-Clean Nutrition
The area under drip irrigation in the United States increased from 39,821 acres to 69,941 acres between 2018 and 2023. In controlled environment agriculture (CEA) facilities, impurities in nutrient solutions can block drip irrigation and misting systems, resulting in system failures and crop losses. These facilities commonly implement closed-loop systems to recycle water and nutrients efficiently. The systems require specialized fertilizers with specific macro and micronutrient ratios formulated for crops such as leafy greens, berries, and tomatoes. Automated dosing systems dispense concentrated solutions at regular intervals, which supports premium pricing. The addition of specialized nutrient blends enhances crop disease resistance and vegetative growth in these controlled environments.
Restraints Impact Analysis
| Restraint | (~) % Impact on CAGR Forecast | Geographic Relevance | Impact Timeline |
|---|---|---|---|
| Price premium versus commodity fertilizers | -1.8% | National, concentrated in price-sensitive crop regions | Short term (≤ 2 years) |
| Ammonia and natural gas price volatility | -1.1% | Gulf Coast production regions, Midwest consumption areas | Short term (≤ 2 years) |
| Pending microplastic bans on polymer coatings | -0.7% | National, early adoption in California and the Northeast | Medium term (2-4 years) |
| Canada's potash tariff risk inflates potassium specialties | -0.5% | Northern Plains, Great Lakes states, Eastern seaboard | Short term (≤ 2 years) |
| Source: Mordor Intelligence | |||
Price Premium Versus Commodity Fertilizers
Specialty fertilizer grades cost 20%–40% more than bulk NPK, leading growers to delay adoption when crop prices fall below USD 4.50 per bushel for corn and USD 12.00 per bushel for soybeans. With margins in commodity systems averaging only 5%–10%, producers remain highly sensitive to input costs. Regional freight charges further widen the price gap, pushing premiums to as high as 50% in remote areas. However, regional blenders introducing generic controlled-release lines have reduced premiums to around 15% where logistics are favorable, though branded suppliers continue to differentiate through superior agronomic service and technical support.
Pending Microplastic Bans on Polymer Coatings
Federal regulations may classify fertilizer coatings as intentionally added microplastics by 2028, while California considers implementing earlier restrictions in priority watersheds. In response, suppliers are developing starch-, protein-, and wax-based biodegradable coatings to maintain controlled-release functionality. The industry is establishing voluntary standards for coating degradation rates to ensure market sustainability[2]Source: Congressional Research Service, “Microplastics in the Environment,” crsreports.congress.gov. A February 2025 study from Mizzou Engineering demonstrated that polymer coatings on polymer-coated controlled-release fertilizers (PC-CRFs) decompose in soil and release microplastics, contributing to environmental pollution. These scientific findings are accelerating the implementation of stricter regulations in the United States, which hinder the market.
Segment Analysis
By Specialty Type: Water-Soluble Dominance Meets CRF Innovation
Water-soluble products represented 47.6% of the United States specialty fertilizer market in 2024. Growers prefer these formulations in fertigation and controlled-environment systems where fast dissolution and precise dosing are critical. Controlled-release fertilizers now move at an 8.17% CAGR, fuelled by runoff regulations that reward coatings that meter nutrients over 90-120 days. Liquid fertilizers keep traction for in-season nitrogen top-dress and micronutrient corrections, while slow-release organo-mineral blends retain relevance in turf care where extended feeding minimizes mowing frequency.
Manufacturers are blending multiple release mechanisms within single granules, allowing early-season soluble nitrogen followed by temperature-responsive slow release. R&D centers file patents on coatings that respond to soil moisture and microbial activity. Proof-of-performance field trials help justify premiums as growers track yield maps and input costs side by side. Technical service teams remain pivotal, ensuring correct calibration of injectors and spreaders to unlock the products’ full value.
Note: Segment shares of all individual segments available upon report purchase
Get Detailed Market Forecasts at the Most Granular Levels
Download PDF
By Application Mode: Fertigation Leadership Drives Soil Innovation
Fertigation absorbed 48.2% of the United States specialty fertilizer market size in 2024 because micro-irrigation lets growers deliver nutrients with every watering event. Systems rely on fully soluble powders and liquids that flow without clogging emitters. Soil application is slated for the fastest expansion at an 8.05% CAGR, supported by variable-rate spreaders that place coated granules exactly where roots will intercept them. Foliar feeding maintains importance in high-value crops needing rapid micronutrient correction during sensitive growth stages.
Drone-based spraying broadens foliar coverage in fields with limited ground equipment access. On-the-go sensing directs real-time adjustments in spray mix, reducing waste. Soil-placed controlled-release products benefit from advanced polymer chemistries that limit outer-layer abrasion during handling, securing a predictable release curve even under intense rainfall.
By Crop Type: Field Crop Dominance Yields to Horticultural Growth
Field crops captured 87.2% of the United States specialty fertilizer market share in 2024, owing to the sheer acreage of corn, soybean, and wheat. Even modest uptake of enhanced-efficiency products on these acres drives substantial volume. Horticultural crops are projected to grow 9.38% annually as vertical farms, greenhouses, and open-field vegetable plantings expand. Turf and ornamental demand remains steady due to golf course construction and residential landscaping that prize aesthetic outcomes.
The horticultural surge reflects consumers’ appetite for year-round fresh produce and retailers’ willingness to pay premiums for low-carbon, residue-free supply chains. Specialty suppliers target these crops with ultra-pure blends tailored for hydroponics and drip irrigation. Crop-specific packages for berries, tomatoes, and leafy greens integrate calcium, magnesium, and trace element ratios aligned with tissue-analysis benchmarks, reducing physiological disorders and boosting shelf life.
Note: Segment shares of all individual segments available upon report purchase
Get Detailed Market Forecasts at the Most Granular Levels
Download PDF
Geography Analysis
The Midwest Corn Belt accounts for a major share of the United States specialty fertilizer consumption because precision ag adoption and runoff regulations converge in this region. Variable-rate placement tools upgrade standard NPK programs to stabilized and polymer-coated variants. California’s Central Valley ranks second in value, driven by drip-irrigated orchards and vegetables that rely on water-soluble grades [3]California Department of Food and Agriculture, “Agricultural Statistics and Reports,” cdfa.ca.gov . Compliance with groundwater restrictions locks in demand for products that deliver nutrients efficiently under tight water budgets.
Great Plains growers embrace controlled-release urea as irrigation pivots spread across former dryland wheat areas, pushing the region’s specialty sales. Texas High Plains districts add liquid NPK injectors to conserve scarce aquifer water. The Southeast diversifies into berries, nuts, and protected agriculture that uses soluble fertilizers year-round. Chesapeake Bay watershed states maintain their own market niche because nutrient-management plans grant cost-share rebates for enhanced-efficiency inputs.
In the Northeast corridor, urban farms and greenhouse clusters require ultra-clean feeds and frequent deliveries, supporting premium pricing and localized blending hubs. Transportation costs still create disparities; specialty price premiums average 15% in high-volume corridors yet reach 40% in remote markets. Manufacturers weigh regional production against national distribution, often partnering with local dealers to shorten lead times and customize blends.
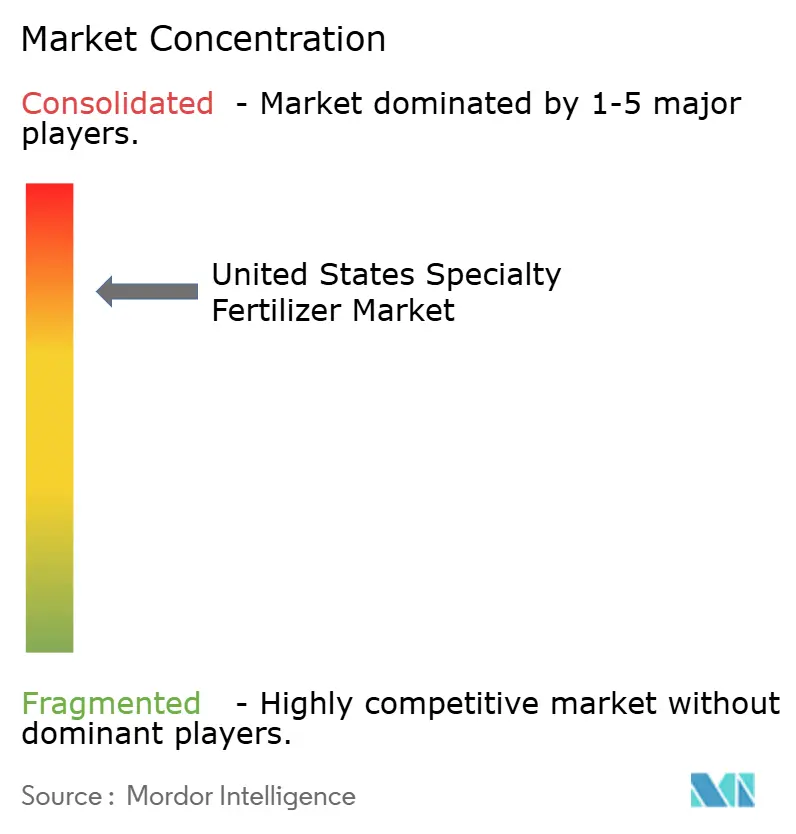
Competitive Landscape
Five firms, CF Industries, The Mosaic Company, Wilbur-Ellis Company LLC, Yara International ASA, and The Andersons, held 73.2% collective share in 2024, giving the United States specialty fertilizer market a high concentration profile. CF Industries leverages in-house ammonia and a coast-to-coast retail network to keep its lead. Mosaic ranks second through strength in liquid and micronutrient blends that align with fertigation growth. ICL pushes premium potassium nitrate and water-soluble packages into indoor farms.
Technology is the battleground. Firms integrate digital crop models, satellite imagery, and soil testing data to generate prescription plans that specify their branded products. Patent filings exceed 150 annually, covering biodegradable coatings, dual-inhibitor systems, and micronutrient chelation. Strategic alliances with equipment OEMs embed fertilizer algorithms in field machines, tightening supplier–grower relationships. Smaller regional producers carve out niches with crop-specific or organic-compliant lines, though scale constraints limit nationwide reach.
A greater share of R&D now targets environmental compliance. Yara’s biodegradable PROCOTE and Scotts’ lawn-care biopolymer layers address looming microplastic bans. CF Industries invests USD 200 million in low-carbon ammonia, positioning its nitrogen offerings for retailer carbon scorecards. These moves suggest that sustainability credentials will soon rival agronomic efficacy in product differentiation.
United States Specialty Fertilizer Industry Leaders
-
CF Industries Holdings, Inc.
-
The Andersons Inc.
-
The Mosaic Company
-
Wilbur-Ellis Company LLC
-
Yara International ASA
- *Disclaimer: Major Players sorted in no particular order
Need More Details on Market Players and Competitors?
Download PDF
Recent Industry Developments
- October 2025: CF Industries announced a USD 200 million outlay for low-carbon ammonia capacity in Donaldsonville, Louisiana, United States to supply enhanced-efficiency nitrogen with lower greenhouse gas intensity. Specialty fertilizer producers can promote their products based on lower carbon emissions.
- August 2024: ICL acquired Custom Ag Formulators (CAF), a North American manufacturer of customized agricultural formulations and products, for USD 60 million. CAF produces liquid adjuvants, enhanced nutrients, and specialty fertilizer products for agricultural growers.
- June 2023: ICL launched a new line of advanced foliar and fertigation solutions under its Nova brand of water-soluble fertilizers in the United States. The product line includes Nova FINISH, Nova PULSE, Nova ELEVATE, and Nova FLOW.
United States Specialty Fertilizer Market Report Scope
CRF, Liquid Fertilizer, SRF, Water Soluble are covered as segments by Speciality Type. Fertigation, Foliar, Soil are covered as segments by Application Mode. Field Crops, Horticultural Crops, Turf & Ornamental are covered as segments by Crop Type.
Speciality Type
| CRF | Polymer Coated |
| Polymer-Sulfur Coated | |
| Others | |
| Liquid Fertilizer | |
| SRF | |
| Water Soluble |
Application Mode
| Fertigation |
| Foliar |
| Soil |
Crop Type
| Field Crops |
| Horticultural Crops |
| Turf & Ornamental |
| Speciality Type | CRF | Polymer Coated |
| Polymer-Sulfur Coated | ||
| Others | ||
| Liquid Fertilizer | ||
| SRF | ||
| Water Soluble | ||
| Application Mode | Fertigation | |
| Foliar | ||
| Soil | ||
| Crop Type | Field Crops | |
| Horticultural Crops | ||
| Turf & Ornamental |
Need A Different Region or Segment?
Customize Now
Market Definition
- MARKET ESTIMATION LEVEL - Market Estimations for various types of fertilizers has been done at the product-level and not at the nutrient-level.
- NUTRIENT TYPES COVERED - Primary Nutrients: N, P and K, Secondary Macronutrients: Ca, Mg and S, Micronutients: Zn, Mn, Cu, Fe, Mo, B, and Others
- AVERAGE NUTRIENT APPLICATION RATE - This refers to the average volume of nutrient consumed per hectare of farmland in each country.
- CROP TYPES COVERED - Field Crops: Cereals, Pulses, Oilseeds, and Fiber Crops Horticulture: Fruits, Vegetables, Plantation Crops and Spices, Turf Grass and Ornamentals
| Keyword | Definition |
|---|---|
| Fertilizer | Chemical substance applied to crops to ensure nutritional requirements, available in various forms such as granules, powders, liquid, water soluble, etc. |
| Specialty Fertilizer | Used for enhanced efficiency and nutrient availability applied through soil, foliar, and fertigation. Includes CRF, SRF, liquid fertilizer, and water soluble fertilizers. |
| Controlled-Release Fertilizers (CRF) | Coated with materials such as polymer, polymer-sulfur, and other materials such as resins to ensure nutrient availability to the crop for its entire life cycle. |
| Slow-Release Fertilizers (SRF) | Coated with materials such as sulfur, neem, etc., to ensure nutrient availability to the crop for a longer period. |
| Foliar Fertilizers | Consist of both liquid and water soluble fertilizers applied through foliar application. |
| Water-Soluble Fertilizers | Available in various forms including liquid, powder, etc., used in foliar and fertigation mode of fertilizer application. |
| Fertigation | Fertilizers applied through different irrigation systems such as drip irrigation, micro irrigation, sprinkler irrigation, etc. |
| Anhydrous Ammonia | Used as fertilizer, directly injected into the soil, available in gaseous liquid form. |
| Single Super Phosphate (SSP) | Phosphorus fertilizer containing only phosphorus which has lesser than or equal to 35%. |
| Triple Super Phosphate (TSP) | Phosphorus fertilizer containing only phosphorus greater than 35%. |
| Enhanced Efficiency Fertilizers | Fertilizers coated or treated with additional layers of various ingredients to make it more efficient compared to other fertilizers. |
| Conventional Fertilizer | Fertilizers applied to crops through traditional methods including broadcasting, row placement, ploughing soil placement, etc. |
| Chelated Micronutrients | Micronutrient fertilizers coated with chelating agents such as EDTA, EDDHA, DTPA, HEDTA, etc. |
| Liquid Fertilizers | Available in liquid form, majorly used for application of fertilizers to crops through foliar and fertigation. |
Need More Details on Market Definition?
Ask a Question
Research Methodology
Mordor Intelligence follows a four-step methodology in all our reports.
- Step-1: IDENTIFY KEY VARIABLES: In order to build a robust forecasting methodology, the variables and factors identified in Step-1 are tested against available historical market numbers. Through an iterative process, the variables required for market forecast are set and the model is built on the basis of these variables.
- Step-2: Build a Market Model: Market-size estimations for the forecast years are in nominal terms. Inflation is not a part of the pricing, and the average selling price (ASP) is kept constant throughout the forecast period for each country.
- Step-3: Validate and Finalize: In this important step, all market numbers, variables and analyst calls are validated through an extensive network of primary research experts from the market studied. The respondents are selected across levels and functions to generate a holistic picture of the market studied.
- Step-4: Research Outputs: Syndicated Reports, Custom Consulting Assignments, Databases & Subscription Platforms

Get More Details On Research Methodology
Download PDF


