Market Overview
| Study Period | 2020 - 2030 |
|---|---|
| Base Year For Estimation | 2024 |
| Forecast Data Period | 2025 - 2030 |
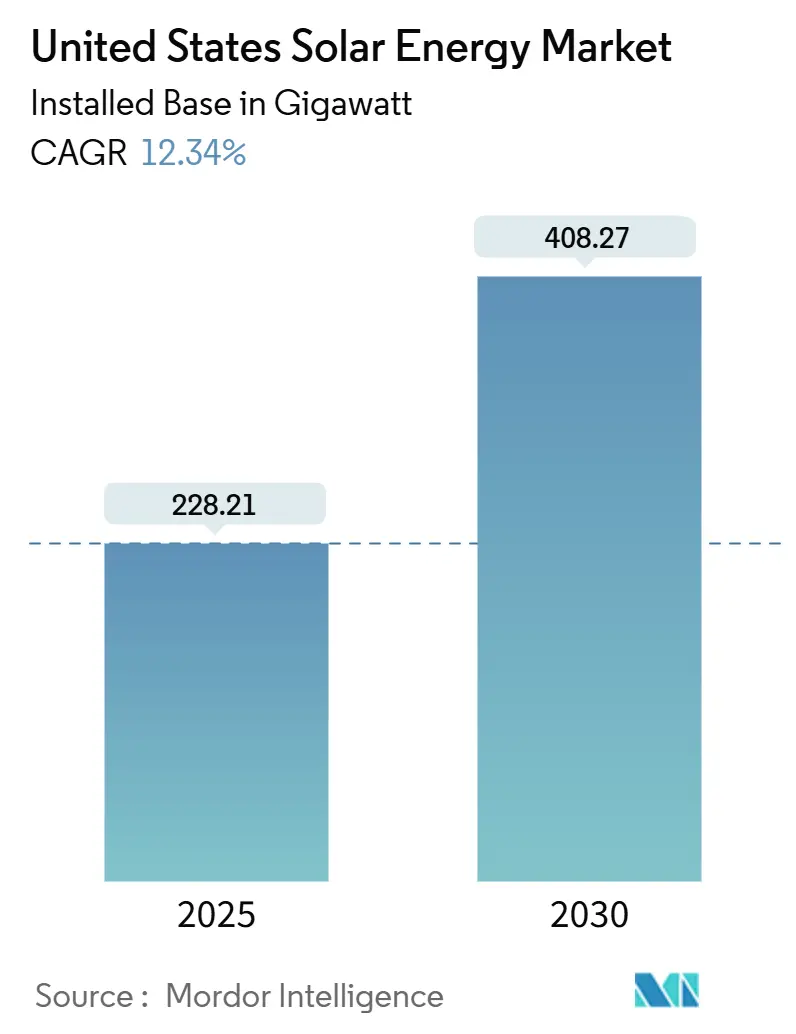
| Market Volume (2025) | 228.21 gigawatt |
| Market Volume (2030) | 408.27 gigawatt |
| Growth Rate (2025 - 2030) | 12.34% CAGR |
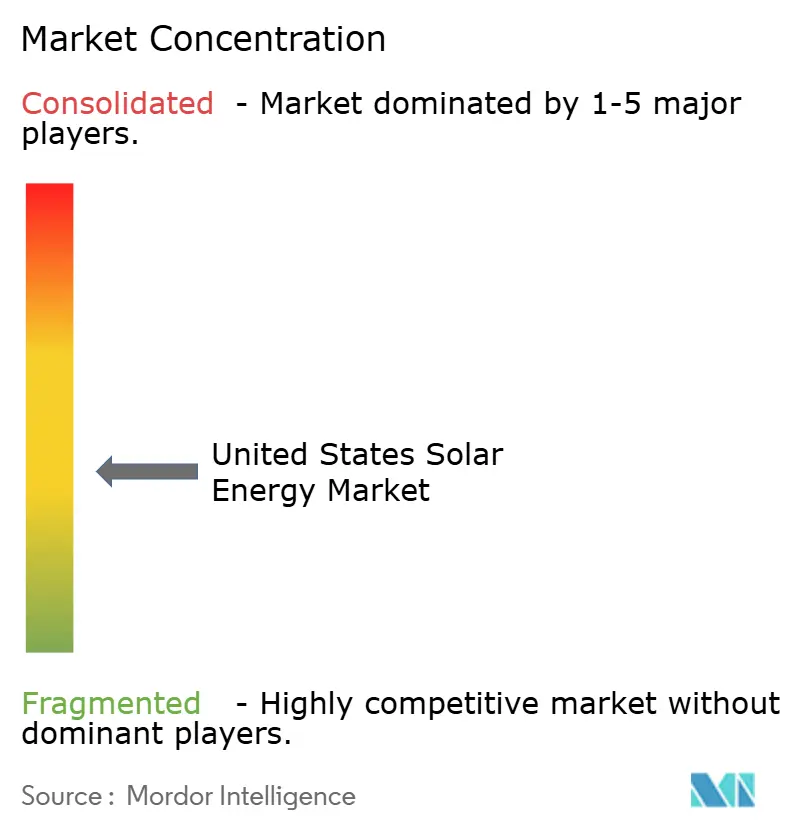
| Market Concentration | Medium |
Major Players
*Disclaimer: Major Players sorted in no particular order Image © Mordor Intelligence. Reuse requires attribution under CC BY 4.0. |
|
United States Solar Energy Market Analysis by Mordor Intelligence
The United States Solar Energy Market size in terms of installed base is expected to grow from 228.21 gigawatt in 2025 to 408.27 gigawatt by 2030, at a CAGR of 12.34% during the forecast period (2025-2030).
The upward curve rests on uncapped federal tax credits, steady module‐price compression, and a maturing ecosystem of power-purchase agreements that let utilities, corporations, and households lock in long-dated clean-energy exposure. Rapid uptake of high-efficiency photovoltaic (PV) modules, the near-universal pairing of new projects with battery storage, and domestic manufacturing credits that shelter projects from tariff volatility underpin this momentum. Transmission constraints, interconnection bottlenecks, and skilled-labor shortages continue to temper build-out velocity, yet asset owners that can absorb schedule risk and embed storage are capturing premium evening-peak revenues. Against this backdrop, hybrid solar-plus-storage configurations, virtual power-plant programs, and agrivoltaics pilots are widening deployment options across grid and land-use contexts, reinforcing the long-term competitiveness of the United States solar energy market.(1)U.S. Energy Information Administration, “Monthly Solar Photovoltaic Capacity Report,” eia.gov
Key Report Takeaways
- By technology, solar photovoltaic accounted for 99.22% of the United States solar energy market share in 2024, while thin-film and n-type crystalline PV are forecast to rise at a 12.4% CAGR through 2030.
- By grid type, on-grid systems held 98.3% of 2024 capacity; off-grid microgrids are advancing at a 22.1% CAGR to 2030.
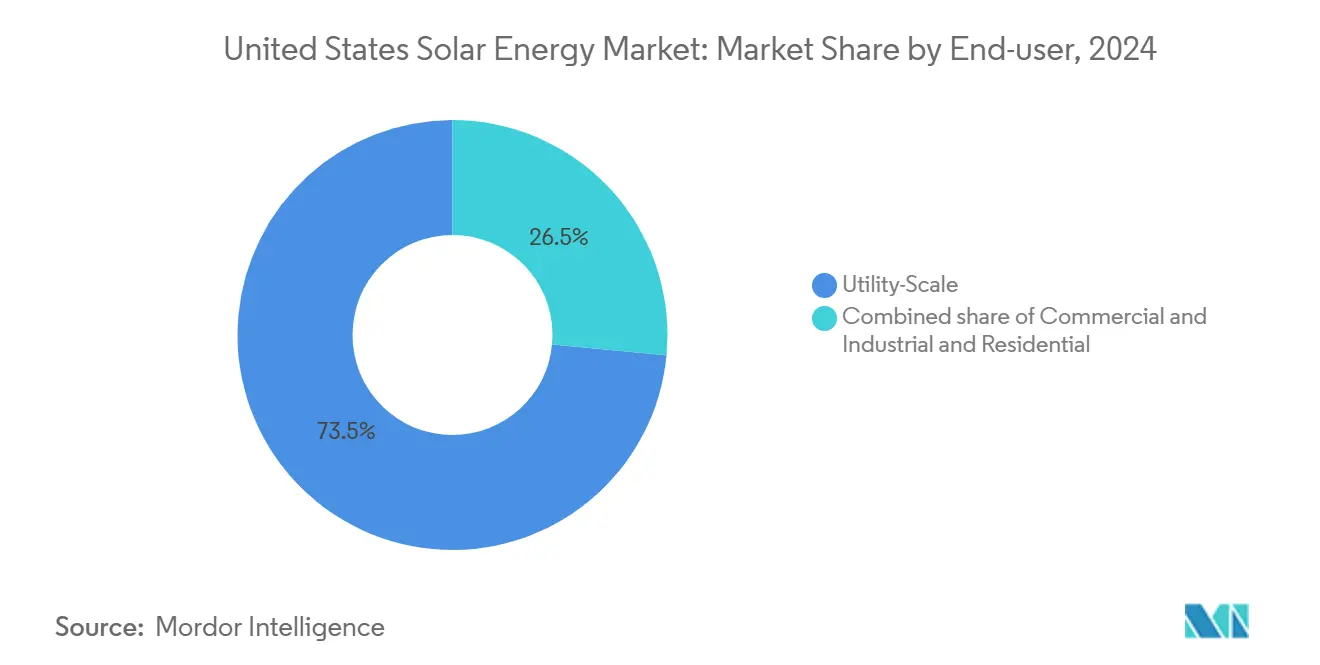
- By end-user, utility-scale assets commanded 73.5% of 2024 capacity, whereas the residential segment is expanding at a 19.7% CAGR through 2030.
United States Solar Energy Market Trends and Insights
Drivers Impact Analysis
| Driver | (~) % Impact on CAGR Forecast | Geographic Relevance | Impact Timeline |
|---|---|---|---|
| Inflation Reduction Act (IRA) Tax Incentives Accelerating Utility-Scale PPAs | 4.2% | National, with highest uptake in Texas, California, Florida, and energy-community designated regions | Medium term (2-4 years) |
| Grid-Edge Storage Pairing Enhancing Project Bankability | 2.8% | California, Texas, Arizona, Hawaii, with spillover to CAISO and ERCOT territories | Medium term (2-4 years) |
| Corporate Net-Zero Mandates Spurring C&I Power-Purchase Agreements | 1.9% | National, concentrated in tech-hub states (California, Texas, Virginia, Washington) and deregulated markets | Long term (≥4 years) |
| Domestic Manufacturing Credits Cutting Module Import Risk | 1.5% | National, with manufacturing hubs in Louisiana, Georgia, Ohio, Texas | Long term (≥4 years) |
| Community-Solar Programs Expanding Access in High-Population States | 1.2% | New York, Illinois, Maine, Massachusetts, Minnesota, with urban concentration | Medium term (2-4 years) |
| Agrivoltaics Improving Land-Use Economics in the Midwest | 0.6% | Midwest core (Minnesota, Iowa, Illinois, Wisconsin), early pilots in agricultural regions | Long term (≥4 years) |
| Source: Mordor Intelligence | |||
Inflation Reduction Act Tax Incentives Accelerating Utility-Scale PPAs
The 30% investment tax credit (ITC) and 2.6 ¢/kWh production tax credit (PTC) available under the Inflation Reduction Act (IRA) can be monetized within weeks via direct pay or transferable sale, eliminating the lengthy tax-equity negotiations that once delayed financial close. Bonus adders for domestic-content or energy-community siting lift the effective ITC to 50%, improving project internal rates of return by 12-15 percentage points relative to pre-IRA baselines.(2)U.S. Department of the Treasury, “Inflation Reduction Act Guidance,” treasury.gov More than 40.5 GW of new PV capacity came online in 2024, and over 280 GW of U.S. manufacturing announcements were tied to the law’s 10-year runway. Compliance with Davis-Bacon wage and apprenticeship rules increases reporting overhead, yet most large developers internalize the requirements to secure premium offtake terms with investor-owned utilities.
Grid-Edge Storage Pairing Enhancing Project Bankability
Four-hour lithium-ion battery costs fell to roughly USD 150/kWh by mid-2024, enabling 85% of all solar projects entering U.S. interconnection queues that year to include storage. The IRA extends the 30% ITC to standalone batteries above 3 kWh, opening retrofits of legacy solar farms; California’s Self-Generation Incentive Program and ERCOT’s ancillary-service premiums reinforce the cash flow stack. Transmission operators now model curtailed output scenarios with storage dispatch, trimming upgrade costs by as much as 30%.(3)Federal Energy Regulatory Commission, “2024 Electric Market Overview,” ferc.gov Lenders assign higher collateral value to hybrid assets because merchant, capacity, and ancillary-service revenues diversify the debt-service stream, lowering coverage-ratio thresholds.
Corporate Net-Zero Mandates Spurring C&I PPAs
Long-dated virtual PPAs now dominate corporate clean-energy procurement, with Meta, Amazon, and Google contracting 12.4 GW from 2020-2024. Investment-grade offtake lets developers secure non-recourse debt at spreads of 200-250 basis points over. Domestic-content attestations that unlock a 10-point IRA bonus are emerging as gating criteria in corporate RFPs, forcing developers to source modules from First Solar or Hanwha Q CELLS at a price premium that many mid-sized independent power producers cannot absorb. The commercial and industrial segment’s 19.7% CAGR forecast hinges on wider adoption of these virtual structures and continued access to low-cost financing.
Domestic Manufacturing Credits Cutting Module Import Risk
Section 45X advanced manufacturing credits pay USD 0.07/W for modules and USD 0.04/W for cells produced domestically, catalyzing the growth of U.S. PV manufacturing capacity from 7 GW in 2021 to 40 GW by Q3 2024. Section 301 tariffs on Chinese cells doubled to 50% in 2024, rendering imports up to 20% more expensive than U.S. counterparts once tax credits are included. A pending anti-dumping case covering Thailand, Vietnam, Malaysia, and Cambodia could add triple-digit duties by late 2025, so developers are front-loading 2025-2026 deliveries, tightening near-term supply, and elongating lead times to nearly a year.
Restraints Impact Analysis
| Restraint | (~) % Impact on CAGR Forecast | Geographic Relevance | Impact Timeline |
|---|---|---|---|
| Interconnection Queue Bottlenecks Increasing Lead-Times Beyond 36 Months | -2.3% | National, most acute in PJM, MISO, SPP; moderate in CAISO; less severe in ERCOT | Short term (≤2 years) |
| Rising Transmission Congestion Curtailing Southwest Utility Projects | -1.8% | Southwest core (California, Arizona, Nevada), with spillover to New Mexico and Southern California desert regions | Short term (≤2 years) |
| Section 201/301 Trade Actions Causing Module-Price Volatility | -1.6% | National, with highest impact on developers lacking domestic supply agreements; affects import-dependent markets | Medium term (2-4 years) |
| Skilled-Labor Shortage Inflating EPC Costs by >18% YoY | -1.4% | National, with highest wage pressure in California, Northeast, and union-dense markets; moderate in Southeast | Medium term (2-4 years) |
| Source: Mordor Intelligence | |||
Interconnection Queue Bottlenecks Increasing Lead-Times Beyond 36 Months
Roughly 2,600 GW of generation and storage projects sat in U.S. queues at the end of 2024, and only 19% historically reached commercial operation. Median wait times stretched to five years, up from two years in 2015, due to complex cluster studies and contested cost allocation for network upgrades. Order 2023 raises deposits and site-control thresholds to discourage speculation, but initial results reveal longer, not shorter, study cycles as operators digest the rule change. Developers now price 24-36 month interconnection contingencies into PPAs, lifting levelized energy costs by 3-5% and rendering marginal projects uneconomic.
Skilled-Labor Shortage Inflating EPC Costs by >18% YoY
The U.S. solar workforce totaled 279,000 jobs in 2023, yet meeting 2035 deployment goals requires roughly 900,000 workers, implying a 620,000-person shortfall. Median installer wages climbed to USD 48,690 in 2023 as contractors competed with commercial-construction and oil-and-gas employers. Prevailing-wage provisions inflate hourly rates by up to 40%, and limited apprenticeship programs in rural counties make compliance challenging. Robotics and drone inspections can cut on-site labor hours by 10-15%, but high capital cost confines adoption to 100 MW-plus projects.
Segment Analysis
By Technology: Efficiency Gains Propel Photovoltaic Dominance
Solar PV installations represented 99.22% of 2024 capacity, and the segment will continue to expand at a 12.4% CAGR through 2030 as n-type TOPCon and heterojunction cells exceed 25% efficiency. First Solar’s Series 7 cadmium-telluride module reached a 24.1% aperture-area record in 2024, shrinking the gap with crystalline silicon and excelling in high-temperature zones such as Arizona.(4)First Solar, “Series 7 Product Brochure,” firstsolar.comBifacial modules captured 40% of utility builds and boosted annual energy yield up to 30% when paired with reflective surfaces. Concentrated solar power now accounts for less than 1% of the United States solar energy market and has no new plants under construction, as PV-plus-storage delivers comparable dispatchability at half the cost.
Perovskite-silicon tandem cells hit 33.9% lab efficiency and could enter commercial production by 2027 pending durability gains. Manufacturers are embracing n-type wafers that tolerate higher polysilicon impurity levels, trimming feedstock cost by up to 12%. These improvements anchor the competitive edge of the United States solar energy market and intensify the learning-curve effect that keeps levelized costs trending downward.

Note: Segment shares of all individual segments available upon report purchase
Get Detailed Market Forecasts at the Most Granular Levels
Download PDF
By Grid Type: Off-Grid Microgrids Extend Reach
On-grid projects made up 98.3% of 2024 capacity, but off-grid microgrids are scaling at a 22.1% CAGR as remote communities pursue resilience. Alaska villages installed 12 MW of solar-diesel hybrids in 2024, cutting fuel shipments by nearly one-third. Puerto Rico’s post-hurricane rebuild delivered more than 50,000 residential solar-plus-storage systems between 2022-2024, reducing outage vulnerability. Federal grants totaling USD 150 million under the DOE Microgrid Program back advanced inverters capable of black-start operation, giving isolated grids local restart capabilities after extreme weather. Although the off-grid base remains below 2% of the United States solar energy market size, its high growth rate signals demand for tailored solutions in remote or disaster-prone regions.
Utility interconnection rules increasingly favor hybrid on-grid assets; batteries can curtail midday overgeneration and release power after sundown, mitigating negative pricing events in California and Texas. This operational flexibility strengthens project cash flows and underpins the broader expansion of the United States solar energy market.
By End-User: Residential Upswing Tied to Storage and VPPs
Utility-scale farms held 73.5% of 2024 installed capacity, yet residential systems are forecast to post a 19.7% CAGR to 2030 as battery attachment rates surpass 90% in states with reformed net-metering. California’s NEM 3.0 slashed export compensation, but time-of-use rates that peak above USD 0.50/kWh drive homeowners to self-consume solar production and capitalize on storage-based arbitrage. Virtual power-plant programs run by Sunrun and Tesla aggregated more than 1.3 million batteries in 2024, dispatching 200 MW during heatwaves and earning participants USD 200-500 per year in grid-service payments.
The commercial and industrial arena benefits from direct-pay provisions that let tax-exempt entities monetize credits, lifting municipal and school-district adoption. Hybrid designs featuring four-hour batteries secure capacity payments in PJM and ISO-NE, bolstering the United States solar energy market size for this customer class. Any rollback of federal tax credits or expanded net-metering cuts could temper residential growth, but current policy signals support for sustained expansion.
Note: Segment shares of all individual segments available upon report purchase
Get Detailed Market Forecasts at the Most Granular Levels
Download PDF
Geography Analysis
Texas, California, and Florida accounted for 58% of 2024 additions, yet policy, land-use, and grid conditions drive divergent growth paths. Texas led with 8.2 GW, aided by ERCOT’s streamlined 12-18-month queue and merchant-friendly energy-only market, attracting corporate PPAs from data-center operators. California followed with 6.1 GW despite a 39% plunge in residential demand post-NEM 3.0; utility-scale pipeline momentum in the Mojave Desert offset rooftop weakness. Florida added 5.3 GW on the back of vertically integrated utilities hedging gas price volatility through large-scale solar procurement.
The Southwest faces rising curtailment. California dispatched 2.6 million MWh of unused renewables in 2023, highlighting the need for 3,000 miles of new high-voltage lines to unlock projected capacity. Midday prices in ERCOT and CAISO routinely dipped below zero in 2024, steering developers toward hybrid plants that shift output to evening peaks. The Midwest added 2.1 GW in 2024 on the strength of Illinois community-solar programs and agrivoltaic pilots that generate both power and crop revenue, boosting land-use efficiency by 60%.(5)Illinois Power Agency, “Adjustable Block Program 2024,” illinois.gov The Northeast installed 1.8 GW as New York pushes toward a 10 GW community-solar target. Off-grid projects in Alaska, Hawaii, and Puerto Rico, though representing less than 1% of capacity, deliver outsized resilience benefits and double-digit growth, while the DOE’s Grid Deployment Office earmarked USD 2.5 billion in 2024 for transmission build-out that will ultimately determine regional deployment ceilings.
Competitive Landscape
Module manufacturing has re-concentrated under the IRA, with First Solar, Hanwha Q CELLS, and Canadian Solar commissioning multi-GW U.S. fabs to capture USD 0.07/W 45X credits. First Solar’s thin-film process, integrated from ingot to module, satisfies domestic-content requirements sought by corporate buyers and secures multi-year supply contracts with NextEra and 8minute Solar. Independent power producers such as NextEra Energy Resources, Brookfield Renewable, and EDF Renewables leverage scale to absorb interconnection delays; NextEra alone added 3.3 GW in 2024 and targets up to 11 GW annually through 2027. EPC firms SOLV Energy, Mortenson, and Rosendin differentiate through labor-productivity improvements that mitigate wage inflation topping 18% year over year.
Trackers remain a two-horse race: Array Technologies and Nextracker hold more than 70% combined share and push terrain-following designs that boost yield 15-20%. Inverters follow a similar consolidation; Enphase dominates residential microinverters, while SMA Solar leads utility-scale string and central categories, both advancing grid-forming firmware to integrate storage. SunPower’s 2024 bankruptcy illustrates the difficulty mid-cap installers face amid policy swings and rising interest rates. White-space opportunities revolve around adding batteries to existing PV sites to monetize the standalone-storage credit and participate in ancillary-service markets, a trend that reinforces the competitive moat of players with strong balance sheets.
United States Solar Energy Industry Leaders
-
First Solar Inc.
-
NextEra Energy Inc.
-
Hanwha Q CELLS USA
-
Canadian Solar Inc.
-
Tesla Energy
- *Disclaimer: Major Players sorted in no particular order
Need More Details on Market Players and Competitors?
Download PDF
Recent Industry Developments
- June 2025: AES, Clearway Energy, Cypress Creek Renewables, and D.E. Shaw created a USD 6 billion U.S. Solar Buyers Consortium to procure 7 GW of modules annually and double domestic output.
- April 2025: Boviet Solar opened a North Carolina plant worth USD 294 million, launching 2 GW of initial capacity with plans to reach 4 GW.
- March 2025: Entergy and NextEra Energy Resources agreed to co-develop up to 4.5 GW of solar and storage assets.
- February 2025: TPG acquired Altus Power for USD 2.2 billion, securing the nation’s largest commercial-scale solar portfolio.
United States Solar Energy Market Report Scope
Solar energy is the energy obtained from the sun's rays converted into thermal or electrical energy. It is the cleanest form of energy that is abundant in nature. Solar energy is harnessed by photovoltaics, heating & cooling, and concentrated solar power. Due to the development of resilient technology, today, solar energy is mainly used to generate electricity by various consumers, including residential, industrial, and commercial.
The United States' solar energy market is segmented by technology type. By technology type, the market is segmented into Solar Photovoltaic (PV) and Concentrated Solar Power (CSP). By grid type, the market is segmented into On-grid and off-grid. By end-user, the market is segmented into Utility-Scale, Commercial and Industrial, and Residential. For each segment, the market sizing and forecasts have been done based on installed capacity (GW).
By Technology
| Solar Photovoltaic (PV) |
| Concentrated Solar Power (CSP) |
By Grid Type
| On-Grid |
| Off-Grid |
By End-User
| Utility-Scale |
| Commercial and Industrial (C&I) |
| Residential |
By Component (Qualitative Analysis)
| Solar Modules/Panels |
| Inverters (String, Central, Micro) |
| Mounting and Tracking Systems |
| Balance-of-System and Electricals |
| Energy Storage and Hybrid Integration |
| By Technology | Solar Photovoltaic (PV) |
| Concentrated Solar Power (CSP) | |
| By Grid Type | On-Grid |
| Off-Grid | |
| By End-User | Utility-Scale |
| Commercial and Industrial (C&I) | |
| Residential | |
| By Component (Qualitative Analysis) | Solar Modules/Panels |
| Inverters (String, Central, Micro) | |
| Mounting and Tracking Systems | |
| Balance-of-System and Electricals | |
| Energy Storage and Hybrid Integration |
Need A Different Region or Segment?
Customize Now
Key Questions Answered in the Report
How large is the United States solar energy market in 2025?
The market reached 228.21 GW of installed capacity in 2025.
What is the forecast CAGR for U.S. solar installations through 2030?
Annual capacity is expected to grow at a 12.34% CAGR from 2025-2030.
Which segment is expanding fastest?
Residential systems are forecast to rise at a 19.7% CAGR, driven by high battery-attachment rates and virtual power plants.
How will the IRA affect solar manufacturing?
Section 45X credits of up to USD 0.07/W are driving U.S. module capacity from 7 GW in 2021 to 40 GW by 2024.
What is the main restraint on new projects?
Interconnection queues now average five-year wait times, delaying many utility-scale builds.
Why are hybrid solar-plus-storage projects gaining popularity?
Four-hour batteries shift generation to high-value evening peaks, capture capacity payments, and qualify for the standalone storage ITC.
Page last updated on:


