
Market Overview
| Study Period | 2019 - 2031 |
|---|---|
| Forecast Data Period | 2026 - 2031 |
| Base Year Market Size (2025) | USD 5.83 Billion |
| Market Size (2026) | USD 6.25 Billion |
| Market Size (2031) | USD 8.82 Billion |
| Growth Rate (2026 - 2031) | 7.13 % |
| Market Concentration | Medium |
Major Players *Disclaimer: Major Players sorted in no particular order Image © Mordor Intelligence. Reuse requires attribution under CC BY 4.0. | |
United States School Bus Market Analysis by Mordor Intelligence
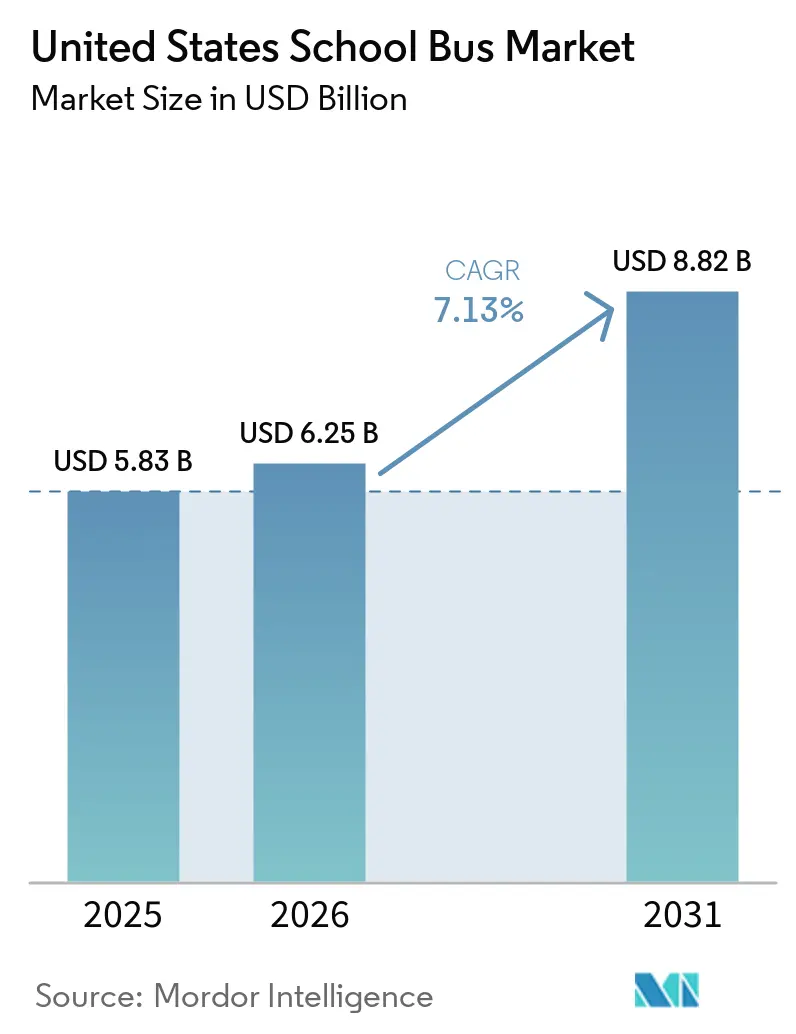
The United States school bus market size was valued at USD 5.83 billion in 2025 and estimated to grow from USD 6.25 billion in 2026 to reach USD 8.82 billion by 2031, at a CAGR of 7.13% during the forecast period (2026-2031). Rapid electrification incentives, a swelling backlog of older vehicles, and new seat-belt regulations are shortening replacement cycles and keeping annual procurements on an upward trajectory. Competitive pressure is mounting as electric-only manufacturers enter with bundled charging and finance packages that compress margins for legacy OEMs. Depot microgrids are lowering the total cost of ownership and are quickly becoming a standard specification in Sun Belt states, while rural infrastructure deficits continue to hamper adoption in large sections of the Great Plains. Fleet operators are tapping into vehicle-to-grid programs, generating annual grid-services revenue per bus. This revenue boost is notably shortening the payback period for premium battery platforms.
Key Report Takeaways
- By design type, Type C buses led with 79.12% of the United States school bus market share in 2025, and will continue to expand at a 9.02% CAGR.
- By powertrain type, internal-combustion powertrains held 88.35% share of the United States school bus market size in 2025, yet hybrid and electric models are forecast to generate the fastest growth with 36.45% CAGR.
- By ownership model, district-owned fleets commanded 69.15% of deployments in 2025, while contractor-owned models exhibit the highest projected CAGR at 8.02% through 2031.
- By seating capacity, buses with 30 to 60 passengers accounted for 58.04% share in 2025, but sub-30-seat units led growth at 8.58% CAGR as flexible routing gained traction.
Note: Market size and forecast figures in this report are generated using Mordor Intelligence’s proprietary estimation framework, updated with the latest available data and insights as of 2026.
United States School Bus Market Trends and Insights
Drivers Impact Analysis*
| Driver | (~) % Impact on CAGR Forecast | Geographic Relevance | Impact Timeline |
|---|---|---|---|
| EPA Clean School Bus Program | +2.1% | National, highest in Title I and tribal districts | Short term (≤ 2 years) |
| Aging Fleet Above 11 Years | +1.8% | National, acute in Midwest and Northeast | Medium term (2-4 years) |
| On-board Safety Mandates | +1.3% | Nation-wide FMVSS 222 compliance | Medium term (2-4 years) |
| Low-NOx “Other Fuels” Demand | +0.9% | California, Texas, Northeast non-attainment zones | Long term (≥ 4 years) |
| Vehicle-to-Grid Revenue | +0.7% | California, New York, PJM states | Long term (≥ 4 years) |
| Depot Micro-grid and Solar Pairing | +0.6% | Sun Belt states with net-metering | Long term (≥ 4 years) |
| Source: Mordor Intelligence | |||
Federal Funding Surge via EPA Clean School Bus Program
Congress allocated USD 5 billion over five years (FY 2022–2026) to accelerate fleet electrification, and the third funding round in September 2024 awarded USD 965 million in rebates that cover a notable share of the diesel-to-electric price gap [1]. The incentive structure is heavily skewed toward zero-emission vehicles, prompting districts to compress traditional 10-year replacement cycles into 3-to-5-year windows. Equity provisions direct a disproportionate share of rebates to high-need rural and tribal communities, broadening the customer base for manufacturers. OEM order books now stretch up to 24 months, signalling sustained demand momentum through 2027. The funding cadence also gives financing partners long-term visibility, spurring new depot-as-a-service offerings that anchor the United States school bus market.
Aging National Fleet (Above 11 yrs) Pushing Replacement Demand
By 2024, a significant portion of the United States school buses surpassed the 11-year mark, a consequence of deferred spending following the 2008-2012 recession. Maintenance on these aging buses has become increasingly costly, prompting many to consider accelerated scrappage. Issues like rust-belt corrosion, diesel particulate filter failures, and frame fatigue are leading to emergency retirements, especially in states like Ohio, Michigan, and Pennsylvania. A thriving market for used buses has emerged, with resale values potentially offsetting a substantial portion of the added costs for districts transitioning to battery models. This demographic surge provides a buffer, shielding the United States school bus market from fluctuations in enrollment.
Stringent On-board Safety Mandates Accelerating Fleet Renewal
NHTSA updated FMVSS 222 to mandate lap-shoulder belts on buses sold post model-year 2027. This ruling is expected to favor new units over retrofits. While eight pioneering states have already mandated these belts, the federal ruling curtails the availability of previously offered, lower-cost configurations. In anticipation of the 2027 deadline, districts are accelerating their orders, leading to a pre-buy surge that benefits OEMs with limited capacity. Additionally, the mandate is driving up demand for driver-assistance features that integrate more smoothly into electric platforms, further bolstering the United States school bus market.
Low-NOx “Other Fuels” Demand in Non-attainment Counties
In 2024, the EPA added more counties to its ozone non-attainment list, intensifying compliance scrutiny across numerous localities. Districts in California’s Central Valley, the Texas Gulf Coast, and the Northeast corridor are turning to propane and CNG buses to achieve low-NOx targets, especially where grid capacity is limited. In 2024, Texas allocated funds from Volkswagen settlement resources for propane conversions, covering a significant portion of the incremental costs. While propane produces less NOx than diesel, providing a short-term compliance advantage, it's noteworthy that incentives for zero-emissions now far surpass those for alternative fuels. As a result, while propane and CNG serve as crucial transitional technologies, they haven't diverted the United States school bus market from its electrification path.
Restraints Impact Analysis*
| Restraint | (~) % Impact on CAGR Forecast | Geographic Relevance | Impact Timeline |
|---|---|---|---|
| Rural Charging Infrastructure | -1.4% | Great Plains, Appalachia, Rocky Mountains | Medium term (2-4 years) |
| Upfront Cost of E-Buses | -1.1% | National, intense in low-bond districts | Short term (≤ 2 years) |
| Scarcity of Maintenance Technicians | -0.8% | National, more severe in rural areas | Long term (≥ 4 years) |
| Chassis Supply Bottlenecks | -0.6% | Nation-wide, all OEMs using Navistar-PACCAR | Short term (≤ 2 years) |
| Source: Mordor Intelligence | |||
Sparse Rural Charging Infrastructure
Rural districts are compelled to invest in oversized battery packs, as many non-metropolitan counties find themselves without a DC fast-charging station within a reasonable distance. The situation is exacerbated by sub-zero winters, which can significantly diminish the bus range. Moreover, local substations frequently provide less than half of the power required for a depot servicing a full fleet of buses. While federal NEVI funds focus on highway corridors, they largely overlook funding for last-mile depot access. Upgrading the grid can involve substantial costs, hindering rural electrification efforts and dampening growth prospects for the United States school bus market, especially in areas beyond urban and suburban locales.
High Upfront Cost of E-Buses Despite Incentives
In 2025, battery-electric buses were significantly more expensive than their diesel counterparts, creating a substantial cost gap even after accounting for rebates. Financing becomes intricate due to municipal bond covenants and unpredictable residual values, a challenge heightened for districts operating with fewer than 50 buses. Companies like Highland Electric and Zum offer 'bus-as-a-service' contracts, allowing districts to shift capital expenditures off their balance sheets. However, these contracts only capture a portion of the potential savings over the bus's lifecycle. Even post-warranty, battery replacements remain costly. Coupled with a limited secondary market that depresses resale values, these financial dynamics slow the pace of adoption in the United States school bus market. The momentum is likely to pick up only when battery prices decrease or financing practices undergo a transformation.
*Our forecasts treat driver/restraint impacts as directional, not additive. The impact forecasts reflect baseline growth, mix effects, and variable interactions.
Segment Analysis
By Design Type – Conventional Dominance Persists
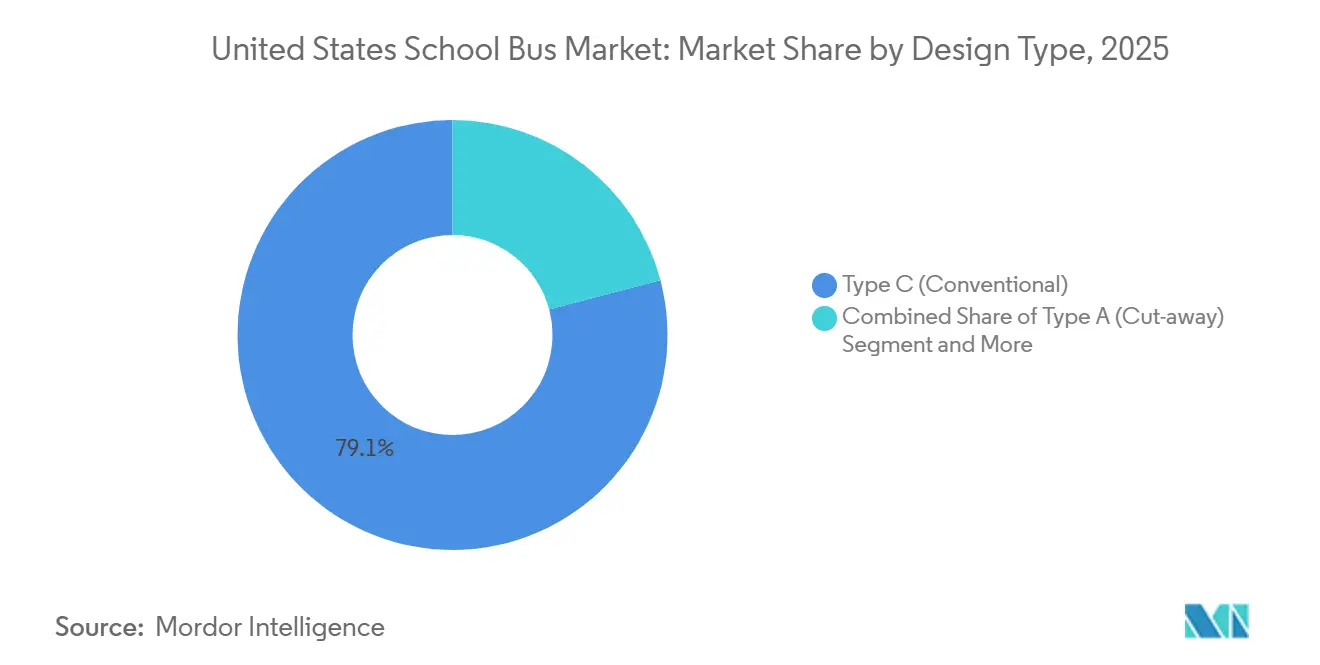
Type C conventional buses accounted for 79.12% of 2025 deliveries and are projected to expand faster than the wider United States school bus market at a 9.02% CAGR through 2031. Their 54-84 passenger capacity, maneuverability, and front-engine design suit the mixed-density routes common in suburban districts. Electric conversions are easier on Type C frames, requiring smaller battery packs and offering better cold-weather performance than rear-engine Type D models.
Type D transit buses hold a nominal share and dominate dense urban corridors where routes exceed 80 passengers. The steep price premium and depot space limitations constrain broader uptake. Type A cutaways, with under-30-seat layouts, fill rural and special-needs niches and will grow at a notable CAGR. Their commercial van chassis improves fuel economy and lowers maintenance costs, providing an attractive entry point for small districts transitioning to alternative energy. Design diversification, therefore, underpins steady growth within the United States school bus market.

By Powertrain Type – Electrification Redefines Economics
Hybrid and electric units are forecast to grow at a 36.45% CAGR through 2031, although internal-combustion engines retained 88.35% of the United States school bus market share in 2025. The premium price tag on electric powertrains is narrowing as federal rebates stack with state incentives, especially in California and New York. Electric deployments increased in coastal states that have firm zero-emission deadlines, while diesel remains entrenched in the Southeast and Great Plains due to cheaper fuel and limited charging infrastructure. Renewable diesel compatibility and advanced emissions after-treatment are extending the runway for traditional engines, offering a bridge strategy where grid readiness lags.
Electric bus makers are clustering production in the Midwest to capture Buy America credits, and battery suppliers are co-locating to minimize logistics costs. Lion Electric's Joliet plant aims for significant annual output, hinting at potential scale efficiencies that might reduce acquisition costs by 2028. In response, diesel offerings have introduced duty-cycle-optimized engines, achieving a notable reduction in particulate emissions and compatibility with hydrotreated vegetable oil. Meanwhile, hybrids are becoming less relevant as districts leap directly to zero-emission technologies. This shift not only maximizes incentive capture but also channels investments into battery platforms, bolstering the overall momentum of the United States school bus market.
By Ownership Model – Outsourcing Gains Momentum
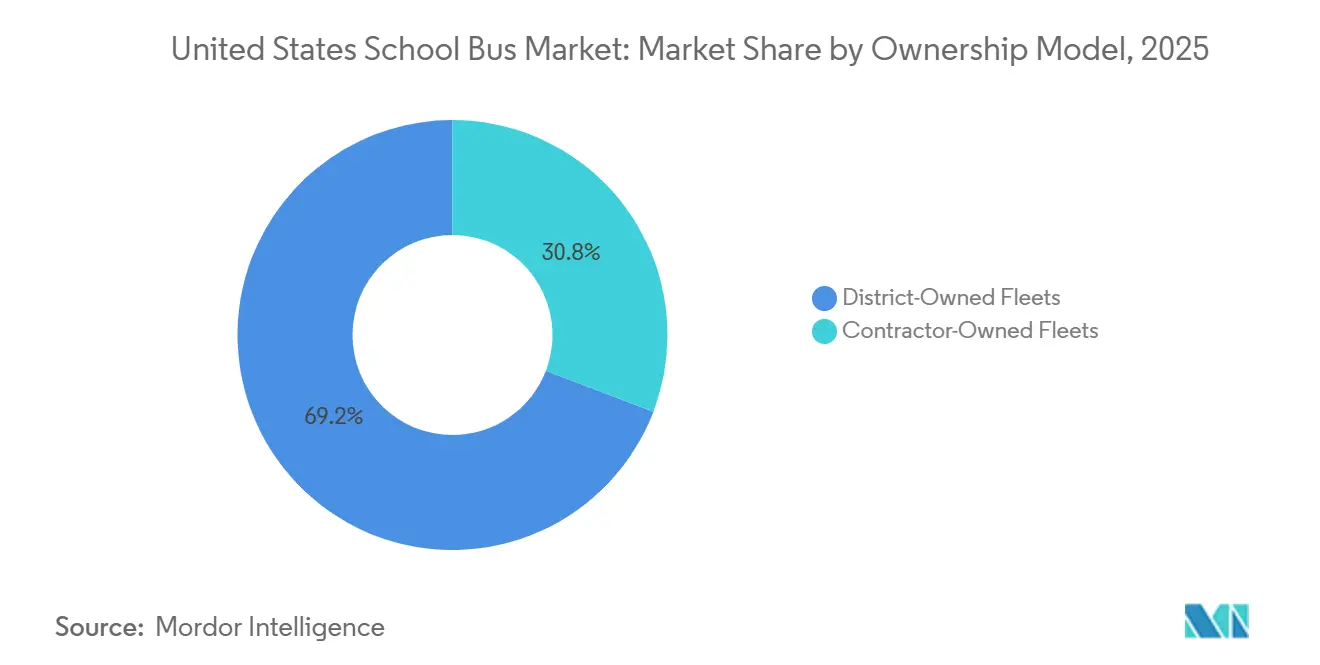
District ownership still dominates with 69.15% share, yet contractor-run fleets will expand at an 8.02% CAGR as electrification complexity and capital needs rise. Third-party operators bundle vehicles, infrastructure, and maintenance into fixed-price contracts, shifting technology and residual-value risk off district balance sheets. The model is particularly attractive for fleets under 50 buses, which lack scale for in-house technicians and tools.
Large districts continue to favor outright ownership to maintain control over scheduling, union labor, and vehicle-to-grid revenue streams. Hybrid models are emerging in which districts use EPA rebates to buy assets but outsource charging operations. This mix-and-match approach lets budgets stretch further while still leveraging private-sector expertise, broadening participation in the United States school bus industry, and supporting steady demand across ownership structures.
By Seating Capacity – Flexible Routing Lifts Small-Bus Demand
Buses seating 30-60 students captured 58.04% of 2025 revenue, mirroring the average route profile and anchoring the baseline of the United States school bus market size. Dynamic routing software is enabling sub-30-seat fleets that reduce deadhead miles by up to 15%, spurring 8.58% CAGR growth for this category. Federal IDEA reimbursements make small buses financially attractive for special-needs transport, while rural districts trim operating costs by shifting low-density routes to compact platforms.
High-capacity units above 60 seats hold a nominal share, primarily in metropolitan systems with driver shortages. Electric battery weight currently reduces seating by 4-6 spots compared with diesel equivalents, nudging some districts toward larger chassis to retain route efficiency. Advances in lithium-iron-phosphate chemistry could reclaim lost capacity by 2027, aligning electric models with historical diesel benchmarks and strengthening the overall competitiveness of the United States school bus market.
Geography Analysis
In the United States school bus market, states with assertive climate policies are driving growth. California, New York, and Maryland collectively accounted for a significant portion of the 2025 electric bus deliveries, capitalizing on state and utility incentives layered atop federal rebates. California’s Air Resources Board mandates 100% zero-emission school bus purchases by 2035 and offers significant bus grants that narrow the capital gap [2]. The Mid-Atlantic region leverages PJM capacity markets for lucrative V2G revenue, improving paybacks for densely scheduled fleets.
The Midwest is becoming a hotspot for bus replacements, driven by aging fleets and frame-corrosion challenges. In Ohio, Michigan, and Illinois, buses have been in service for significantly longer than the national median. To secure better pricing, state transport departments are now consolidating bulk orders, achieving scale efficiencies that draw in OEMs. While diesel remains prevalent in these states, the rise of depot microgrid installations is slashing electricity expenses, swaying procurement committees towards battery units.
In contrast, the rural regions of the Great Plains and Rockies are trailing in the electrification race. In states like Montana, Wyoming, and North Dakota, sparse fast-charging stations, limited substation capacities, and extensive routes keep diesel's market share dominant. Although federal corridors backed by NEVI promise enhanced interstate coverage by 2028, last-mile depot connections still lack funding. While propane and CNG serve as temporary compliance solutions, rebate disparities position them as a transitional phase rather than a long-term solution in the United States school bus landscape.
Regulatory Landscape
The United States school bus market operates under a dual framework of federal safety compliance and emissions and funding programs. Safety requirements are governed primarily through NHTSA-administered Federal Motor Vehicle Safety Standards (FMVSS), while air-quality compliance and fleet modernization are increasingly shaped by EPA programs and state-level clean-transport mandates. The EPA Clean School Bus Program, authorized at USD 5 billion over FY 2022-2026 under the Infrastructure Investment and Jobs Act, has become a central procurement lever for districts and contractors.
In 2026, EPA signaled program changes and tighter oversight, including a February 2026 information-gathering push to refine implementation and broaden the technology set considered under the program. The same 2026 activity also highlighted that alternative-fuel pathways beyond battery-electric are being formally evaluated alongside the safety-driven compliance cycle. This reinforces a regulatory environment where districts need to align bus replacement timing with evolving federal grant rules, Buy America considerations, and state purchase deadlines.
Value Chain Analysis
The value chain in the United States school bus market runs from chassis and body manufacturing to powertrain and component supply (including engines, battery systems, thermal management, and electronics), then moves through upfitting and validation, dealer distribution, and fleet operations supported by service, parts, and telematics. As electrification increases supply-chain complexity, upstream dependencies extend into critical-minerals sourcing for batteries, charger and depot electrical work, and end-of-life battery handling and recycling. Downstream requirements also expand to include technician training, plus ongoing software and diagnostics support.
OEMs and platform owners are reshaping integration points across the chain to secure capacity and meet compliance needs. Blue Birds April 2026 full consolidation of the Micro Bird joint venture (with production in Plattsburgh, New York) illustrates how manufacturers are moving toward tighter control of Type A platforms and Buy America-aligned supply, while also strengthening procurement leverage across shared components, dealers, and aftersales networks. That shift raises the importance of supplier qualification, domestic content planning, and service coverage, particularly for districts that procure through multi-year contracts and require turnkey support for alternative-fuel deployments.
Competitive Landscape
In 2025, Blue Bird, Thomas Built, and IC Bus dominated the United States school bus market, collectively accounting for a significant portion of the output. Blue Bird, leveraging vertical integration at its Georgia facility, boasts a competitive edge with efficient lead times for electric deliveries. Meanwhile, Thomas Built, harnessing Daimler’s ePowertrain and Proterra batteries, secured a strong foothold in California’s electric orders for 2025 and is positioning its Jouley platform for broader national expansion. IC Bus, while transitioning its CE Series from diesel and propane to electric, is still grappling with initial subscale volumes.
New electric players are challenging established leaders. Lion Electric, with robust financial backing, is ramping up its Joliet plant's capacity to meet growing demand [3]. GreenPower's competitively priced EV Star Type A is not only undercutting its competitors but also zeroing in on the rural special-needs market. BYD Motors USA, capitalizing on its in-house battery production for cost control, has gained traction in California's 2025 electric bus awards. However, its eligibility for federal funding is curtailed due to Buy America compliance constraints. Meanwhile, Collins and Micro Bird, specializing in propane and CNG niches, are adeptly navigating the market by emphasizing low-NOx compliance in non-attainment counties, ensuring steady demand amidst the electric transition.
Strategic alliances are becoming pivotal in shaping competitive advantages. For instance, Thomas Built collaborated with Proterra to engineer battery packs tailored for frequent stop-and-go cycles. Concurrently, IC Bus forged a partnership with ABB, rolling out high-capacity chargers throughout its dealer network. School districts are now prioritizing vendors that offer comprehensive ecosystems—encompassing vehicles, chargers, financing, and software—over mere chassis specifications. This shift underscores a broader industry trend: a sprint towards holistic solutions that not only elevate switching costs but also bolster market share within the United States school bus arena.
United States School Bus Industry Leaders
-
Blue Bird Corporation
-
Collins Bus Corporation
-
Navistar Inc. (IC Bus)
-
Lion Electric Company
-
Daimler Truck North America LLC (Thomas Built)
- *Disclaimer: Major Players sorted in no particular order

Market Opportunities and Future Outlook
Program-design changes and broader technology eligibility create room for OEMs and suppliers that can offer compliance-ready alternatives beyond battery-electric in districts facing charging and grid constraints. EPA activity in 2026, including an RFI that closed in April 2026, explicitly gathered input on a wider set of technologies and fuels (such as biofuels, CNG/LNG, and hydrogen). This supports opportunities for low-NOx and alternative-fuel school bus offerings in non-attainment areas and rural routes where infrastructure timing remains a constraint.
Product and capability expansion also point to near-term openings in diversified powertrains, connected fleet services, and Buy America-compliant supply. In July 2026, IC Bus broadened its CE Series lineup to include a gasoline option using the Cummins B6.7 Octane engine, which strengthens the case for fleets seeking an operational bridge between diesel and zero-emission adoption. On the manufacturing side, Blue Birds consolidation of Micro Bird (completed April 2026) increases vertical control of Type A capacity and positions the combined footprint to serve districts that prioritize domestic sourcing and simplified vendor management. At the same time, service-centric offerings (telematics, diagnostics, and bundled maintenance support) target technician shortages and uptime requirements.
Recent Industry Developments
- July 2026: New Flyer (NFI Group) Westchester County DPW and Transportation placed a firm order for 116 hybrid-electric and Xcelsior hybrid-electric buses for the Bee-Line system. The move demonstrates near-term public fleet electrification demand and strengthens New Flyers position in U.S. urban transit upgrades.
- October 2025: Blue Bird Corporation Guilford County Schools in North Carolina unveiled 10 new 2025 Blue Bird Vision Propane school buses. The propane deployment signals continued diversification into alternative fuels and expands Blue Birds dealer and service footprint.
- October 2025: Collins Bus Corporation Forest River expanded its Field Sales team to strengthen dealer support and customer relationships nationwide. Collins Bus notes the expansion improves market reach and after sales capability across districts.
Research Methodology Framework and Report Scope
Market Definition and Coverage
This market covers the revenue generated from school buses used to transport students in the United States, counted at the vehicle level across new bus sales and replacement demand over the study period.
Scope exclusions: We exclude yellow-bus operations and contracting revenues (student transportation services), along with non-student shuttle buses and general city transit buses.
Segmentation Overview
- By Design Type
- Type A (Cut-away)
- Type B
- Type C (Conventional)
- Type D (Transit-Style)
- By Powertrain Type
- Internal Combustion Engine (IC Engine)
- Hybrid and Electric
- By Ownership Model
- District-Owned Fleets
- Contractor-Owned Fleets
- By Seating Capacity
- Less than 30 Seats
- 30-60 Seats
- Above 60 Seats
Data Sources, Market Sizing, and Validation
Desk Research
Desk research was used to build the fact base around fleet size, replacement cycles, and regulation-driven safety and emissions requirements that shape ordering behavior. We referred to public sources such as the National Center for Education Statistics (NCES), Federal Highway Administration (FHWA) highway statistics, EPA rules and program pages for diesel and electric vehicle emissions, and National Highway Traffic Safety Administration (NHTSA) school bus safety standards. For demand signals, we also reviewed public procurement portals and award notices, plus state or district transportation summaries where they were published.
To translate these signals into a workable market model, we cross-checked OEM and supplier disclosures in annual reports, investor materials, and press releases that discuss production, order books, and pricing movements. We also used paid subscriptions for company financials and intelligence, news and financials tracking, and selected contract and tender datasets to confirm the timing of large fleet orders. The desk sources listed here are illustrative only, and many other public documents and datasets were reviewed to collect data, validate assumptions, and resolve gaps.
Primary Interviews and Surveys
Primary interviews and surveys were used to pressure-test how quickly districts replace buses, what typically triggers a purchase (age, mileage, safety upgrades, emissions rules), and how prices are moving by bus type and powertrain. We spoke with a mix of OEM-side participants, dealers, fleet operators, and district-level transportation stakeholders across the United States to align desk findings with real buying and delivery patterns.
Distribution of primary research fieldwork respondents
| Company type | Respondent position |
|---|---|
| Top tier: 26% | CXOs: 12% |
| Mid tier: 58% | Functional/Unit leaders: 31% |
| Smaller Players: 16% | Managers: 57% |
Market-Sizing & Forecasting
Sizing starts with a top-down reconstruction that links the active school bus fleet and annual replacement needs to observed procurement activity and typical delivery lead times, then converts units into value using year-specific pricing. To keep totals realistic, we corroborated the result with selective bottom-up checks, such as sampled bid prices, a roll-up of announced district orders, and channel feedback on units delivered versus ordered.
A few inputs that matter a lot in this market were tracked closely, including fleet age distribution and retirement thresholds, the share of purchases tied to grant-funded clean bus programs, average seating capacity and body type mix, and the price premium trend for electric or alternative-fuel buses versus diesel. We also monitored parts and chassis availability signals that can shift deliveries between years, which then impacts annual market value.
Forecasting was run using scenario analysis, because policy funding, charging readiness, and delivery constraints can change adoption speed in a non-linear way. Where the bottom-up checks had holes, we filled gaps using conservative penetration assumptions anchored to interview ranges, and then adjusted only when supported by procurement evidence.
Data Validation & Update Cycle
Model outputs were validated through cross-checks against independent indicators such as public district spend totals, fleet counts, and visible order announcements, and then reviewed for year-to-year spikes that did not match delivery reality. If variance was seen in a state or bus type, we revisited the assumptions and, when needed, re-contacted interviewees to confirm whether the shift was real or timing-related.
Each report goes through multi-step analyst reviews before sign-off, including consistency checks on units, prices, and implied replacement rates. The study is refreshed annually, and interim updates are made when material events occur, such as major funding changes or emissions-related deadlines. Before delivery, we do a final pass so the numbers reflect the latest available signals.
Mordor Intelligence's United States School Bus Market Size Measured Against Other Published Estimates
Published market sizes for US school buses often look different because authors count different things, use different year pricing, and sometimes mix vehicles with transportation services. In our work, we keep the demand pool and the pricing logic traceable to real fleet replacement and purchasing behavior.
Student transportation service revenues sit outside Mordor Intelligence's scope here, which is why estimates that blend contractor revenue with bus sales can come in much higher than a vehicle-focused market value. Another common driver is how electric bus grants are treated, since some numbers count full program allocations up front, while others recognize value only when buses are ordered and delivered. Year-specific currency timing is less of an issue for a US-only market, but the refresh cadence still matters when large state awards shift deliveries across calendar years.
Benchmark comparison
| Source | Market Size | Gaps in Research Methodology |
|---|---|---|
| Mordor Intelligence | USD 5.83 B (2025) | |
| Trade Journal A | USD 12.92 B (2024) | This figure reflects estimated statewide K-12 transportation spending totals, which can include contracted operations, labor, and fuel, so it is not limited to school bus vehicle sales. |
| Regional Consultancy A | USD 4.83 B (2024) | This estimate appears to anchor on a narrower new-bus revenue pool and can undercount years where large grant-funded orders are placed but delivered later, which shifts value across years. |
The spread in the table mainly comes down to whether the value is counted as buses sold versus broader transportation spend, and whether orders are recognized when funded, ordered, or delivered. By sticking to clear vehicle-based counting and then checking the totals against procurement and fleet signals, the resulting market size stays easier to reproduce and update when new awards or delivery bottlenecks emerge.
Key Questions Answered in the Report
How large is the United States school bus market in 2026?
It stands at USD 6.25 billion and is on course to reach USD 8.82 billion by 2031.
What is the forecast CAGR for school bus sales through 2031?
The United States school bus market is projected to post a 7.13% CAGR between 2026 and 2031.
Which powertrain will grow fastest over the next five years?
Battery-electric buses are forecast to expand at a 36.45% CAGR as federal incentives favor zero-emission vehicles.
What challenges slow adoption in rural areas?
Sparse fast-charging infrastructure and substation capacity limitations raise costs and restrict electric deployments outside metropolitan zones.