
| Study Period | 2017 - 2030 |
| Base Year For Estimation | 2024 |
| Forecast Data Period | 2025 - 2030 |
| Market Size (2025) | USD 562.7 Billion |
| Market Size (2030) | USD 674.5 Billion |
| CAGR (2025 - 2030) | 3.69 % |
| Market Concentration | Low |
Major Players*Disclaimer: Major Players sorted in no particular order |


United States Road Freight Transport Market Analysis
The United States Road Freight Transport Market size is estimated at 562.7 billion USD in 2025, and is expected to reach 674.5 billion USD by 2030, growing at a CAGR of 3.69% during the forecast period (2025-2030).
The United States road freight transport industry is experiencing significant transformation driven by technological advancement and infrastructure development. In June 2024, total transborder freight amounted to USD 134.2 billion, with freight between the US and Mexico reaching USD 69.9 billion, showing a 2.1% year-over-year increase despite overall market challenges. The Biden administration's historic Bipartisan Infrastructure Law has allocated USD 550 billion from FY 2022 to 2026 for infrastructure improvements, including the largest dedicated bridge investment since the Interstate Highway System's construction. This comprehensive investment strategy aims to modernize road transportation infrastructure, enhance supply chain efficiency, and reduce bottlenecks that currently cost the trucking industry over USD 75 billion annually.
The transport industry continues to address persistent workforce challenges while embracing innovative solutions. The driver shortage slightly eased to 78,000 unfilled positions in 2022, down 4% from 81,258 in 2021, yet projections indicate the shortage could exceed 160,000 by 2031 without intervention. Companies are responding through increased wages, improved benefits, and innovative training programs. Simultaneously, the sector is witnessing a surge in autonomous vehicle testing and deployment, with several major players launching pilot programs. In July 2024, XPO expanded its cross-border service between the U.S. and Mexico with XPO Mexico+, demonstrating the industry's commitment to enhancing cross-border capabilities and technological integration.
The transition to sustainable transportation solutions is gaining momentum across the industry. In 2022, the United States committed to achieving 30% zero-emission truck sales nationwide by 2030 and 100% by 2040. This commitment is already driving significant industry changes, as evidenced by recent developments in 2024. Toyota unveiled its Class 8 Tern electric truck, while Daimler Truck's RIZON brand expanded its Class 4 to 5 electric vehicle lineup with enhanced warranty offerings for Model Year 2025. Additionally, in May 2024, Amazon began deploying heavy-duty electric trucks in Southern California, planning to operate nearly 50 such vehicles by early 2025, marking its largest fleet of these vehicles globally.
Infrastructure modernization continues to reshape the industry landscape. The U.S. Department of Transportation's recent announcement of USD 1.9 billion in grants for 519 projects across 48 states in September 2024 demonstrates the government's commitment to enhancing transportation infrastructure. In March 2024, USD 160 million was allocated to develop environmental product declarations (EPDs) and advance the use of low-carbon construction materials, supporting the national goal of net-zero emissions by 2050. These initiatives are complemented by innovative private sector solutions, such as GP Transco's 2024 announcement of installing solar panels on its entire fleet of approximately 600 trucks, estimated to save USD 1,700 per tractor annually.
United States Road Freight Transport Market Trends
United States leads regional GDP with 86% contribution, driven by infrastructure and supply chain investments
- In September 2024, the FAA, under the US Department of Transportation, allocated USD 1.9 billion in grants for 519 projects. These projects span 48 states, Guam, Puerto Rico, and other territories, all part of the Airport Improvement Program (AIP). Additionally, USD 269 million in Supplemental Discretionary Grants for 2023 will back 62 projects at 56 U.S. airports. This competitive initiative aids airport owners and operators in enhancing the U.S. airport system. Marking its largest round yet, this fifth AIP grant cycle funds diverse projects, from airport safety and sustainability upgrades to noise reduction. The grants cater to airports nationwide, regardless of size.
- With infrastructure development and the e-commerce boom, the transportation and storage sector is set for a job surge. The Bureau of Labor Statistics (BLS) projects a 0.8% annual growth rate from 2022 to 2032, translating to nearly 570,000 new jobs. Notably, the couriers and messengers industry, alongside warehousing and storage, is expected to drive about 80% of this job growth.
,-Share---Of-GDP,-United-States,-2017---2023.svg)
Understand The Key Trends Shaping This Market
Download PDF
The United States remained a net crude oil importer in 2022, importing about 6.28 million bpd of crude oil from 80 countries
- Gasoline prices in the US are expected to drop below USD 3 a gallon for the first time in over three years by October 2024, just before the presidential election. Lower fuel prices are mainly due to weaker demand and falling oil prices, providing relief to consumers who have faced high costs that fueled inflation. This could also help Vice President Kamala Harris and other Democrats counter Republican criticism over high gas prices. In September 2024, the average price for regular gas was USD 3.25 a gallon, down 19 cents from last month and 58 cents from last year.
- According to US Energy Information Administration (EIA), crude oil prices will stay steady in 2024 compared to 2023, then decrease in 2025. The US' introduction of new refining capacities in 2023 will boost its operable capacity, alleviating price strain on oil products in 2024 and 2025. Furthermore, the Middle East, particularly Kuwait, will add new international refining capacities, which will help ease global price pressure on gasoline and diesel. Also, it is expected, narrowing crack spreads in 2024 are likely to lead to lower average US retail fuel prices in both 2024 and 2025. Gasoline prices are projected to USD 3.36/gal in 2024 and USD 3.24/gal in 2025.

OTHER KEY INDUSTRY TRENDS COVERED IN THE REPORT
- Retail sales in the United States expanded by 3.2% YoY in 2023 supported by consumer spending
- The number of e-commerce users in the United States is expected to reach 333 million by 2029 from 273 million in 2024
- United States leads regional GDP with 86% contribution, driven by infrastructure and supply chain investments
- Road infrastructure investments under the Bipartisan Infrastructure Law (2022-2026) focus on repairing existing roads and launching new road projects
- US imports from Mexico reached USD 475.6 billion in 2023, up 5% from 2022
- Over 12,000 medium- and heavy-duty electric trucks were put into service across the US between 2019 and 2023
- Investment in infrastructure worth USD 550 billion by 2026, to boost road freight volumes in the United States
- Rising government efforts to support land (road and rail) mode of transport, with rising infrastructure investments
- US oil production stabilizes at 13.2 million barrels per day, while major companies pursue mergers for Permian Basin output
- Small- and medium-sized manufacturers (SMMs) comprise 98% of the US manufacturing firms as of 2023
- US boosts highway investment by 55% to improve infrastructure, targeting supply chain efficiency by 2026
- The United States is projected to become the world's fifth-largest rice exporter, with 3.1 million tons by 2031-32
- The trucking industry is expected to recruit nearly 1.2 million drivers over the next ten years to replace drivers leaving
- New commercial truck sales declined in Q2 2024, due to drop in Class 8 truck sales
- Growing exports and imports of petroleum, along with growing truck driver wages, are driving road freight pricing in the US despite a decline in fuel price
- Residue impact of economic shutdown on global supply chains led to an increase in food and energy prices
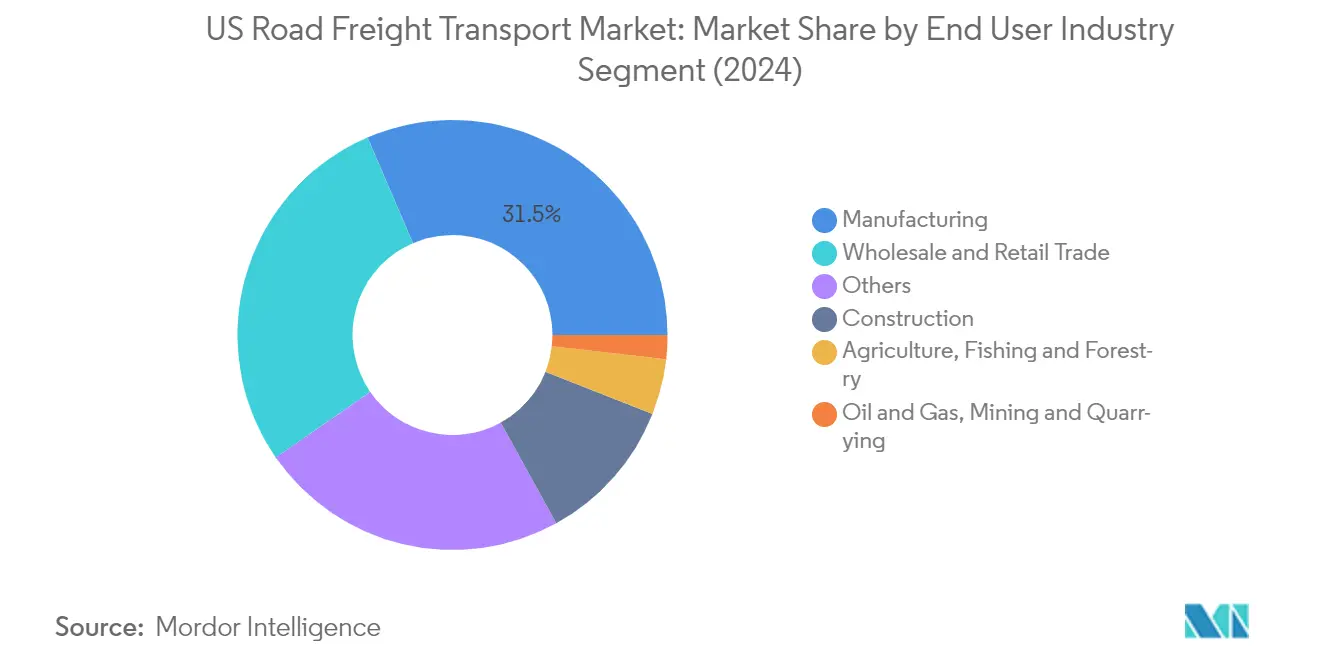
Segment Analysis: End User Industry
Manufacturing Segment in US Road Freight Transport Market
The manufacturing segment dominates the US road freight transport market, holding approximately 31% market share in 2024, driven by robust manufacturing exports and domestic production. In June 2024, manufactured goods exports reached USD 113 billion, up from USD 111.9 billion in May 2024, while the first six months of 2024 saw manufactured goods exports reach USD 658 billion, marking a 2.62% year-over-year increase. The United States manufacturing sector, a major driver of truck transportation, returned to expansion in early 2024, signaling a recovery in industrial activity and increased demand for transportation services. The sector's growth is further supported by the widespread adoption of Industry 4.0 technologies like artificial intelligence, robotics, automation, and the Industrial Internet of Things (IIoT), leading to significant transformation in the industrial landscape and increased freight movement requirements.
Agriculture, Fishing and Forestry Segment in US Road Freight Transport Market
The agriculture, fishing, and forestry segment is projected to experience rapid growth between 2024-2029, driven by expanding agricultural exports and domestic distribution needs. In July 2024, the General Services Administration (GSA) approved a USD 94 million project to upgrade the Port of Dunseith, a North Dakota-Canada border crossing that handles grain and oilseed exports by truck. The port facilitated over USD 72 million worth of cereal and oilseed exports to Canada in 2023, representing 9% of North Dakota's total grain and oilseed exports. Additionally, to help agricultural exporters expand their refrigerated storage facilities, buy new equipment, and develop new farms, the US Department of Agriculture (USDA) is investing USD 200 million in 185 projects, which is expected to boost agricultural freight logistics significantly in the coming years.
Remaining Segments in End User Industry
The wholesale and retail trade segment maintains a significant market presence, driven by the continued growth of e-commerce and evolving consumer shopping patterns. The construction segment benefits from ongoing infrastructure development projects and housing sector growth. The oil and gas, mining, and quarrying segment's demand is influenced by energy sector dynamics and commodity prices. The "others" segment, which includes waste management and various industrial sectors, continues to contribute steadily to the overall market growth. Each of these segments plays a crucial role in shaping the road freight transport landscape, with their unique requirements driving specialized transportation solutions and technological adaptations in the industry.
Segment Analysis: Destination
Domestic Segment in US Road Freight Transport Market
The domestic segment continues to dominate the US road freight transport market, accounting for approximately 63% of the total market value in 2024. This substantial market share is driven by the robust growth in manufacturing exports, which reached USD 113 billion in June 2024, showing significant month-over-month growth from USD 111.9 billion in May 2024. The segment's strength is further reinforced by the expansion of domestic e-commerce activities, with projections indicating that e-commerce revenue will touch USD 1,068 billion in 2024. The domestic segment's dominance is also supported by major infrastructure developments, including significant upgrades to Wisconsin's Interstate 41, which involves widening a 37.9 km segment from four lanes to six, scheduled for completion by Q3 2030. Additionally, the implementation of the Bipartisan Infrastructure Law, allocating USD 550 billion from FY 2022 to 2026, has provided substantial support for domestic freight logistics through improved road infrastructure.
International Segment in US Road Freight Transport Market
The international segment is emerging as the fastest-growing segment in the US road freight transport market, with an expected growth rate of approximately 4% between 2024 and 2029. This growth is primarily driven by increasing cross-border trade activities, particularly with Mexico and Canada. In June 2024, total transborder freight amounted to USD 134.2 billion, with Mexico-US trade reaching USD 69.9 billion, marking a 2.1% year-over-year increase. The segment's growth is further supported by strategic expansions of major logistics players, such as XPO's enhancement of its cross-border service between the U.S. and Mexico with XPO Mexico+, now covering 99% of postal codes in Mexico. The implementation of the United States-Mexico-Canada Agreement (USMCA) continues to facilitate smoother cross-border operations, while investments in border infrastructure and modernization of customs processes are contributing to more efficient international freight transport.
Segment Analysis: Truckload Specification
Full-Truck-Load (FTL) Segment in US Road Freight Transport Market
The Full-Truck-Load (FTL) segment dominates the US road freight transport market, commanding approximately 80% of the total market value in 2024. This substantial market share is driven by the segment's efficiency in handling large-volume shipments and its crucial role in supporting major industries. In 2024, several market players have made significant strides in FTL innovation, particularly in electric vehicle adoption. For instance, Volvo Trucks North America introduced a novel Truck-as-a-Service model named Volvo on Demand, enabling customers to rent from a selection of 25 Class 8 Volvo VNR Electric trucks. The FTL segment's prominence is further reinforced by its essential role in supporting cross-border trade, with significant volumes moving between the US and Mexico, particularly through major gateways like Laredo, TX. The segment's strength is also evident in its ability to efficiently transport various commodity types, from electronics to automotive parts, making it indispensable for supply chain operations across the country.
Less-than-Truck-Load (LTL) Segment in US Road Freight Transport Market
The less-than-truckload (LTL) segment is experiencing robust growth, projected to expand at approximately 4% annually from 2024 to 2029. This growth is primarily driven by the surge in e-commerce and the increasing demand for flexible shipping solutions. Major developments in the LTL sector include XPO's expansion of its cross-border service between the U.S. and Mexico with XPO Mexico+, now covering 99% of postal codes in Mexico. The segment's growth is further supported by technological advancements, with companies implementing sophisticated routing systems and digital platforms to optimize load consolidation and improve delivery efficiency. The rise in cross-border e-commerce has been particularly significant in driving LTL demand, with online shopping orders from international retailers contributing substantially to the segment's expansion. Additionally, the increasing focus on sustainability and the adoption of electric vehicles in the LTL sector is creating new opportunities for growth and operational efficiency.
Segment Analysis: Containerization
Non-containerized Segment in US Road Freight Transport Market
The non-containerized segment dominates the US road freight transport market, accounting for approximately 86% of the total market value in 2024. This significant market share is driven by the substantial infrastructure development budget of USD 110 billion assigned by the US government under the Bipartisan Infrastructure Deal from 2022-2026. In June 2024, U.S. Transportation Secretary Pete Buttigieg announced USD 1.8 billion in the Rebuilding American Infrastructure with Sustainability and Equity (RAISE) grants for 148 projects nationwide, bringing the total RAISE grants under the Biden-Harris Administration to over USD 7.2 billion for more than 550 projects. The demand for RAISE funding significantly exceeded the available amount, with the department receiving nearly USD 13 billion in requests for the USD 1.8 billion available in 2024, highlighting the robust growth potential in this segment.
Containerized Segment in US Road Freight Transport Market
The containerized segment is experiencing the fastest growth in the US road freight transport market, with a projected growth rate of approximately 4% from 2024 to 2029. In June 2024, transborder freight totaled USD 134.2 billion, with trucks accounting for USD 86.9 billion of the freight movement. The growth in this segment is particularly driven by increasing cross-border trade activities. Georgia legislators recently approved a USD 6 million funding boost for harbor enhancements at the Port of Brunswick, following a recommendation from the US Army Corps of Engineers. This enhancement project, with an estimated cost of USD 17.45 million and primarily funded by a federal contribution of USD 11.35 million, is set to strengthen the port's capabilities and boost containerized freight movement in the coming years.
Segment Analysis: Distance
Long Haul Segment in US Road Freight Transport Market
The long haul segment dominates the US road freight transport market, commanding approximately 72% of the total market value in 2024. This segment's prominence is driven by several key factors, including the significant upgrades to infrastructure like Wisconsin's Interstate 41 project, which aims to widen a 37.9 km segment from four lanes to six by 2030. The segment's growth is further supported by substantial government investments, with the United States committing USD 26.6 billion in highway and bridge formula funds to support over 19,300 new projects. The Bipartisan Infrastructure Law's allocation of USD 550 billion from 2022 through 2026 has provided additional momentum to long haul transportation. Moreover, the segment is experiencing robust growth with a projected annual growth rate of approximately 4% through 2029, driven by increasing cross-border freight transport and its vital contribution to trade. The expansion of the National Highway System, which is projected to see traffic increase from 311 million miles per day to 488 million miles per day by 2045, further underscores the segment's growth trajectory.
Short Haul Segment in US Road Freight Transport Market
The short haul segment plays a crucial role in the US road freight transport market, particularly in urban and regional distribution networks. This segment has seen significant developments in electric vehicle adoption, with major companies like Amazon rolling out heavy-duty electric trucks in Southern California, including its first for ocean freight. The segment's evolution is marked by innovative approaches from automotive manufacturers, with Stellantis announcing plans to focus on battery-powered pickups, SUVs, and muscle cars rather than small cars in the US market. The transformation of short haul transportation is further evidenced by PepsiCo's initiative to deploy 100 heavy-duty electric trucks for deliveries to customers like Walmart and Kroger. The segment's growth is particularly notable in routes covering less than 100 miles, which constitute a significant portion of truck routes in the US, making them ideal candidates for electric vehicle adoption. This transition to electric vehicles in short haul operations is reshaping the segment's operational dynamics and environmental impact.
Segment Analysis: Goods Configuration
Solid Goods Segment in US Road Freight Transport Market
The solid goods segment dominates the US road freight transport market, commanding approximately 74% of the total market value in 2024. This substantial market share is driven by the segment's crucial role in transporting manufactured goods, construction materials, and retail products across the country. In September 2024, Volvo announced plans to release a long-range version of its FH Electric truck specifically designed for solid goods transportation, with the capability to travel up to 600 km on a single charge. The company's strategic decision to establish a new USD 700 million truck plant in Monterrey, set to begin operations in 2026, further demonstrates the growing importance of solid goods transportation. The segment's strength is also reinforced by government infrastructure investments, including significant projects like the I-405/SR 522 to SR 527 Improvement Upgrade in Bothell, Washington, which began in Q2 2024 and aims to enhance the transportation network for solid goods movement.
Fluid Goods Segment in US Road Freight Transport Market
The fluid goods segment is experiencing robust growth in the US road freight transport market, projected to grow at approximately 4% through 2029. This growth is primarily driven by increasing demand for liquid cargo transportation, particularly in the energy and chemical sectors. As of June 2024, U.S. oil and gas production has stabilized, with production reaching nearly 13.2 million barrels per day, creating sustained demand for fluid transportation services. The segment's expansion is further supported by infrastructural developments, with projected capital expenditures for oil and gas infrastructure expected to range between USD 1.06-1.34 trillion through 2035. The market is also witnessing technological advancements, with major companies investing in specialized equipment and safety measures for fluid transportation. Additionally, the increasing focus on renewable fuels and sustainable transportation solutions is creating new opportunities within the fluid goods segment.
Segment Analysis: Temperature Control
Non-Temperature Controlled Segment in US Road Freight Transport Market
The non-temperature controlled segment dominates the US road freight transport market, commanding approximately 95% of the total market value in 2024. This substantial market share is driven by the diverse range of goods that don't require temperature regulation during transport. In May 2024, Toyota unveiled its Class 8 Tern, a fully electric truck, demonstrating the segment's continued innovation in sustainable transportation solutions. The segment's dominance is further reinforced by significant investments, such as Hino's USD 2 billion commitment towards battery-electric truck development in collaboration with Norwegian firm Hexagon Purus. The automation trend is also gaining momentum, as evidenced by California's draft framework for heavy-duty autonomous trucks weighing over 10,001 pounds, released in August 2024, which aims to enable long-haul deliveries on hub-to-hub routes by 2025.
Temperature Controlled Segment in US Road Freight Transport Market
The temperature-controlled segment is experiencing the fastest growth in the US road freight transport market, with projections indicating an annual growth rate of approximately 4% through 2029. This growth is primarily driven by expanding pharmaceutical and food & beverage industries requiring specialized transportation solutions. In May 2024, Isuzu Commercial Truck of America demonstrated its commitment to this segment by showcasing its all-electric NRR EV truck equipped with the Thermo King® e300 all-electric refrigeration unit at the Advanced Clean Transportation Expo. The segment's evolution is further evidenced by Daimler Truck's RIZON brand, which introduced enhanced e18Mx and e18Lx models for Model Year 2025, featuring improved battery life and robust performance specifically designed for temperature-sensitive cargo transportation.
United States Road Freight Transport Industry Overview
Top Companies in US Road Freight Transport Market
The US road freight transport market features prominent players like C.H. Robinson, FedEx, J.B. Hunt Transport Services, Old Dominion Freight Line, and Landstar System Inc. Companies across the market are heavily investing in autonomous vehicle development and electric vehicle adoption, partnering with technology providers to enhance their capabilities. Operational agility is being achieved through digital transformation initiatives, including AI-powered smart logistics platforms and automated scheduling systems. Strategic expansion moves focus on strengthening LTL capacities, with companies opening new terminals and service centers across key locations. Product innovations center around sustainable solutions, including the deployment of electric trucks and solar-powered delivery vehicles. Companies are also emphasizing driver training programs and recruitment initiatives to address workforce challenges while investing in cross-border capabilities to capture growing international trade opportunities.
Fragmented Market with Strong Regional Players
The US road freight transport market exhibits a fragmented structure with a mix of large national carriers and regional specialists. Major players have established strong regional networks through decades of operations, while maintaining significant market presence through their extensive fleet sizes and comprehensive service offerings. The market has witnessed considerable consolidation activity, particularly in the LTL segment, where larger carriers are acquiring regional players to expand their geographic footprint and service capabilities. Companies with established networks are leveraging their infrastructure to provide integrated logistics services, while specialized carriers focus on niche segments like temperature-controlled transport or heavy haul services.
The competitive landscape is characterized by both traditional transportation companies and logistics technology providers entering the market. Global logistics conglomerates maintain their presence through subsidiaries, while local players leverage their regional expertise and customer relationships. Merger and acquisition activities are primarily driven by the need to expand service offerings, enhance technological capabilities, and strengthen market position in specific regions or segments. Companies are increasingly focusing on building end-to-end logistics capabilities through strategic acquisitions and partnerships, particularly in areas like last-mile delivery and cross-border services.
Innovation and Sustainability Drive Future Success
Success in the transportation industry increasingly depends on companies' ability to embrace technological innovation while maintaining operational efficiency. Incumbents are focusing on expanding their digital capabilities through investments in automation, real-time tracking systems, and predictive analytics to enhance service reliability and customer experience. Market leaders are strengthening their position by developing comprehensive sustainability initiatives, including the adoption of alternative fuel vehicles and optimization of routing systems. Companies are also expanding their value-added services, such as specialized handling capabilities and integrated supply chain solutions, to differentiate themselves in the competitive landscape.
For contenders looking to gain market share, success lies in identifying and serving underserved markets or specialized niches. Companies are focusing on developing industry-specific expertise and tailored solutions for high-growth sectors like e-commerce and healthcare. The increasing regulatory focus on environmental sustainability and safety standards is pushing companies to invest in compliant technologies and practices. Market participants are also addressing the risk of substitution from alternative modes of transport by enhancing their intermodal capabilities and developing partnerships with rail and air freight providers. Future success will depend on companies' ability to balance operational efficiency with environmental responsibility while maintaining competitive pricing structures.
United States Road Freight Transport Market Leaders
-
C.H. Robinson
-
FedEx
-
J.B. Hunt Transport, Inc.
-
Landstar System Inc.
-
Old Dominion Freight Line
- *Disclaimer: Major Players sorted in no particular order

Need More Details on Market Players and Competiters?
Download PDF
United States Road Freight Transport Market News
- September 2024: FedEx partnered with and invested in Nimble, an AI robotics and autonomous e-commerce fulfillment technology company, to scale FedEx Fulfillment with their fully autonomous 3PL model. FedEx offered a comprehensive approach to help e-commerce and omnichannel brands make faster, smarter supply chain decisions. With more than 130 warehouse and fulfillment operations in North America and 475 million returns processed annually, FedEx Supply Chain helped brands consolidate functions, increase agility, and accelerate click-to-door speed to maximize supply chain value.
- August 2024: FedEx introduced new digital visibility products, enhancing the experience for shippers and recipients by merging digital solutions with essential data. These paid solutions catered to the rising market demand for advanced data analytics. Businesses harnessed near real-time insights and predictive analytics, refining their customers' post-purchase experience. FedEx also offered paid data integration solutions, granting third-party providers access to shipment tracking information, including the Track API, Track EDI, and new webhook subscriptions, all designed to enhance premium post-purchase tracking and supply chain visibility.
- August 2024: DHL Express launched the “Small Business PartnerSHIP” Program, aimed at empowering small and medium-sized enterprises (SMEs) across the United States. This initiative facilitated these businesses' entry into global markets and fostered their international growth. Offered at no extra charge, the program granted SMEs a suite of valuable benefits. These included shipping promo codes and discounts, streamlined shipping solutions via the MyDHL+ platform, and insights on international shipping regulations through the Global Trade Services (MyGTS). Furthermore, the GoGreen Plus initiative aided in curbing carbon emissions from shipments. Beyond these, SMEs benefited from e-commerce guidance, mentorship opportunities, access to informative webinars and events, and personalized assistance from Certified International Specialists.
Free With This Report
We provide a complimentary and exhaustive set of data points on global and regional metrics that present the fundamental structure of the industry. Presented in the form of 60+ free charts, the section covers difficult to find data on various regions pertaining to e-commerce industry trends, economic contribution of the transportation & storage sector, export and import trends among other key indicators.


United States Road Freight Transport Market Report - Table of Contents
1. EXECUTIVE SUMMARY & KEY FINDINGS
2. REPORT OFFERS
3. INTRODUCTION
- 3.1 Study Assumptions & Market Definition
- 3.2 Scope of the Study
- 3.3 Research Methodology
4. KEY INDUSTRY TRENDS
- 4.1 GDP Distribution By Economic Activity
- 4.2 GDP Growth By Economic Activity
-
4.3 Economic Performance And Profile
- 4.3.1 Trends in E-Commerce Industry
- 4.3.2 Trends in Manufacturing Industry
- 4.4 Transport And Storage Sector GDP
- 4.5 Logistics Performance
- 4.6 Length Of Roads
- 4.7 Export Trends
- 4.8 Import Trends
- 4.9 Fuel Pricing Trends
- 4.10 Trucking Operational Costs
- 4.11 Trucking Fleet Size By Type
- 4.12 Major Truck Suppliers
- 4.13 Road Freight Tonnage Trends
- 4.14 Road Freight Pricing Trends
- 4.15 Modal Share
- 4.16 Inflation
- 4.17 Regulatory Framework
- 4.18 Value Chain & Distribution Channel Analysis
5. MARKET SEGMENTATION (includes market size in Value in USD, Forecasts up to 2030 and analysis of growth prospects)
-
5.1 End User Industry
- 5.1.1 Agriculture, Fishing, and Forestry
- 5.1.2 Construction
- 5.1.3 Manufacturing
- 5.1.4 Oil and Gas, Mining and Quarrying
- 5.1.5 Wholesale and Retail Trade
- 5.1.6 Others
-
5.2 Destination
- 5.2.1 Domestic
- 5.2.2 International
-
5.3 Truckload Specification
- 5.3.1 Full-Truck-Load (FTL)
- 5.3.2 Less than-Truck-Load (LTL)
-
5.4 Containerization
- 5.4.1 Containerized
- 5.4.2 Non-Containerized
-
5.5 Distance
- 5.5.1 Long Haul
- 5.5.2 Short Haul
-
5.6 Goods Configuration
- 5.6.1 Fluid Goods
- 5.6.2 Solid Goods
-
5.7 Temperature Control
- 5.7.1 Non-Temperature Controlled
- 5.7.2 Temperature Controlled
6. COMPETITIVE LANDSCAPE
- 6.1 Key Strategic Moves
- 6.2 Market Share Analysis
- 6.3 Company Landscape
-
6.4 Company Profiles
- 6.4.1 A.P. Moller - Maersk
- 6.4.2 ArcBest
- 6.4.3 C.H. Robinson
- 6.4.4 DHL Group
- 6.4.5 FedEx
- 6.4.6 J.B. Hunt Transport, Inc.
- 6.4.7 Knight-Swift Transportation Holdings Inc.
- 6.4.8 Landstar System Inc.
- 6.4.9 Old Dominion Freight Line
- 6.4.10 Ryder System, Inc.
- 6.4.11 Schneider National, Inc.
- 6.4.12 United Parcel Service of America, Inc. (UPS)
- 6.4.13 Werner Enterprises Inc.
- 6.4.14 XPO, Inc.
- *List Not Exhaustive
7. KEY STRATEGIC QUESTIONS FOR ROAD FREIGHT CEOS
8. APPENDIX
-
8.1 Global Logistics Market Overview
- 8.1.1 Overview
- 8.1.2 Porter’s Five Forces Framework
- 8.1.3 Global Value Chain Analysis
- 8.1.4 Market Dynamics (Market Drivers, Restraints & Opportunities)
- 8.2 Sources & References
- 8.3 List of Tables & Figures
- 8.4 Primary Insights
- 8.5 Data Pack
- 8.6 Glossary of Terms
- 8.7 Currency Exchange Rate
You Can Purchase Parts Of This Report. Check Out Prices For Specific Sections
Get Price Break-up Now
List of Tables & Figures
- Figure 1:
- DISTRIBUTION OF GROSS DOMESTIC PRODUCT (GDP) BY ECONOMIC ACTIVITY, SHARE %, UNITED STATES, 2022
- Figure 2:
- GROWTH OF GROSS DOMESTIC PRODUCT (GDP) BY ECONOMIC ACTIVITY, CAGR %, UNITED STATES, 2017 – 2022
- Figure 3:
- GROSS MERCHANDISE VALUE (GMV) OF E-COMMERCE INDUSTRY, USD, UNITED STATES, 2017 - 2027
- Figure 4:
- SECTORAL SHARE IN E-COMMERCE INDUSTRY GROSS MERCHANDISE VALUE (GMV), SHARE %, UNITED STATES, 2022
- Figure 5:
- GROSS VALUE ADDED (GVA) OF MANUFACTURING INDUSTRY (IN CURRENT PRICES), USD, UNITED STATES, 2017 - 2022
- Figure 6:
- SECTORAL SHARE IN GROSS VALUE ADDED (GVA) OF MANUFACTURING INDUSTRY, SHARE %, UNITED STATES, 2022
- Figure 7:
- VALUE OF TRANSPORT AND STORAGE SECTOR GROSS DOMESTIC PRODUCT (GDP), USD, UNITED STATES, 2017 – 2022
- Figure 8:
- TRANSPORT AND STORAGE SECTOR GROSS DOMESTIC PRODUCT (GDP), SHARE % OF GDP, UNITED STATES, 2017-2022
- Figure 9:
- RANK OF LOGISTICS PERFORMANCE, RANK, UNITED STATES, 2010 - 2023
- Figure 10:
- SHARE OF ROAD LENGTH BY SURFACE CATEGORY, %, UNITED STATES, 2022
- Figure 11:
- SHARE OF ROAD LENGTH BY SURFACE CLASSIFICATION, %, UNITED STATES, 2022
- Figure 12:
- VALUE OF EXPORTS, USD, UNITED STATES, 2017 - 2022
- Figure 13:
- VALUE OF IMPORTS, USD, UNITED STATES, 2017 - 2022
- Figure 14:
- FUEL PRICE BY TYPE OF FUEL, USD/LITER, UNITED STATES, 2017 - 2022
- Figure 15:
- OPERATIONAL COSTS OF TRUCKING - BREAKDOWN BY OPERATING COST ELEMENT, %, UNITED STATES, 2022
- Figure 16:
- TRUCKING FLEET SIZE BY TYPE, SHARE %, UNITED STATES, 2022
- Figure 17:
- MARKET SHARE OF MAJOR TRUCK SUPPLIER BRANDS, SHARE %, UNITED STATES, 2022
- Figure 18:
- FREIGHT HANDLED BY ROAD TRANSPORT, TONS, UNITED STATES, 2017 - 2030
- Figure 19:
- PRICE TREND OF ROAD FREIGHT TRANSPORT SERVICE, USD/TON-KM, UNITED STATES, 2017 - 2022
- Figure 20:
- MODAL SHARE OF FREIGHT TRANSPORTATION SECTOR, SHARE % BY TON-KM, UNITED STATES, 2022
- Figure 21:
- MODAL SHARE OF FREIGHT TRANSPORT SECTOR, SHARE % BY TONS, UNITED STATES, 2022
- Figure 22:
- WHOLESALE PRICE INFLATION RATE, %, UNITED STATES, 2017 - 2022
- Figure 23:
- CONSUMER PRICE INFLATION RATE, %, UNITED STATES, 2017 - 2022
- Figure 24:
- VOLUME OF ROAD FREIGHT TRANSPORT MARKET, TON-KM, UNITED STATES, 2017 - 2030
- Figure 25:
- VALUE OF ROAD FREIGHT TRANSPORT MARKET, USD, UNITED STATES, 2017 - 2030
- Figure 26:
- VOLUME OF ROAD FREIGHT TRANSPORT MARKET BY END USER INDUSTRY, TON-KM, UNITED STATES, 2017 - 2030
- Figure 27:
- VALUE OF ROAD FREIGHT TRANSPORT MARKET BY END USER INDUSTRY, USD, UNITED STATES, 2017 - 2030
- Figure 28:
- VALUE SHARE OF ROAD FREIGHT TRANSPORT MARKET BY END USER INDUSTRY, %, UNITED STATES, 2017 - 2030
- Figure 29:
- VOLUME OF AFF INDUSTRY (AGRICULTURE, FISHING, AND FORESTRY) ROAD FREIGHT TRANSPORT MARKET, TON-KM, UNITED STATES, 2017 - 2030
- Figure 30:
- VALUE OF AFF INDUSTRY (AGRICULTURE, FISHING, AND FORESTRY) ROAD FREIGHT TRANSPORT MARKET, USD, UNITED STATES, 2017 - 2030
- Figure 31:
- VALUE SHARE OF AFF INDUSTRY (AGRICULTURE, FISHING, AND FORESTRY) ROAD FREIGHT TRANSPORT MARKET BY DESTINATION, %, UNITED STATES, 2022 VS 2030
- Figure 32:
- VOLUME OF CONSTRUCTION INDUSTRY ROAD FREIGHT TRANSPORT MARKET, TON-KM, UNITED STATES, 2017 - 2030
- Figure 33:
- VALUE OF CONSTRUCTION INDUSTRY ROAD FREIGHT TRANSPORT MARKET, USD, UNITED STATES, 2017 - 2030
- Figure 34:
- VALUE SHARE OF CONSTRUCTION INDUSTRY ROAD FREIGHT TRANSPORT MARKET BY DESTINATION, %, UNITED STATES, 2022 VS 2030
- Figure 35:
- VOLUME OF MANUFACTURING INDUSTRY ROAD FREIGHT TRANSPORT MARKET, TON-KM, UNITED STATES, 2017 - 2030
- Figure 36:
- VALUE OF MANUFACTURING INDUSTRY ROAD FREIGHT TRANSPORT MARKET, USD, UNITED STATES, 2017 - 2030
- Figure 37:
- VALUE SHARE OF MANUFACTURING INDUSTRY ROAD FREIGHT TRANSPORT MARKET BY DESTINATION, %, UNITED STATES, 2022 VS 2030
- Figure 38:
- VOLUME OF EXTRACTION INDUSTRY (OIL AND GAS, MINING AND QUARRYING) ROAD FREIGHT TRANSPORT MARKET, TON-KM, UNITED STATES, 2017 - 2030
- Figure 39:
- VALUE OF EXTRACTION INDUSTRY (OIL AND GAS, MINING AND QUARRYING) ROAD FREIGHT TRANSPORT MARKET, USD, UNITED STATES, 2017 - 2030
- Figure 40:
- VALUE SHARE OF EXTRACTION INDUSTRY ROAD FREIGHT TRANSPORT MARKET BY DESTINATION, %, UNITED STATES, 2022 VS 2030
- Figure 41:
- VOLUME OF DISTRIBUTIVE TRADE INDUSTRY (WHOLESALE AND RETAIL TRADE) ROAD FREIGHT TRANSPORT MARKET, TON-KM, UNITED STATES, 2017 - 2030
- Figure 42:
- VALUE OF DISTRIBUTIVE TRADE INDUSTRY (WHOLESALE AND RETAIL TRADE) ROAD FREIGHT TRANSPORT MARKET, USD, UNITED STATES, 2017 - 2030
- Figure 43:
- VALUE SHARE OF WHOLESALE AND RETAIL TRADE INDUSTRY ROAD FREIGHT TRANSPORT MARKET BY DESTINATION, %, UNITED STATES, 2022 VS 2030
- Figure 44:
- VOLUME OF OTHER END USER INDUSTRIES ROAD FREIGHT TRANSPORT MARKET, TON-KM, UNITED STATES, 2017 - 2030
- Figure 45:
- VALUE OF OTHER END USER INDUSTRIES ROAD FREIGHT TRANSPORT MARKET, USD, UNITED STATES, 2017 - 2030
- Figure 46:
- VALUE SHARE OF OTHER END USER INDUSTRIES ROAD FREIGHT TRANSPORT MARKET BY DESTINATION, %, UNITED STATES, 2022 VS 2030
- Figure 47:
- VOLUME OF ROAD FREIGHT TRANSPORT MARKET BY DESTINATION, TON-KM, UNITED STATES, 2017 - 2030
- Figure 48:
- VALUE OF ROAD FREIGHT TRANSPORT MARKET BY DESTINATION, USD, UNITED STATES, 2017 - 2030
- Figure 49:
- VALUE SHARE OF ROAD FREIGHT TRANSPORT MARKET BY DESTINATION, %, UNITED STATES, 2017 - 2030
- Figure 50:
- VOLUME OF DOMESTIC ROAD FREIGHT TRANSPORT MARKET, TON-KM, UNITED STATES, 2017 - 2030
- Figure 51:
- VALUE OF DOMESTIC ROAD FREIGHT TRANSPORT MARKET, USD, UNITED STATES, 2017 - 2030
- Figure 52:
- VALUE SHARE OF DOMESTIC ROAD FREIGHT TRANSPORT MARKET BY END USER INDUSTRY, %, UNITED STATES, 2022 VS 2030
- Figure 53:
- VOLUME OF INTERNATIONAL ROAD FREIGHT TRANSPORT MARKET, TON-KM, UNITED STATES, 2017 - 2030
- Figure 54:
- VALUE OF INTERNATIONAL ROAD FREIGHT TRANSPORT MARKET, USD, UNITED STATES, 2017 - 2030
- Figure 55:
- VALUE SHARE OF INTERNATIONAL ROAD FREIGHT TRANSPORT MARKET BY END USER INDUSTRY, %, UNITED STATES, 2022 VS 2030
- Figure 56:
- VALUE OF ROAD FREIGHT TRANSPORT MARKET BY TRUCKLOAD SPECIFICATION, USD, UNITED STATES, 2017 - 2030
- Figure 57:
- VALUE SHARE OF ROAD FREIGHT TRANSPORT MARKET BY TRUCKLOAD SPECIFICATION, %, UNITED STATES, 2017 - 2030
- Figure 58:
- VALUE OF FULL-TRUCK-LOAD (FTL) ROAD FREIGHT TRANSPORT MARKET, USD, UNITED STATES, 2017 - 2030
- Figure 59:
- CAGR OF FULL-TRUCK-LOAD (FTL) ROAD FREIGHT TRANSPORT MARKET, %, UNITED STATES, 2017 - 2030
- Figure 60:
- VALUE OF LESS THAN-TRUCK-LOAD (LTL) ROAD FREIGHT TRANSPORT MARKET, USD, UNITED STATES, 2017 - 2030
- Figure 61:
- CAGR OF LESS THAN-TRUCK-LOAD (LTL) ROAD FREIGHT TRANSPORT MARKET, %, UNITED STATES, 2017 - 2030
- Figure 62:
- VALUE OF ROAD FREIGHT TRANSPORT MARKET BY CONTAINERIZATION, USD, UNITED STATES, 2017 - 2030
- Figure 63:
- VALUE SHARE OF ROAD FREIGHT TRANSPORT MARKET BY CONTAINERIZATION, %, UNITED STATES, 2017 - 2030
- Figure 64:
- VALUE OF CONTAINERIZED ROAD FREIGHT TRANSPORT MARKET, USD, UNITED STATES, 2017 - 2030
- Figure 65:
- CAGR OF CONTAINERIZED ROAD FREIGHT TRANSPORT MARKET, %, UNITED STATES, 2017 - 2030
- Figure 66:
- VALUE OF NON-CONTAINERIZED ROAD FREIGHT TRANSPORT MARKET, USD, UNITED STATES, 2017 - 2030
- Figure 67:
- CAGR OF NON-CONTAINERIZED ROAD FREIGHT TRANSPORT MARKET, %, UNITED STATES, 2017 - 2030
- Figure 68:
- VALUE OF ROAD FREIGHT TRANSPORT MARKET BY DISTANCE, USD, UNITED STATES, 2017 - 2030
- Figure 69:
- VALUE SHARE OF ROAD FREIGHT TRANSPORT MARKET BY DISTANCE, %, UNITED STATES, 2017 - 2030
- Figure 70:
- VALUE OF LONG HAUL ROAD FREIGHT TRANSPORT MARKET, USD, UNITED STATES, 2017 - 2030
- Figure 71:
- CAGR OF LONG HAUL ROAD FREIGHT TRANSPORT MARKET, %, UNITED STATES, 2017 - 2030
- Figure 72:
- VALUE OF SHORT HAUL ROAD FREIGHT TRANSPORT MARKET, USD, UNITED STATES, 2017 - 2030
- Figure 73:
- CAGR OF SHORT HAUL ROAD FREIGHT TRANSPORT MARKET, %, UNITED STATES, 2017 - 2030
- Figure 74:
- VALUE OF ROAD FREIGHT TRANSPORT MARKET BY GOODS CONFIGURATION, USD, UNITED STATES, 2017 - 2030
- Figure 75:
- VALUE SHARE OF ROAD FREIGHT TRANSPORT MARKET BY GOODS CONFIGURATION, %, UNITED STATES, 2017 - 2030
- Figure 76:
- VALUE OF FLUID GOODS ROAD FREIGHT TRANSPORT MARKET, USD, UNITED STATES, 2017 - 2030
- Figure 77:
- CAGR OF FLUID GOODS ROAD FREIGHT TRANSPORT MARKET, %, UNITED STATES, 2017 - 2030
- Figure 78:
- VALUE OF SOLID GOODS ROAD FREIGHT TRANSPORT MARKET, USD, UNITED STATES, 2017 - 2030
- Figure 79:
- CAGR OF SOLID GOODS ROAD FREIGHT TRANSPORT MARKET, %, UNITED STATES, 2017 - 2030
- Figure 80:
- VALUE OF ROAD FREIGHT TRANSPORT MARKET BY TEMPERATURE CONTROL, USD, UNITED STATES, 2017 - 2030
- Figure 81:
- VALUE SHARE OF ROAD FREIGHT TRANSPORT MARKET BY TEMPERATURE CONTROL, %, UNITED STATES, 2017 - 2030
- Figure 82:
- VALUE OF NON-TEMPERATURE CONTROLLED ROAD FREIGHT TRANSPORT MARKET, USD, UNITED STATES, 2017 - 2030
- Figure 83:
- CAGR OF NON-TEMPERATURE CONTROLLED ROAD FREIGHT TRANSPORT MARKET, %, UNITED STATES, 2017 - 2030
- Figure 84:
- VALUE OF TEMPERATURE CONTROLLED ROAD FREIGHT TRANSPORT MARKET, USD, UNITED STATES, 2017 - 2030
- Figure 85:
- CAGR OF TEMPERATURE CONTROLLED ROAD FREIGHT TRANSPORT MARKET, %, UNITED STATES, 2017 - 2030
- Figure 86:
- MOST ACTIVE COMPANIES BY NUMBER OF STRATEGIC MOVES, COUNT, UNITED STATES, 2017 - 2023
- Figure 87:
- MOST ADOPTED STRATEGIES, COUNT, UNITED STATES, 2017 - 2023
- Figure 88:
- VALUE SHARE OF MAJOR PLAYERS, %, UNITED STATES
United States Road Freight Transport Industry Segmentation
Agriculture, Fishing, and Forestry, Construction, Manufacturing, Oil and Gas, Mining and Quarrying, Wholesale and Retail Trade, Others are covered as segments by End User Industry. Domestic, International are covered as segments by Destination. Full-Truck-Load (FTL), Less than-Truck-Load (LTL) are covered as segments by Truckload Specification. Containerized, Non-Containerized are covered as segments by Containerization. Long Haul, Short Haul are covered as segments by Distance. Fluid Goods, Solid Goods are covered as segments by Goods Configuration. Non-Temperature Controlled, Temperature Controlled are covered as segments by Temperature Control.| End User Industry | Agriculture, Fishing, and Forestry |
| Construction | |
| Manufacturing | |
| Oil and Gas, Mining and Quarrying | |
| Wholesale and Retail Trade | |
| Others | |
| Destination | Domestic |
| International | |
| Truckload Specification | Full-Truck-Load (FTL) |
| Less than-Truck-Load (LTL) | |
| Containerization | Containerized |
| Non-Containerized | |
| Distance | Long Haul |
| Short Haul | |
| Goods Configuration | Fluid Goods |
| Solid Goods | |
| Temperature Control | Non-Temperature Controlled |
| Temperature Controlled |
Need A Different Region or Segment?
Customize Now
Market Definition
- Agriculture, Fishing, and Forestry (AFF) - This end user industry segment captures the external (outsourced) logistics expenditure incurred by the AFF industry players on road freight transport service. The end user players considered are the establishments primarily engaged in growing crops, raising animals, harvesting timber, harvesting fish & other animals from their natural habitats and providing related support activities. Herein, across the value chain, Logistics Service Providers (LSPs) play a crucial role in acquisition, storage, handling, transportation, and distribution activities for the optimal & continuous flow of inputs (seeds, pesticides, fertilizers, equipment, and water) from manufacturers or suppliers to the producers and smooth flow of output (produce, agro-goods) to distributors/ consumers. This includes both termperature controlled and non-temperature controlled logistics, as and when required according to the shelf life of goods being transported or stored.
- Construction - This end user industry segment captures the external (outsourced) logistics expenditure incurred by the construction industry players, on road freight transport service. The end user players considered are the establishments primarily engaged in constructing, repairing and renovating residential & commercial buildings, infrastructure, engineering works, subdividing and developing land. Logistics Service Providers (LSPs) play a crucial role in increasing profitability of construction projects by maintaing the inventory of raw materials & equipment, time-critical supplies and by providing other value added services for effective project management.
- Containerized Road Freight Transport - The segment captures the external (outsourced) logistics expenditure incurred by the road freight transport service end users on Full-Truck-Load (FTL) services. FTL road freight transport is characterized as a full single load not combined with other shipments. It comprises of shipments (i) devoted to the goods of a single shipper (ii) taken directly from a point of origin to one or more destination points (iii) comprising of bulk mail truck transportation (iv) comprising of both Container (Full Container Load, FCL)/Non-Container trucking services (v)comprsing of goods requiring temperature controlled or non-temperature controlled transportation services (vi) comprising of bulk liquid tankering (vii) invoving trucking of waste (viii) hazardous material trucking. Related value added services (VAS) of sorting, consolidation, deconslidation are included in the other services segment of freight and logistics market.
- Export Trends and Import Trends - Overall logistics performance of an economy is positively and significantly (statistically) correlated to its trade performance (exports and imports). Hence, in this industry trend, total value of trade, major commodities/ commodity groups and the major trade partners, for the studied geography (country or region as per the scope of report) have been analysed alongside the impact of major trade/logistics infrastructure investments & regulatory environment.
- Fluid Goods - The segment captures the external (outsourced) logistics expenditure incurred by the road freight transport service end users for the transport of bulk liquids, that are often used in extraction, manufacturing, food processing, agriculture industries among others. It includes transportation of liquids like (i) Chemicals/ hazardous goods (for instance acids) (ii) Water (potable as well as waste) (iii) Oil and gas (upstream as well as downstream like gasoline, fuel, crude oil, or propane), (iv) Food grade bulk liquids (like milk, or juice), (v) Rubber, (vi) Agrichemical products, among others. These goods are generally transported through tanker trucking.
- Fuel Price - Fuel price spikes can cause delays and diruption for logistics service providers (LSPs), while drops in the same can result in higher short-term profitability and increased market rivalry to offer consumers with the best deals. Hence, the fuel price variations have been studied over the review period and presented along with the causes as well as market impacts.
- Full-Truck-Load (FTL) Road Freight Transport - The segment captures the external (outsourced) logistics expenditure incurred by the road freight transport service end users on Full-Truck-Load (FTL) services. FTL road freight transport is characterized as a full single load not combined with other shipments. It comprises of shipments (i) devoted to the goods of a single shipper (ii) taken directly from a point of origin to one or more destination points (iii) comprising of bulk mail truck transportation (iv) comprising of both Container (Full Container Load, FCL)/Non-Container trucking services (v)comprsing of goods requiring temperature controlled or non-temperature controlled transportation services (vi) comprising of bulk liquid tankering (vii) invoving trucking of waste (viii) hazardous material trucking. Related value added services (VAS) of sorting, consolidation, deconslidation are included in the other services segment of freight and logistics market.
- GDP Distribution by Economic Activity - Nominal Gross Domestic Product and distribution of the same, across major economic sectors in the geography studied (country or region as per scope of the report) have been studied and presented in this industry trend. As GDP is positively related to the profitability and growth of logistics industry, this data has been used in adjunction to the input-output tables/ supply-use tables for analyzing the potential major contributing sectors towards the logistics demand.
- GDP Growth by Economic Activity - Growth of Nominal Gross Domestic Product across major economic sectors, for the geography studied (country or region as per scope of the report) have been presented in this industry trend. This data has been utilized for assessing the growth of logistics demand from all the market end users (economic sectors considered here).
- Inflation - Variations in both Wholesale Price Inflation (YoY change in producer price index) and Consumer Price Inflation have been presented in this industry trend. This data has been used to assess the inflationary environment as it plays a vital role in smooth functioning of the supply chain, directly impacting the logistics operational cost components e.g., pricing of tyres, driver wages & benefits, energy/fuel prices, maintenace costs, toll charges, warehousing rents, custom brokerage, forwarding rates, courier rates etc. hence impacting the overall freight and logistics market.
- Key Industry Trends - The report section named "Key Industry Trends" include all the key variables/parameters studied to better analyze the market size estimates and forecasts. All the trends have been presented in the form of data points (time series or latest available data points) along with analysis of the paramter in the form of concise market relevant commentary, for the geography studied (country or region as per the scope of report).
- Key Strategic Moves - The action taken by a company to differentiate from its competitor or used as a general strategy is referred to as a key strategic move (KSM). This includes (1) Agreements (2) Expansions (3) Financial Restructuring (4) Mergers and Acquisitions (5) Partnerships, and (6) Product Innovations. Key players (Logistics Service Providers, LSPs) in the market have been shortlisted, their KSM have been studied and presented in this section.
- Less than-Truck-Load (LTL) Road Freight Transport - The segment captures the external (outsourced) logistics expenditure incurred by the road freight transport service end users on Less than-Truck-Load (LTL) services. LTL road freight transport is characterized as multiple shipments combined onto a single truck for multiple deliveries within a network. It comprises of establishments (i) primarily engaged in general and specialized freight trucking of less than complete truck-loads, (ii) characterized by the use of terminals to consolidate shipments, generally from several shippers, into a single truck for haulage between a load assembly terminal and a disassembly terminal, where the load is sorted and shipments are re-routed for delivery (iv) Less than-Container-Load (LCL) shipping/ Groupage Shipping in case of trucking services. The activities in scope include (i) local pick-up, (ii) line-haul, and (iii) local delivery. Related value added services (VAS) of sorting, consolidation, deconslidation are included in the other services segment of freight and logistics market.
- Logistics Performance - Logistics Performance and Logistics Costs are the backbone of trade, and influences trade costs, making countries compete globally. Logistics performance is influenced by market wide adopted supply chain management strategies, government services, investments & policies, fuel/ energy costs, inflationary environment etc. Hence, in this industry trend, the logistics performance of the geography studied (country/ region as per the scope of report) has been analysed and presented over the review period.
- Major Truck Suppliers - Market share of truck brands is influenced by factors like geographical preferences, portfolio of truck types, truck prices, local production, truck repair & maintenance service peneteration, customer support, technological innovations (like electric vehicles, digitalization, autonomous trucks), fuel efficiency, financing options, annual maintenance costs, availability of substitutes, marketing startegies etc. Hence, the distribution (share % for base year of the study) of truck sales volume for leading truck brands and commentary on current market scenario & market anticipation over the forecast period have been presented in this industry trend.
- Manufacturing - This end user industry segment captures the external (outsourced) logistics expenditure incurred by the Manufacturing industry players, on road freight transport service. The end user players considered are the establishments primarily engaged in the chemical, mechanical or physical transformation of materials or substances into new products. Logistics Service Providers (LSPs) play a crucial role in maintaining a smooth flow of raw materials across the supply chain, enabling timely delivery of finished goods to distributors or end customers and storing & supplying the raw materials to clients for just-in-time manufacturing.
- Modal Share - Freight Modal Share is influenced by factors like modal productivity, government regulations, containerization, distance of shipment, temperature control requirements, type of goods, international trade, terrain, speed of delivery, shipment weight, bulk shipments, etc. Also, modal share by tonnage (tons) and modal share by freight turnover (ton-km) differ as per average distance of shipments, weight of major commodity groups transported in the economy and number of trips. This industry trend represents the distribution of freight transported by mode of transport (tons as well as ton-km), for the study base year.
- Oil and Gas, Mining and Quarrying - This end user industry segment captures the external (outsourced) logistics expenditure incurred by the extraction industry players, on road freight transport service. The end user players considered are the establishments that extract naturally occurring mineral solids, such as coal and ores; liquid minerals, such as crude petroleum; and gases, such as natural gas. Logistics Service Providers (LSPs) covers entire phases from upstream to downstream and plays a crucial role in the transportation of machinery, drilling equipments, extracted minerals, crude oil & natural gas and refined/ processed products from one place to another.
- Other End Users - Other end user segment captures the external (outsourced) logistics expenditure incurred by the financial services (BFSI), real estate, educational services, healthcare, and professional services (administrative, waste management, legal, architectural, engineering, design, consulting, scientific R&D), on road freight transport service. Logistics Service Providers (LSPs) plays a crucial role in the reliable movement of supplies and documents to/from these industries such as transporting any equipment or resources required, shipping confidential documents and files, movement of medical goods & supplies (surgical supplies and instruments, including gloves, masks, syringes, equipment) to name a few.
- Producer Price Inflation - It indicates inflation from viewpoint of the producers viz. the average selling price received for their output over a period of time. Annual change (YoY) of producer price index is reported as wholesale price inflation in the "Inflation" industry trend. As WPI captures dynamic price movements in most comprehensive way, it is widely used by governments, banks, industry, business circles and is deemed important in formulation of trade, fiscal and other economic policies. The data has been used in adjunction to consumer price inflation for better understanding the inflationary environment.
- Road Freight Pricing Trends - Freight pricing by mode of transport (USD/tonkm), over the review period, has been presented in this industry trend. The data has been used in assessing the inflationary environment, impact on trade, freight turnover (tonkm), road freight transport market demand and hence the road freight transport market size.
- Road Freight Tonnage Trends - Freight tonnage (weight of goods in tons) handled by mode of transport, over the review period, has been presented in this industry trend. The data has been used as one of the parameters apart from average distance per shipment (km), freight volume (tonkm), and freight pricing (USD/tonkm) to assess the freight transport market size.
- Road Freight Transport - Hiring a road freight transport logistics service provider (LSP) or haulier (outsourced logistics), for the transport of commodities constitutes road freight transport market. The scope of study includes (i) road transport of goods reported by hauliers registered in the reporting countries (ii) transport of raw materials or manufactured goods (solids as well as fluids) (iii) transport using commerical motor vehicles (rigid trucks or tractor-trailers, (iv) Full-Truck-Load (FTL) or Less than-Truck-Load (LTL) transport (v) containerized or non-containerized transport (vi) temperature controlled or non-temperature controlled trasnport, (vii) short haul or long haul (Over-the-road, OTR) transport, (viii) used office or household goods transport (movers and packers), (ix) other specialized cargo transport (dangerous goods, oversized cargo) and (x) outsourced first mile/ middle mile/last mile delivery shipments undertaken by road freight transport players. The scope does not include (i) transport undertaken by hauliers registered in other countries (ii) last mile meal delivery market (iii) grocery delivery market (iv) transportation via road network undertaken/ reported by Courier, Express, and Parcel (CEP) players.
- Road Length - As infrastructure plays a vital role in an economy's logistics performance, variables like length of roads, distribution of road length by surface category (paved v/s unpaved), distribution of road length by road classification (expressways v/s highways v/s other roads), have been analysed and presented in this industry trend.
- Segmental Revenue - Segmental Revenue has been triangulated or computed and presented for all the major players in the market. It refers to the road freight transport market specific revenue earned by the company, over the base year of study, in the geography studied (country or region as per the scope of report). It is computed through the study and analysis of major parameters like financials, service portfolio, employee strength, fleet size, investments, number of countries present in, major economies of concern, etc. that have been reported by the company in its annual reports, webpage. For companies having scarce financial disclosures, paid databases like D&B Hoovers, Dow Jones Factiva have been resorted to and verified through industry/expert interactions.
- Short Haul Road Freight Transport - The segment captures the external (outsourced) logistics expenditure incurred by the road freight transport service end users on local trucking (less than 100 miles). It includes the road transport of goods (i) within a single administrative area and its hinterland, (ii) by smaller trucks and pickup trucks (iii) via containerized as well as dry bulk services (iv) intermodal from ports, container terminals or airports, and (v) outsourced first mile/ last mile delivery shipments undertaken by road freight transport players.
- Transport and Storage Sector GDP - Value and growth of Transport and Storage Sector GDP has a direct relation to the freight and logistics market size, and hence road freight transport market size. Therefore, this variable has been studied and presented over the review period, in value terms (USD) and as share % of total GDP, in this industry trend. The data has been supported by concise and relevant commentary around the investments, developments, and current market scenario.
- Trends in E-Commerce Industry - Enhanced internet connectivity and boom in smartphone penetration, coupled with increasing disposable incomes, has led to a phenomenal growth in the e-commerce market globally. Online shoppers require fast and efficient delivery of their orders leading to an increase in the demand for logistics services especially e-commerce fulfilment services. Hence, the Gross Merchandise Value (GMV), historial and projected growth, breakup of major commodity groups in e-commerce industry for the studied geography (country or region as per scope of the report) have been analysed and presented in this industry trend.
- Trends in Manufacturing Industry - Manufacturing industry involves the transformation of raw materials into finished products, while logistics industry ensures the efficient flow of raw materials to the factory, and the transport of manufactured products to the distributors & consumers. Demand-Supply of both industries are highly cross-linked and critical for a seamless supply chain. Hence, the Gross Value Added (GVA), breakup of GVA into major manufacturing sectors, and growth of manufacturing industry over the review period have been analysed and presented, in this industry trend.
- Trucking Fleet Size By Type - Market share of truck types is influenced by factors like geographical preferences, major end user industries, truck prices, local production, truck repair & maintenance service peneteration, customer support, technological disruptions (like electric vehicles, digitalization, autonomous trucks) etc. Hence, the distribution (share % for base year of study) of truck parc volume by type of truck, market disruptors, truck manufacturing investments, truck specifications, truck use & import regulations, and market anticipation over the forecast period have been presented in this industry trend.
- Trucking Operational Costs - The prime reasons for measuring/ benchmarking logistics performance of any trucking company are to reduce operational costs and increase profitability. On the other hand, measuring operational costs helps to identify whether and where to make operational changes to control expenses and identify areas for improved performance. Hence, in this industry trend, trucking operational costs and the variables involved viz. driver wages & benefits, fuel prices, repairs & maintenance costs, tyre costs etc. have been studied over the base year of study, and presented for the geography studied (country or region as per the scope of report).
- Wholesale and Retail Trade - This end user industry segment captures the external (outsourced) logistics expenditure incurred by the wholesalers and retailers, on road freight transport service. The end user players considered are the establishments primarily engaged in wholesaling or retailing merchandise, generally without transformation, and rendering services incidental to the sale of merchandise. Logistics Service Providers (LSPs) plays a crucial role in the reliable movement of supplies to and finished products from production houses to the distributors and finally to the end customer covering activites like material sourcing, transportation, order fulfillment, warehousing & storage, demand forecasting, inventory management etc.
| Keyword | Definition |
|---|---|
| Cabotage | Road transport by a motor vehicle registered in a country performed on the national territory of another country. |
| Cross Docking | Cross docking is a logistics procedure where products from a supplier or manufacturing plant are distributed directly to a customer or retail chain with marginal to no handling or storage time. Cross docking takes place in a distribution docking terminal; usually consisting of trucks and dock doors on two (inbound and outbound) sides with minimal storage space. The name ‘cross docking’ explains the process of receiving products through an inbound dock and then transferring them across the dock to the outbound transportation dock. |
| Cross Trade | International road transport between two different countries performed by a road motor vehicle registered in a third country. A third country is a country other than the country of loading/embarkation and than the country of unloading/disembarkation. |
| Dangerous Goods | The classes of dangerous goods carried by Road are those defined by the fifteenth revised edition of the UN Recommendations on the Transport of Dangerous Goods, United Nations, Geneva 2007. They include Class 1: Explosives; Class 2: Gases; Class 3: Flammable Liquids; Class 4: Flammable solids- substances liable to spontaneous combustion; substances which, on contact with water, emit flammable gases; Class 5: Oxidizing substances and organic peroxides; Class 6: Toxic and infectious substances; Class 7: Radioactive material and Class 8: Corrosive substances, Class 9: Miscellaneous dangerous substances and articles. |
| Direct Shipment | Direct shipment is a method of delivering goods from the supplier or the product owner to the customer directly. In most cases, the customer orders the goods from the product owner. This delivery scheme reduces transportation and storage costs, but requires additional planning and administration. |
| Drayage | A drayage is a form of trucking service that connects the different modes of shipping (intermodal), such as ocean freight or air freight. It’s a short-haul trip that transports goods from one place to another, usually before or after its long-haul shipping process. Drayage trucks move cargo to and from various destinations, such as container ships, storage lots, order fulfillment warehouses, and rail yards. Typically, drayage only transports goods in short distances and operates only in one metropolitan area. It also requires only one trucker in a single shift. But despite this, but it plays an important role in long-haul shipping because it gets the goods to the cargo and vice versa. It makes intermodal transport much more efficient and enables the seamless transfer of goods to the end customer. |
| Dry van | A dry van is a type of semi-trailer that's fully enclosed to protect shipments from outside elements. Designed to carry palletized, boxed or loose freight, dry vans aren't temperature-controlled (unlike refrigerated “reefer” units) and can't carry oversized shipments (unlike flatbed trailers). |
| Final Demand | Final demand includes all types of commodities (goods as well as services) consumed as final use and might include personal consumption, or consumption by government, by businesses as capital investment, and as exports. includes all types of commodities (goods as well as services) consumed as final use and might include personal consumption, or consumption by government, by businesses as capital investment, and as exports. |
| Flatbed Truck | A flatbed truck is a type of truck with rigid design. It has a back body that is flatly shaped for easy loading and unloading of goods. The flatbed truck is mostly used to transport heavy, oversized, wide and indelicate goods such as machinery, building supplies or equipment. Due to the truck open body, the goods transported with it must not be vulnerable to rain. By functionality, the flatbed truck is comparable to a flatbed trailer. |
| Inbound Logistics | Inbound logistics is the way materials and other goods are brought into a company. This process includes the steps to order, receive, store, transport and manage incoming supplies. Inbound logistics focuses on the supply part of the supply-demand equation. |
| Intermediate Demand | Intermediate demand includes goods, services, and maintenance and repair construction sold to businesses, excluding capital investment. |
| International Loaded | Place of loading of goods in reporting country (i.e., country in which the vehicle performing the transport is registered) and place of unloading in a different country. |
| International Unloaded | Place of unloading of goods in reporting country (i.e., country in which the vehicle performing the transport is registered) and place of loading in a different country. |
| OOG cargo | Out of Gauge (OOG) cargo is any cargo that can not be loaded into six-sided shipping containers simply because it is too large. The term is a very loose classification of all cargo with dimensions beyond the maximum 40HC container dimensions. That is a length beyond 12.05 meters – a width beyond 2.33 meters – or a height beyond 2.59 meters. |
| Pallets | Raised platform, intended to facilitate the lifting and stacking of goods. |
| Part load | A part load describes goods which only fills a truck partially. In essence, the quantity of the shipment is bigger than the Less Than Truckload (LTL) shipment. Also, the shipment cannot fully occupy a truck i.e. its capacity is much lower than a Full Truckload (FTL) shipment. |
| Paved Road | Road surfaced with crushed stone (macadam) with hydrocarbon binder or bituminized agents, with concrete or with cobblestone. |
| Reverse Logistics | Reverse logistics comprises of the sector of supply chains that process anything returning inwards through the supply chain or traveling ‘backward’ through the supply chain. |
| Road Freight Transport Service | Hiring a trucking agency for transport of commodities (raw materials or manufactured goods including both solids and liquids) form the origin to a destination within the country (domestic) or cross-border (international) constitutes road freight transport market. The service might be Full-Truck-Load or Less than-Truck-Load, containerized or non-containerized, temperature controlled or non temperature controlled, short haul or long haul. |
| Tautliner vehicle | Tautliner and curtainsider are used as generic names for curtain sided trucks/trailers. The curtains are permanently fixed to a runner at the top and detachable rails/poles at front and rear, allowing the curtains to be drawn open and forklifts used all along the sides for easy and efficient loading and unloading. When closed for travel, vertical load restraint straps are attached to a rope rail beneath the truck bed, connecting the truck bed and curtain along both sides. Winches at either end of the curtain tension it, hence the 'Tautliner' name. This stops the curtain from flapping or drumming in the wind and can also help retain light loads from slipping sideways. |
| Transport for hire or reward | The carriage for remuneration of goods. |
| Unpaved Road | Road with a stabilized base not surfaced with crushed stone, hydrocarbon binder or bituminized agents, concrete or cobblestone. |
Need More Details on Market Definition?
Ask a Question
Research Methodology
Mordor Intelligence follows a four-step methodology in all our reports.
- Step-1: Identify Key Variables: In order to build a robust forecasting methodology, the variables and factors identified in Step-1 are tested against available historical market numbers. Through an iterative process, the variables required for market forecast are set and the model is built on the basis of these variables.
- Step-2: Build a Market Model: Market-size estimations for the forecast years are in nominal terms. Inflation is considered to be a part of the pricing, and the average selling price (ASP) is varying throughout the forecast period for each country
- Step-3: Validate and Finalize: In this important step, all market numbers, variables and analyst calls are validated through an extensive network of primary research experts from the market studied. The respondents are selected across levels and functions to generate a holistic picture of the market studied.
- Step-4: Research Outputs: Syndicated Reports, Custom Consulting Assignments, Databases & Subscription Platforms

Get More Details On Research Methodology
Download PDF


