
United States Residential Heating Equipment Market Size and Share
Market Overview
| Study Period | 2020 - 2031 |
|---|---|
| Forecast Data Period | 2026 - 2031 |
| Base Year Market Size (2025) | USD 29.53 Billion |
| Market Size (2026) | USD 31.63 Billion |
| Market Size (2031) | USD 44.61 Billion |
| Growth Rate (2026 - 2031) | 7.12% CAGR |
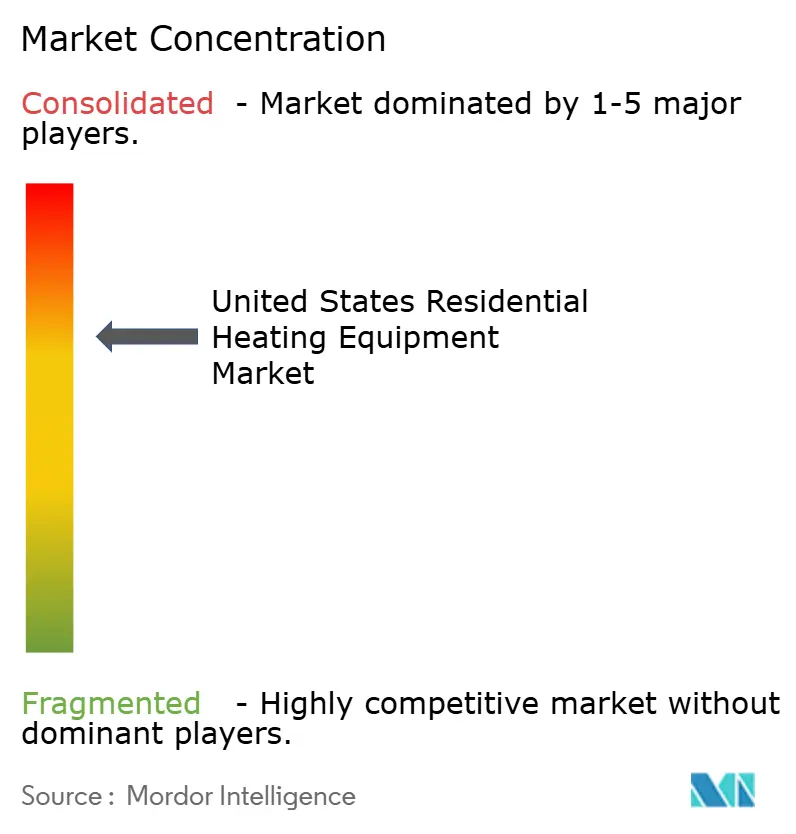
| Market Concentration | Medium |
Major Players *Disclaimer: Major Players sorted in no particular order Image © Mordor Intelligence. Reuse requires attribution under CC BY 4.0. | |
United States Residential Heating Equipment Market Analysis by Mordor Intelligence
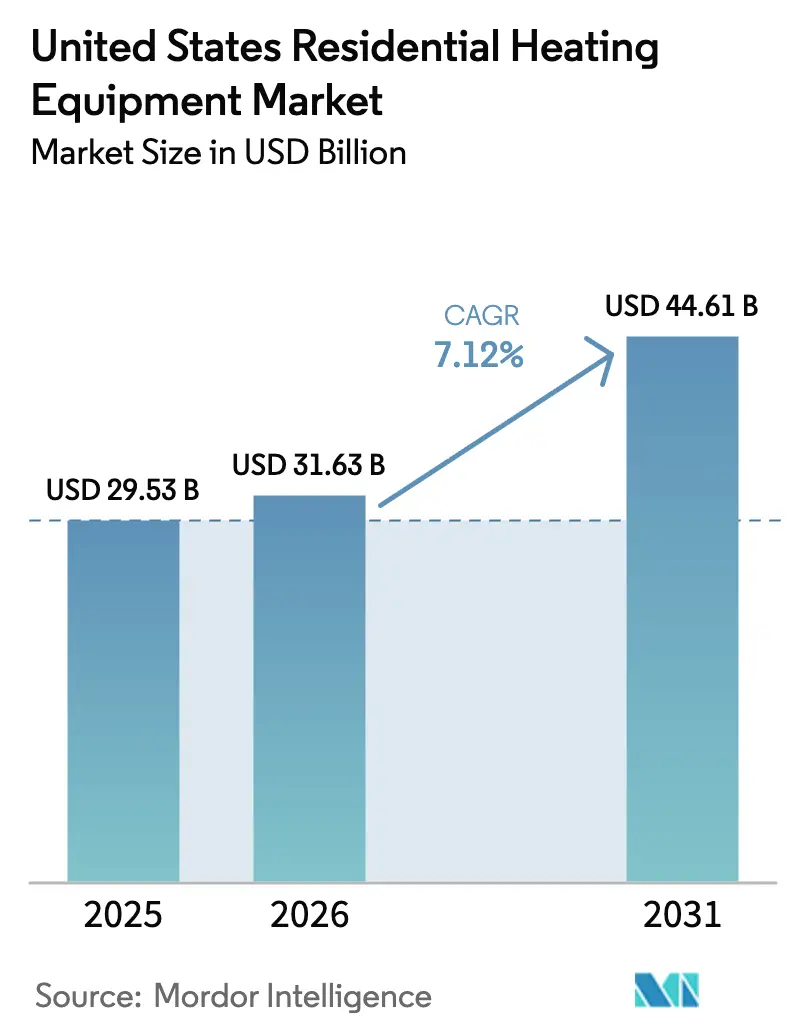
The US Residential Heating Equipment market size in 2026 is estimated at USD 31.63 billion, growing from 2025 value of USD 29.53 billion with 2031 projections showing USD 44.61 billion, growing at 7.12% CAGR over 2026-2031. Growth springs from the convergence of federal tax incentives, state electrification mandates, and cold-climate technology gains that lower operating costs and widen geographic suitability for heat pumps. Builders are accelerating specification changes ahead of the January 2026 California code deadline, while homeowners bring forward replacement decisions to capture the Energy Efficient Home Improvement Credit. Manufacturers that move fastest on variable-speed inverter designs and A2L-ready refrigerant platforms are capturing price premiums and locking in distributor shelf space as skilled-labor shortages constrain installation capacity. Natural-gas price volatility, ranging from USD 2.57/MMBtu in 2023 to regional peaks above USD 18/MMBtu, pulls homeowners toward fuel-agnostic options, yet the capital-cost gap between a heat pump and a baseline gas furnace persists despite subsidies. Over the outlook period, widespread grid-interactive controls are poised to create fresh revenue streams through demand-response programs, further tilting life-cycle economics in favor of high-efficiency electric equipment.
Key Report Takeaways
- By product type, gas furnaces led with 44.35% of US Residential Heating Equipment market share in 2025, while cold-climate heat pumps are advancing at an 10.78% CAGR through 2031.
- By technology, non-condensing systems accounted for 56.05% of the US Residential Heating Equipment market size in 2025, whereas variable-speed inverter platforms are projected to expand at 12.15% CAGR to 2031.
- By end-user, single-family detached homes secured 64.35% of demand in 2025; multi-family residential is the fastest-growing segment, expanding 11.22% CAGR through 2031.
- By distribution channel, the replacement/aftermarket captured 72.15% of revenue in 2025; new-construction sales are forecast to climb 9.58% CAGR as state electrification codes trigger mandatory heat-pump adoption.
Note: Market size and forecast figures in this report are generated using Mordor Intelligence’s proprietary estimation framework, updated with the latest available data and insights as of 2026.
United States Residential Heating Equipment Market Trends and Insights
Drivers Impact Analysis*
| Driver | (~) % Impact on CAGR Forecast | Geographic Relevance | Impact Timeline |
|---|---|---|---|
| Federal tax credits and IRA rebates for high-efficiency heat pumps | +2.1% | National, with higher uptake in Northeast and West Coast | Medium term (2-4 years) |
| State-level electrification building codes | +1.8% | California, New York, Washington, Massachusetts, with spillover to neighboring states | Long term (≥ 4 years) |
| Resale-value premium for ENERGY STAR-certified systems | +0.9% | National, concentrated in high-value housing markets | Medium term (2-4 years) |
| Cold-climate heat-pump technology advances | +1.4% | Northern states, Great Lakes region, Mountain West | Short term (≤ 2 years) |
| Smart-thermostat enabled demand-response revenues | +0.7% | Grid-constrained regions: Texas, California, Northeast ISO territories | Short term (≤ 2 years) |
| Aging housing-stock replacement cycle | +1.6% | National, with concentration in Rust Belt and older suburban developments | Long term (≥ 4 years) |
| Source: Mordor Intelligence | |||
Federal Tax Credits and IRA Rebates for High-Efficiency Heat Pumps
Tax incentives now cover 30% of project costs up to USD 2,000, and low-to-moderate income households can tap additional rebates that raise total support beyond 50% of installed cost.[1]ENERGY STAR, “Most Efficient 2025 Standards,” energystar.gov New 2025 eligibility rules that require ENERGY STAR Most Efficient certification push manufacturers toward higher-performance compressors and inverter logic, shortening product‐refresh cycles. An updated IRS qualified-manufacturer list features Carrier, Lennox, and Rheem, ensuring mainstream distribution of compliant models.[2]Internal Revenue Service, “Qualified Manufacturers of Energy Efficient Appliances,” irs.gov
State-Level Electrification Building Codes
California’s 2025 Building Energy Efficiency Standards obligate builders to install heat pumps in new homes beginning January 2026, a template Washington, Oregon, and New York are already adapting.[3]California Energy Commission, “2025 Building Energy Efficiency Standards,” energy.ca.gov Optional appendices in the 2024 IECC provide ready-made language that allows states to layer electric-ready requirements onto renovation permits, extending policy reach to the replacement market.
Cold-Climate Heat-Pump Technology Advances
All eight participants in the Department of Energy’s Cold Climate Heat Pump Challenge completed field testing in 2024; Carrier’s Infinity retained 100% capacity at 0 °F, while Bosch’s IDS Ultra maintained efficient output at –13 °F. Variable-speed inverters, enhanced vapor-injection cycles, and machine-learning defrost sequences combine to overcome historic capacity degradation in northern regions and open fresh addressable demand.
Aging Housing-Stock Replacement Cycle
Roughly 40% of US homes will require system replacement inside ten years, coinciding with peak federal incentives. Emergency replacements account for 60% of residential HVAC sales, favoring distributors with deep inventory and 24-hour contractor networks. As median home age nears 40 years, the replacement wave provides predictable volume that smooths exposure to new-construction cycles.
Restraints Impact Analysis*
| Restraint | (~) % Impact on CAGR Forecast | Geographic Relevance | Impact Timeline |
|---|---|---|---|
| High upfront capital cost vs. baseline gas furnaces | -1.9% | National, most pronounced in price-sensitive markets and rural areas | Short term (≤ 2 years) |
| Natural-gas price volatility complicating pay-back | -0.8% | Regional variations: Northeast, Midwest gas-dependent areas | Medium term (2-4 years) |
| Electric-grid constraints during extreme cold events | -0.6% | Texas ERCOT territory, California during peak demand periods | Short term (≤ 2 years) |
| Skilled labor shortage for heat-pump installation | -1.3% | National, acute in high-growth metropolitan areas | Medium term (2-4 years) |
| Source: Mordor Intelligence | |||
High Upfront Capital Cost Versus Baseline Gas Furnaces
Installed heat-pump prices run USD 8,000–15,000 compared with USD 4,000–8,000 for gas furnaces, and the gap endures even after credits. Additional expenses for panel upgrades and refrigerant handling prolong payback in low-gas-price regions. The American Council for an Energy-Efficient Economy notes that cost-effectiveness improves markedly in zones with fewer than 7,000 heating degree days.
Skilled Labor Shortage for Heat-Pump Installation
The industry faces 42,500 annual openings and lags in training capacity, raising labor premiums just as incentives stimulate demand. A2L refrigerants bring new safety protocols, lengthening installer training times and concentrating talent in urban centers, leaving rural homeowners underserved.
*Our forecasts treat driver/restraint impacts as directional, not additive. The impact forecasts reflect baseline growth, mix effects, and variable interactions.
Segment Analysis
By Product Type: Heat Pumps Challenge Gas Furnace Dominance
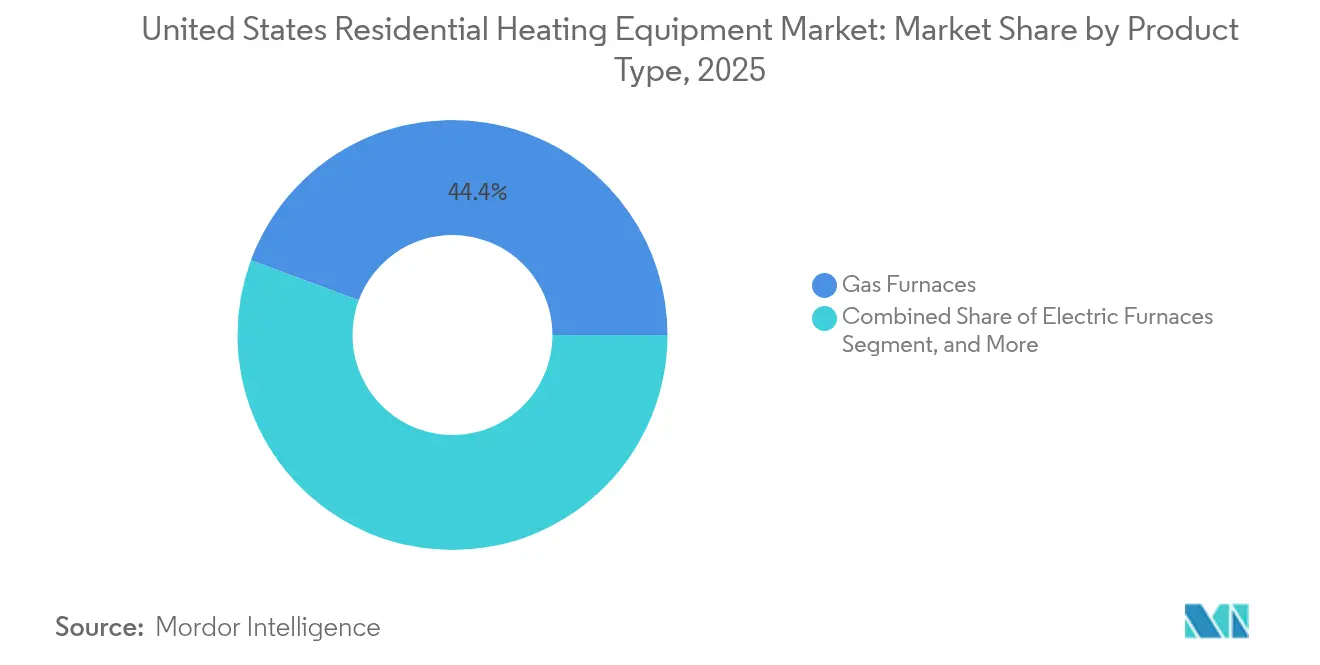
Gas furnaces accounted for 44.35% of the US Residential Heating Equipment market in 2025, yet cold-climate heat pumps are running an 10.78% CAGR that threatens to erode that share quickly. The US Residential Heating Equipment market size for cold-climate heat pumps is projected to widen substantially as the Department of Energy challenge proves viability at sub-zero temperatures. Hybrid systems that pair a heat pump with a secondary gas stage offer a migration path for homeowners wary of full electrification, and they preserve comfort during polar vortex events.
Federal credits of up to USD 2,000 on heat-pump water heaters are encouraging bundled space-and-water-heating retrofits, lifting average order value for contractors. Electric furnaces hold ground in renewable-rich states where time-of-use electricity rates track below seasonal gas pricing, while boilers see attrition except in legacy hydronic markets. Manufacturers that can supply both 240 V ducted and 120 V ductless formats occupy a stronger position with distributors eager to streamline stocking decisions.


By Technology: Variable-Speed Inverters Drive Efficiency Gains
Non-condensing platforms still represented 56.05% of the US Residential Heating Equipment market share in 2025, but impending federal minimum-efficiency updates skew orders toward condensing and inverter units. Variable-speed compressors are climbing at a 12.15% CAGR, enabling load-following operation that cuts cycling losses and unlocks demand-response payments worth USD 50-100 per year in select ISO territories.
The US Residential Heating Equipment market size for smart connected systems is set to accelerate as utilities offer bill credits to households that allow 2-hour temperature setbacks during grid stress. A2L compliance drives redesigns that integrate multi-sensor leak detection, while cloud analytics deliver predictive maintenance alerts that reduce truck rolls for service contractors. The transition phase favors OEMs that can certify a complete refrigerant-safe ecosystem, including recovery equipment and training modules.
By Distribution Channel: Replacement Market Dominates Equipment Sales
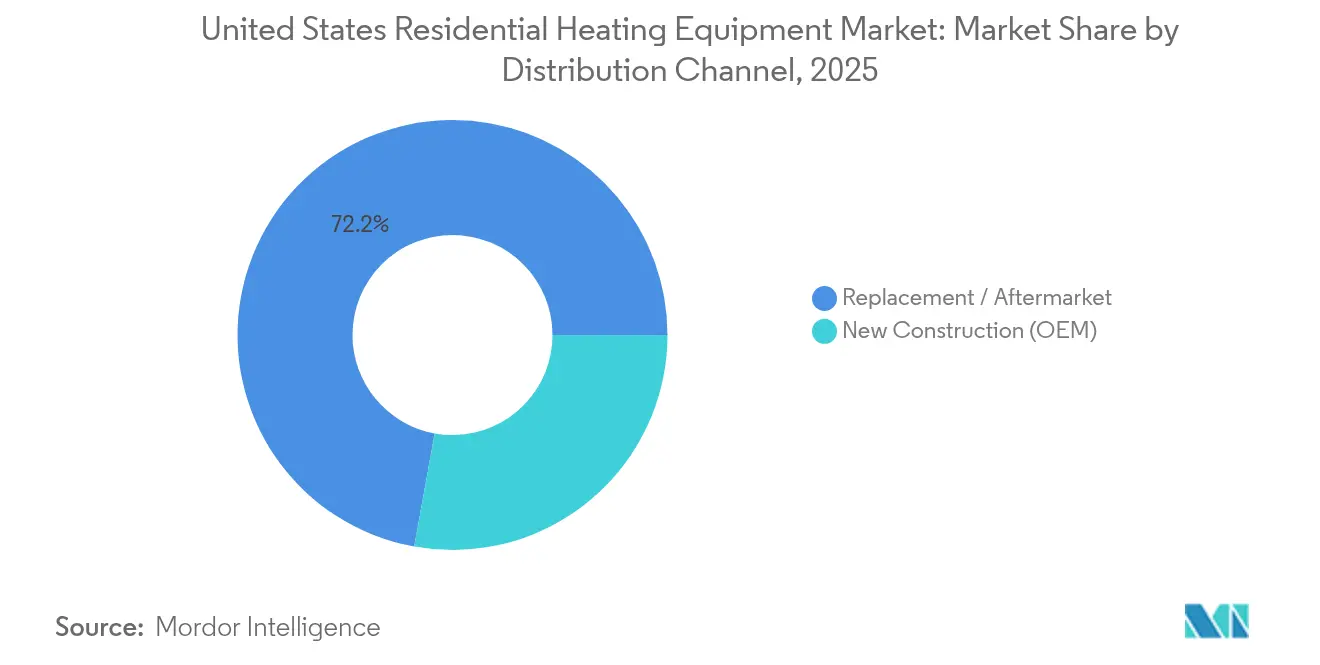
The replacement channel captured 72.15% of 2025 shipments, underscoring the mature installed base and the time-critical nature of emergency swaps. Distributors with overnight delivery and 24/7 technical hotlines secure loyalty from contractors who influence 80% of homeowner choices at point of failure. The US Residential Heating Equipment market size tied to new construction, though smaller, is growing 9.58% CAGR as states introduce mandatory heat-pump standards.
OEMs that synchronize product launches with distributor pre-season stocking windows mitigate the risk of lost sales due to inventory gaps. Digital quoting tools that link contractor tablets to real-time warehouse inventory support faster close rates and steer brand preference at replacement moments. Forward-looking distributors are also piloting subscription models that bundle equipment, maintenance, and smart-thermostat upgrades into predictable monthly fees.
By End-User: Multi-Family Residential Accelerates Electrification
Single-family detached houses generated 64.35% of 2025 revenue, but multi-family projects record the fastest 11.22% CAGR to 2031 as urban developers seek lower-carbon footprints and simpler venting layouts. The US Residential Heating Equipment market size for centralized heat-pump systems in apartment towers is buoyed by economies of scale that trim per-unit cost and streamline maintenance contracts.
Electric-ready wiring provisions added to the 2024 IECC ensure that even gas-equipped buildings can switch to electric heat in future retrofits, a feature that investors now price into valuations. Manufactured homes demand bespoke equipment that meets HUD regulations; suppliers able to design compact, high-static-pressure units hold a niche advantage. Condominium associations weigh common-area infrastructure costs against individual ownership benefit, nudging adoption toward shared plant models.
Geography Analysis
Regional climate diversity, local energy costs, and state mandates shape adoption trajectories. The Northeast and West Coast lead in heat-pump penetration thanks to aggressive electrification policies, higher delivered-gas prices, and robust utility incentives. California’s 2025 code requires heat pumps in all new homes from January 2026 onward, a playbook Oregon, Washington, and New York are mirroring. The US Residential Heating Equipment market benefits from these mandates as builders front-load orders to ensure project compliance.
The Southeast capitalizes on mild winters that maximize coefficient of performance, making heat pumps the default new-build choice even without mandates. ERCOT’s 2021 freeze and 2023 summer peaks placed reliability at center stage in Texas; homeowner sentiment now favors dual-fuel or generator-paired systems that protect comfort when grid stability falters. The Midwest and Mountain West historically relied on inexpensive gas, yet cold-climate performance breakthroughs coupled with volatile commodity pricing are tilting cost-benefit analyses in favor of electrification.
Installation capacity varies. Metropolitan areas attract technicians, compressing project timelines, whereas rural counties endure wait times exceeding four weeks during peak replacement season. Federal rebates flow disproportionately to higher-income zip codes under percentage-based tax credits, but state-administered direct rebates are beginning to close the equity gap in lower-income communities. Over the forecast period, regional differences in grid carbon intensity will further influence technology selection as municipalities adopt emissions-based building performance standards.
Regulatory Landscape
The United States residential heating equipment market is shaped by mandatory federal efficiency and test-procedure rules administered by the U.S. Department of Energy (DOE) under EPCA, along with the U.S. Environmental Protection Agency (EPA) ENERGY STAR program, which affects specification choices and rebate eligibility. DOE efficiency compliance continues to rely on established metrics such as AFUE for furnaces and SEER2/HSPF2 for heat pumps, while DOE also updates test procedures that change how products are certified and compared across regions.
On the voluntary labeling side, EPA revised the ENERGY STAR Heat Pump Specification to Version 6.2 in February 2026, and the ENERGY STAR Furnace Version 5 specification is scheduled to take effect on July 31, 2026, tightening the performance bar for products seeking the label. These updates increasingly influence OEM roadmaps and distributor stocking toward higher-efficiency and compliant platforms, particularly where federal credits and utility programs reference ENERGY STAR tiers as an eligibility screen.
Value Chain Analysis
The value chain starts with upstream inputs (steel and aluminum for cabinets and heat exchangers, copper tubing, and electronics and semiconductors for control boards) and moves through component makers such as compressors, inverter suppliers, sensor providers, and developers of communicating controls. HVAC OEMs including Carrier, Trane, Lennox, Bosch, Rheem, and Daikin assemble and certify complete systems. Downstream, national and regional distributors (for example, Watsco and Ferguson) connect OEM inventory with installing contractors, who shape brand choice during replacement events and also bundle thermostats, commissioning, and service plans that affect lifecycle performance.
Regulatory transitions also act as a supply-chain forcing function. The EPA Technology Transitions Rule effective January 1, 2025 sets a 700-GWP limit for new residential air conditioning and heat pump equipment, accelerating the shift away from R-410A and increasing demand for A2L-capable components, training, and handling infrastructure. Channel dynamics matter as well, since pre-buying ahead of the 2025 refrigerant transition has contributed to inventory imbalances and localized shortages of A2L refrigerant canisters. OEM actions such as Trane increasing factory pre-charge levels for R-454B systems (May 2025) show how manufacturers intervene to keep contractor installs moving.
Competitive Landscape
The top eight vendors, including Carrier, Lennox, Trane, Bosch, Rheem, and Johnson Controls, control slightly above 90% of revenue, giving the US Residential Heating Equipment market a moderately concentrated structure. Scale economies allow these firms to absorb A2L refrigerant transition costs and fund domestic assembly lines that shorten delivery lead times. Bosch’s 2024 acquisition of Johnson Controls’ residential HVAC assets for USD 8 billion (EUR 7.3 billion) expanded its ducted-system footprint and nearly doubled HVAC revenue, illustrating an inorganic route to heat-pump scale.
Strategic alliances illustrate technology hedging. The Samsung-Lennox joint venture addresses variable-refrigerant-flow and ductless niches. Trane and Mitsubishi maintain a parallel partnership focused on inverter expertise. Patent filings highlight a shift toward algorithmic defrost cycles, sensor fusion for leak detection, and grid-responsive firmware. Product launches increasingly spotlight API-ready controls that integrate with utility marketplaces, positioning OEMs as energy-service platform providers rather than equipment suppliers only.
Supply-chain dynamics shape competitive posture. Compressors and inverter boards remain exposure points; vendors that pre-buy silicon or co-invest with semiconductor manufacturers secure allocation priority. Labor scarcity elevates the value of robust installer-training academies; Carrier University trained 30,000 technicians in 2024, a differentiator during the A2L transition. Distributor exclusivity contracts tighten as national players such as Watsco leverage data analytics to guide stocking and co-op advertising funds, reinforcing brand loyalty among contractors.
United States Residential Heating Equipment Industry Leaders
Daikin Industries Ltd.
Emerson Electric Co.
Robert Bosch LLC
Lennox International Inc.
Johnson Controls International plc
- *Disclaimer: Major Players sorted in no particular order

Market Opportunities and Future Outlook
A near-term opportunity is emerging around product and compliance simplification for contractors and distributors during overlapping transitions in efficiency specifications and refrigerants. EPA updated ENERGY STAR Heat Pump Version 6.2 in February 2026 and scheduled ENERGY STAR Furnace Version 5 to take effect on July 31, 2026. In practice, OEMs that pair compliant equipment with diagnostics-forward controls and installer training can gain an advantage in the time-sensitive replacement channel, which accounts for 72.15% of 2025 revenue in this report.
Policy and legal developments also create room for dual-path portfolios that cover both high-efficiency electric options and gas upgrades where infrastructure constraints persist. In June 2026, the U.S. Supreme Court vacated the D.C. Circuit decision related to DOE furnace rules and sent the case back for reconsideration. In July 2026, Senator Joni Ernst introduced S. 4892 (SMART Energy Efficiency Standards Act), focused on shifting regional efficiency compliance from installation date to manufacture date. Together, these signals increase the value of flexible manufacturing, inventory-risk management, and hybrid system offerings that help contractors serve different code environments while keeping warehouses aligned to evolving compliance triggers.
Recent Industry Developments
- May 2026: Bosch Home Comfort Group introduced the YORK YH9 variable-speed heat pump, positioned as a 21 SEER2 system with features aimed at simpler installation and diagnostics. The launch strengthens Bosch's competitive posture in high-efficiency residential heat pumps under the YORK brand as the market moves toward inverter-driven platforms and refrigerant-transition-ready product lines.
- April 2026: Daikin Comfort Technologies North America launched the Daikin ALTHERMA 3 H HT, a high-temperature air-to-water heat pump designed for residential heating and cooling with optional domestic hot water. This expands Daikin's addressable footprint beyond ducted air-to-air systems into hydronic replacement scenarios where homeowners want electrification without reworking the entire distribution system.
- September 2024: Rheem Manufacturing announced an agreement to acquire Nortek Global HVAC. The deal broadened Rheem's product portfolio and channel depth in residential HVAC, supporting wider coverage across price tiers and strengthening its position with distributors and contractors.


Research Methodology Framework and Report Scope
Market Definition and Coverage
This market covers the value of equipment purchased for heating in US homes, including major systems and appliances used to warm indoor spaces or produce hot water for residential use.
Scope exclusions: It excludes installation labor, extended warranties, and most ongoing repair services that are billed separately from the equipment.
Segmentation Overview
- By Product Type
- Gas Furnaces
- Electric Furnaces
- Boilers
- Air and Water Heaters
- Heat Pumps
- Hybrid Systems
- Other Types
- By Technology
- Condensing
- Non-Condensing
- Variable-Speed Inverter
- Smart Connected
- By End-User
- Single-Family Detached Homes
- Multi-Family Residential
- Manufactured Housing
- Other Ed-users
- By Distribution Channel
- Replacement / Aftermarket
- New Construction (OEM)
Data Sources, Market Sizing, and Validation
Desk Research
Desk work started by mapping what counts as residential heating equipment in the US, then aligning that with common product reporting and building-activity indicators. We used public sources such as the US Energy Information Administration for heating fuel trends, US Census Bureau releases for housing starts and completions, and US Bureau of Labor Statistics series for inflation signals that can affect pricing.
To ground replacement demand, we also reviewed program and standards signals published by agencies such as the US Department of Energy, together with efficiency and adoption context from sources such as ENERGY STAR program materials. Company filings, earnings decks, and reputable press were checked to understand mix shifts, for example heat pump versus furnace momentum, and how channel behavior is changing. Where needed, paid subscriptions for company financials and news intelligence, plus a patent database, were used only to verify product roadmaps and timing of launches, not to set the final totals. This list is indicative, and many other sources were also reviewed for data collection, validation, and clarification.
Primary Interviews and Surveys
Primary interviews and short surveys were used to stress-test what we saw in secondary sources, especially around price realization, replacement cycles, and how incentives are changing purchase decisions. We spoke with a mix of manufacturers, distributors, contractors, and energy-efficiency stakeholders across the US so gaps in unit volumes, average selling price (ASP) progression, and channel margins could be closed with practical inputs.
Distribution of primary research fieldwork respondents
| Company type | Respondent position | Region |
|---|---|---|
| Top tier: 35% | CXOs: 12% | |
| Mid tier: 46% | Functional/Unit leaders: 38% | |
| Smaller Players: 19% | Managers: 50% |
Market-Sizing & Forecasting
Sizing was built using a top-down and bottom-up approach, where national housing activity and replacement demand signals were first used to reconstruct the equipment demand pool, then cross-checked with selective supplier and channel rollups. In practice, we began from housing starts, completion trends, and the installed base replacement cadence, and then applied penetration and mix assumptions by equipment category to arrive at an annual value estimate.
To translate demand into value, the model used a clear ASP x volume logic, with ASPs adjusted using inflation indicators and primary feedback on realized pricing rather than list prices. Key inputs included housing starts and permits, equipment replacement cycles by home type, policy and incentive timing, efficiency standard shifts, and the relative share movement between furnaces, boilers, water heaters, and heat pumps. When product-level volumes were not visible in public data, gaps were handled through bounded assumptions that were validated with contractor and distributor checks, then revisited until they aligned with observed market direction.
For forecasting, scenario analysis was used because adoption is sensitive to incentives, fuel price signals, and code-related timing. We modeled a base case and a small set of alternative cases around heat pump uptake, retrofit intensity, and ASP movement, and then normalized the final forecast using expert consensus from primary discussions.
Data Validation & Update Cycle
Validation was done in layers, starting with consistency checks across housing activity, equipment mix, and pricing behavior, and then moving to variance checks against independent signals such as efficiency program momentum and broad manufacturer commentary. Where outliers were found, the assumptions were traced back to the specific driver, followed by a second review so the same issue did not repeat elsewhere in the model.
A multi-step analyst review is completed before sign-off, and re-contact is triggered when large deviations appear in ASP movements, category mix, or policy timing. The report is refreshed annually, and interim updates are made when material events occur, such as major standards changes or a visible demand shift. Before delivery, we do a final pass to incorporate the latest available indicators so the numbers reflect the most current view.
Mordor Intelligence's United States Residential Heating Equipment Market Sizing Compared With Other Published Estimates
Published market values for US residential heating equipment can look far apart, even when they appear to cover similar products. The gaps usually come from differences in what is counted as equipment revenue versus services, how average selling prices are stepped up over time, and whether the latest incentive and standards changes are reflected.
In our work, currency timing is kept consistent within the base year, and price changes are not assumed to move in a straight line when inflation and mix are shifting at the same time. The update cadence also matters because policy-driven demand can move within a year, and the table below reflects that refresh-led effect, a modeling choice applied by Mordor Intelligence.
Benchmark comparison
| Source | Market Size | Gaps in Research Methodology |
|---|---|---|
| Mordor Intelligence | USD 29.53 B (2025) | |
| Trade Journal A | USD 10.80 B (2022) | Often tracks a narrower heating system basket and uses an earlier base year, which can miss the more recent heat pump mix shift and post-2022 ASP step-ups. |
| Industry Brief B | USD 12.76 B (2025) | Tends to apply blended pricing without clear separation of equipment types and channels, and updates incentive and standards impacts less frequently, which can pull down the near-term value. |
The spread across published values is mainly explained by scope boundaries and timing of price and policy updates, rather than a single arithmetic issue. By keeping the equipment-only boundary clear, refreshing ASPs using recent realized signals, and re-checking assumptions with channel participants, our estimate stays traceable to repeatable inputs that a buyer can follow year by year.


Key Questions Answered in the Report
What is the current size of the US residential heating equipment market?
The market is valued at USD 31.63 billion in 2026 and is projected to reach USD 44.61 billion by 2031.
Which product segment is growing the fastest?
Cold-climate heat pumps are expanding at an 10.78% CAGR through 2031, outpacing every other product category.
Why are heat pumps gaining share over gas furnaces?
Federal tax credits, state electrification codes, and new inverter-based cold-climate designs have cut ownership costs and improved performance in freezing temperatures.
How large is the replacement market versus new construction?
Replacement and aftermarket sales account for 72.15% of 2025 revenue, while new-construction shipments are growing 9.58% CAGR as more states mandate heat-pump installations.
What is the biggest hurdle to faster heat-pump adoption?
Higher upfront capital costs remain the primary barrier, even after incentives, followed by a shortage of trained installers.
Which regions lead in heat-pump adoption?
The Northeast and West Coast rank highest due to aggressive electrification mandates, higher natural-gas prices, and robust utility incentive programs.
Page last updated on:






