United States Refrigerated Trucking Market Size and Share
Market Overview
| Study Period | 2018 - 2031 |
|---|---|
| Base Year For Estimation | 2025 |
| Forecast Data Period | 2026 - 2031 |
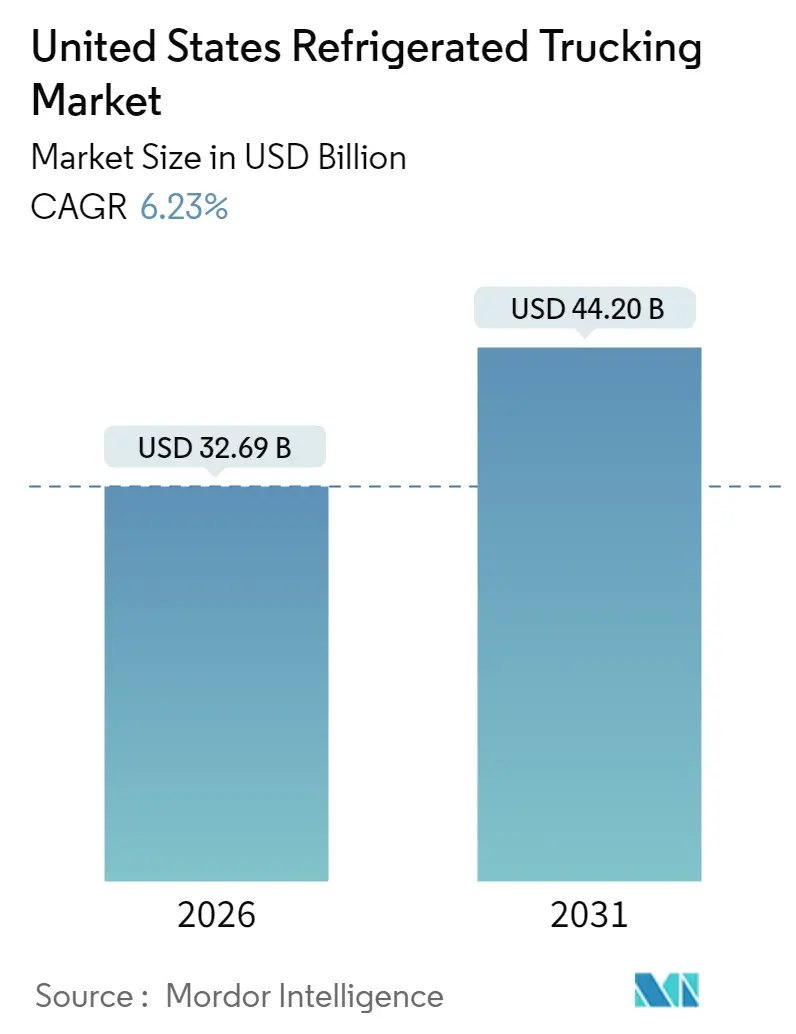
| Market Size (2026) | USD 32.69 Billion |
| Market Size (2031) | USD 44.2 Billion |
| Growth Rate (2026 - 2031) | 6.23% CAGR |
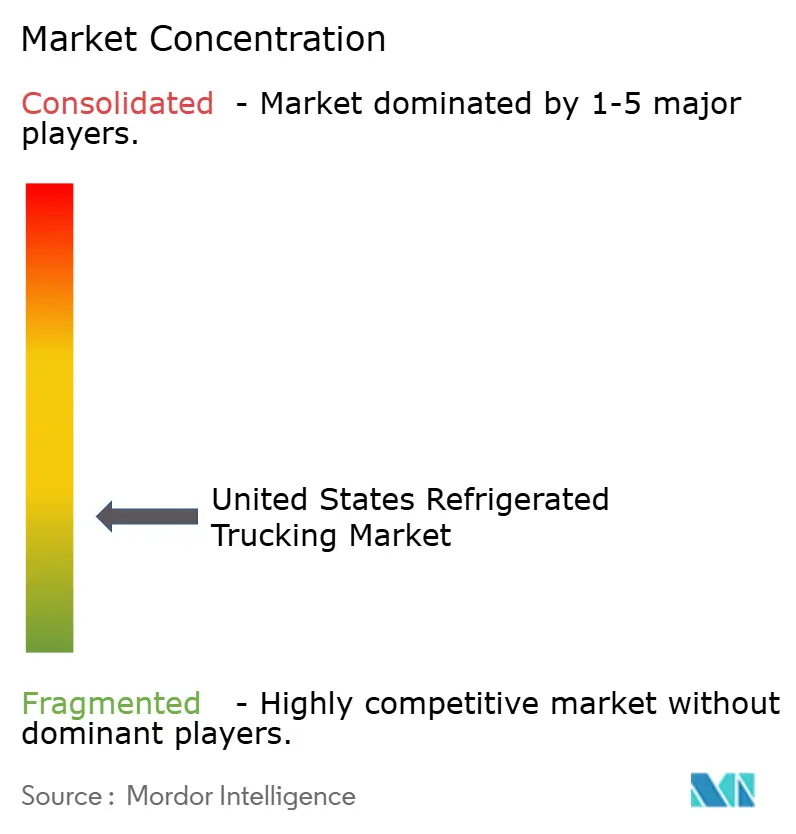
| Market Concentration | Low |
Major Players
*Disclaimer: Major Players sorted in no particular order Image © Mordor Intelligence. Reuse requires attribution under CC BY 4.0. |
|
United States Refrigerated Trucking Market Analysis by Mordor Intelligence
The United States refrigerated trucking market size in 2026 is estimated at USD 32.69 billion, growing from 2025 value of USD 30.77 billion with 2031 projections showing USD 44.2 billion, growing at 6.23% CAGR over 2026-2031. Growth stems from several converging forces: sustained consumer demand for year-round fresh food, expanding ultra-cold pharmaceutical distribution, and rising e-commerce grocery orders that shorten delivery windows. Operators are upgrading fleets with electric transport-refrigeration units to comply with zero-emission mandates, while artificial-intelligence routing platforms lower empty-mile ratios and spoilage costs. Consolidation among top carriers provides scale for expensive technology investments, yet a fragmented tail of regional specialists remains crucial for last-mile coverage. Parallel investment in modern cold-storage nodes underpins network optimization, especially in Texas, the Gulf Coast, and Midwest agribusiness corridors.
Key Report Takeaways
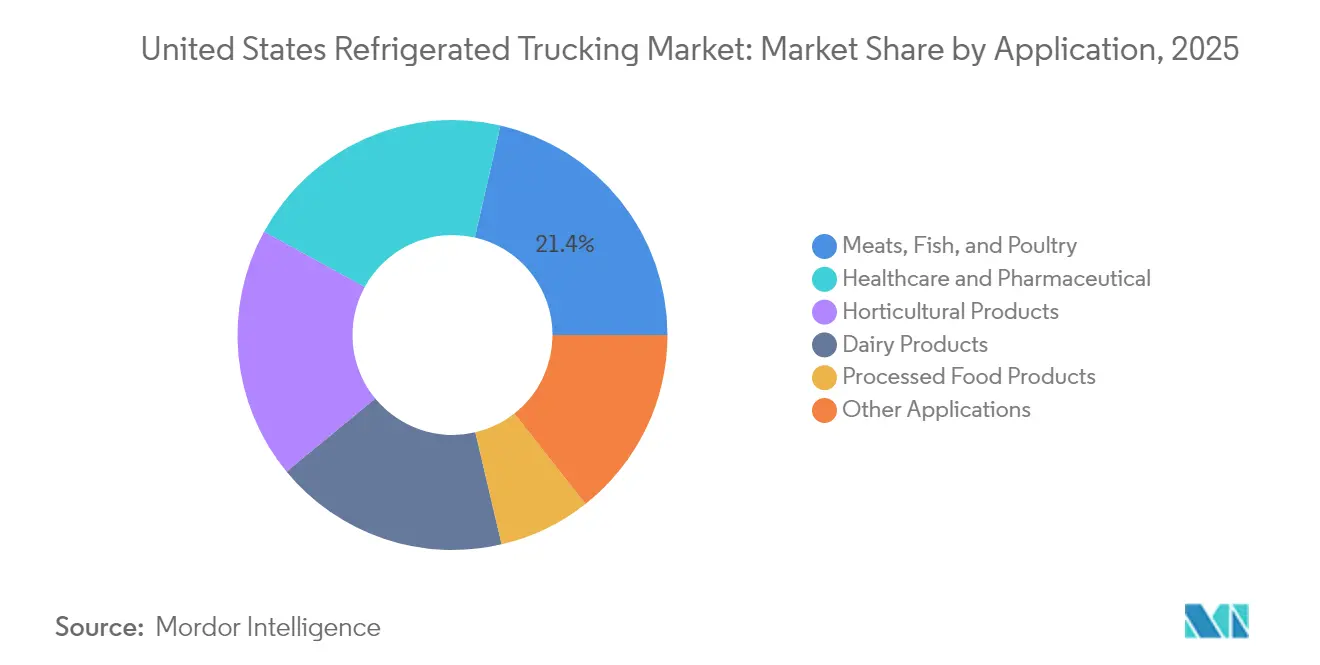
- By application, meats, fish, and poultry led with 21.42% of the United States refrigerated trucking market share in 2025; processed food products are forecast to expand at a 7.02% CAGR between 2026-2031.
- By truckload specification, full-truck-load accounted for 69.05% share of the United States refrigerated trucking market size in 2025, while less than-truck-load is expected to advance at a 6.82% CAGR between 2026-2031.
- By containerization, non-containerized freight commanded 85.45% of the revenue share in 2025; containerized moves are expected to grow at a 6.41% CAGR between 2026-2031.
- By distance, long haul captured 71.60% of the revenue share in 2025 and is projected to expand at a 6.54% CAGR between 2026-2031.
- By goods configuration, solid goods held 72.90% of the revenue share in 2025, whereas fluid goods are projected to register a 6.63% CAGR between 2026-2031.
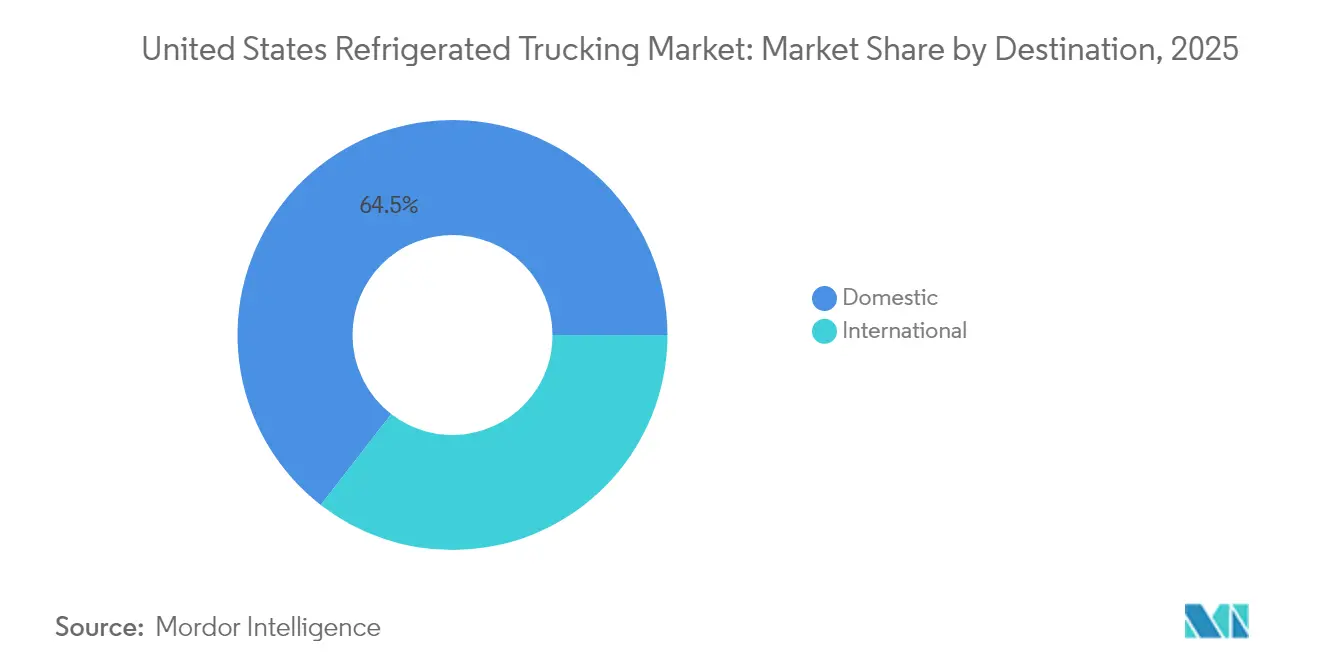
- By destination, domestic corridors represented 64.50% of the revenue share in 2025; international corridors are set to grow at a 6.55% CAGR between 2026-2031.
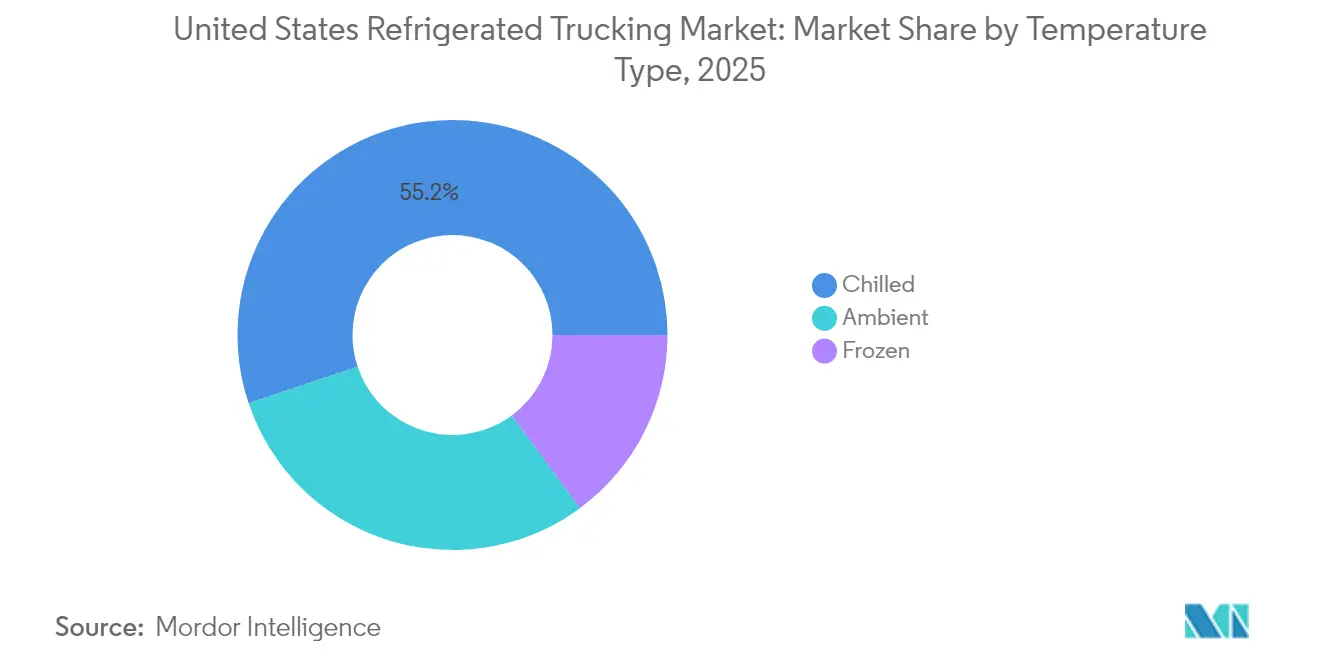
- By temperature type, the chilled segment led with 55.15% of 2025 revenue share, while the frozen segment is expected to advance at a 6.93% CAGR between 2026-2031.
Note: Market size and forecast figures in this report are generated using Mordor Intelligence’s proprietary estimation framework, updated with the latest available data and insights as of January 2026.
United States Refrigerated Trucking Market Trends and Insights
Drivers Impact Analysis
| Driver | (~) % Impact on CAGR Forecast | Geographic Relevance | Impact Timeline |
|---|---|---|---|
| FSMA enforcement spurring upgrades in refrigerated fleets | +1.2% | National food hubs | Medium term (2-4 years) |
| Rapid growth in home-delivered groceries increasing demand for regional cold chain capacity | +1.1% | Northeast and West Coast metros | Short term (≤ 2 years) |
| Rising demand for specialty pharmaceuticals requiring ultra-cold (below -20°C) transport lanes | +0.8% | Biotech corridors | Long term (≥ 4 years) |
| Electrified TRUs benefiting from state-level zero-emission incentive programs | +0.6% | California, expanding Northeast | Medium term (2-4 years) |
| AI-powered dynamic routing helping reduce spoilage and minimize empty miles | +0.9% | Nationwide large fleets | Short term (≤ 2 years) |
| Agricultural export corridor grants (e.g., Gulf Coast produce) improving back-haul utilization | +0.5% | Gulf Coast and Texas border | Long term (≥ 4 years) |
| Source: Mordor Intelligence | |||


FSMA Enforcement Spurring Upgrades in Refrigerated Fleets
Section 204 of the Food Safety Modernization Act takes full effect in January 2026 and obliges carriers to furnish 24-hour traceability records for foods on the FDA’s list[1]"FSMA Final Rule on Requirements for Additional Traceability Records for Certain Foods," Food and Drug Administration, fda.gov. Fleets are outfitting vans with IoT sensors, blockchain-enabled documentation, and GPS temperature probes, cutting spoilage by 30% while lifting on-time performance by 25%. Early adopters market compliance as a premium service for pharma shippers, who face recall costs of USD 78,000 per incident when excursions occur. The regulation thereby transforms traceability from a cost center into a competitive differentiator, pushing laggards toward tech-enabled retrofits or acquisition by better-capitalized rivals.
Rapid Growth in Home-Delivered Groceries Increasing Regional Cold-Chain Capacity
E-commerce grocery receipts are set to total USD 1.24 trillion in 2025, with last-mile activity representing roughly 50% of logistics spend. Retailers are allocating more than USD 1 billion to automated cold-storage hubs positioned closer to dense urban clusters. Modular refrigeration panels enable flexible temperature zoning, letting carriers combine produce, dairy, and frozen SKUs on the same route without cross-contamination. Innovative lockers and portable cooling totes preserve integrity when end-consumers miss delivery windows, shrinking spoilage write-offs and reinforcing brand loyalty. Demand for high-frequency, low-volume drops thereby elevates regional specialists in the United States refrigerated trucking market, particularly around New York, Los Angeles, and Seattle.
Rising Demand for Specialty Pharmaceuticals Requiring Ultra-Cold Transport Lanes
Cell- and gene-therapy pipelines require storage below −20 °C, spawning premium ultra-cold corridors that yield elevated revenue per mile. Operators are installing cryogenic reefers fitted with AI-enabled monitoring that predicts temperature deviations before product is compromised, answering FDA guidelines on biologics distribution[2]"Vaccines, Blood & Biologics," Food and Drug Administration, fda.gov. High barriers to entry—validation tests, chain-of-custody audits, and strict documentation—shield incumbents able to satisfy complex GMP protocols. Consequently, contract logistics alliances between pharmaceutical producers and carriers anchor long-term, inflation-protected contracts within the United States refrigerated trucking market.
AI-Powered Dynamic Routing Helps Reduce Spoilage and Minimize Empty Miles
Deployments of machine-learning dispatch platforms have trimmed empty-mile ratios from 13.5% to 10.6%, raised load counts 9.3%, and boosted linehaul revenue 5.7%. Algorithms weigh historical temperature data, traffic congestion, and dock-appointment windows, recalculating routes in near real time. Predictive maintenance alerts surface compressor glitches before cargo risk escalates, slashing unplanned downtime. Freed from manual dispatch, fleet managers redirect focus to network design and customer onboarding, amplifying adoption of digital tools throughout the United States refrigerated trucking market.
Restraints Impact Analysis
| Restraint | (~) % Impact on CAGR Forecast | Geographic Relevance | Impact Timeline |
|---|---|---|---|
| Shortage of reefer-qualified drivers putting upward pressure on labor costs | −1.4% | Nationwide, acute on rural lanes | Short term (≤ 2 years) |
| Stricter TRU emissions regulations increasing capital costs | −0.9% | California leading | Medium term (2-4 years) |
| Uncertainty over lithium-ion battery fire codes slowing adoption of electric TRUs | −0.6% | Varies by state | Medium term (2-4 years) |
| Cybersecurity breaches targeting cold chain telematics disrupting operations | −0.5% | Large multi-fleet operators | Short term (≤ 2 years) |
| Source: Mordor Intelligence | |||
Shortage of Reefer-Qualified Drivers is Putting Upward Pressure on Labor Costs
Vacancies total 24,043 seats, costing USD 95.5 million weekly in forgone revenue. Reefer duties demand temperature checks, hazmat familiarity, and tighter appointment windows, narrowing the qualified labor pool relative to dry-van work. Cold-warehouse turnover elevates wait-time frustrations, worsening attrition. Although FMCSA exemptions let carriers seat commercial-learner-permit holders without CDL escorts, safety concerns remain. Enhanced compensation and upskilling programs are becoming table stakes across the United States refrigerated trucking market.
Stricter TRU Emissions Regulations are Increasing Capital Costs
California mandates 15% annual fleet conversion toward zero-emission TRUs, effective through 2029[3]“Zero-Emission Transport Refrigeration Unit Regulation Summary,” California Air Resources Board, arb.ca.gov. Electric units cost more than conventional diesel, and charging infrastructure at depots and customer docks often lags equipment delivery. While HVIP vouchers cover up to USD 400,000 per unit, oversubscription leaves many operators self-funding electrification. Uncertain technology roadmaps—solid-state batteries versus hydrogen fuel cells—complicate long-term ROI calculations in the United States refrigerated trucking market.
Segment Analysis
By Application: Processed Food Products Drive Innovation in Cold Chain Technology
Processed Food Products are expected to expand at a 7.02% CAGR (2026-2031), outstripping all other verticals in the United States refrigerated trucking market. Meats, Fish, and Poultry maintained a 21.42% United States refrigerated trucking market share in 2025, signifying continued reliance on uninterrupted cold-chain links.
Meal-kit providers and frozen entrée brands now demand SKU-level temperature data, spurring investments in reefer compartmentalization and controlled-atmosphere packaging. Carrier collaboration with food processors yields pre-cool staging protocols that cut ambient ingress at dock doors. Healthcare and pharmaceutical shippers leverage ultra-cold validation lanes created for biologics, while horticultural exporters benefit from USDA-funded backhaul upgrades, extending shelf life for berries and leafy greens en route to Midwest distribution hubs. Advanced polymer linings inside trailers allow rapid temperature swings for dairy products, enabling mixed-load economics without violating product-specific storage rules.
Note: Segment shares of all individual segments available upon report purchase

By Containerization: Non-Containerized Freight Maintains Dominance
Non-containerized reefers kept an 85.45% United States refrigerated trucking market share in 2025, owing to specialized hardware and lane flexibility. Containerized refrigerated flows are expected to grow at a 6.41% CAGR (2026-2031) as port authorities expand plug-in points, and carriers sync rail and truck hand-offs to shrink door-to-door transit times.
Houston ColdPort’s 315,101 ft² facility and Port Gulfport’s USD 73 million expansion create new intermodal staging nodes that shorten drayage distance and slash demurrage risk. IoT-sensor arrays embedded in reefer containers track shock, humidity, and location, helping shippers validate integrity across marine-rail-road segments.
By Distance: Long Haul Operations Drive Market Growth
Long haul freight claims 71.60% of the revenue share in 2025 and is expected to grow the fastest at 6.54% CAGR (2026-2031) as cross-country produce, meat, and pharma volumes escalate. Autonomous pilots amassed 50,000 miles without accident on the Atlanta-Dallas lane, foreshadowing cost reductions once regulatory green lights emerge.
Extended-range diesel-electric hybrids prolong asset life in harsh desert corridors, while predictive maintenance platforms alert terminals to compressor wear mid-route. Short-haul lanes enjoy electrification gains, but battery-density constraints and sparse highway charging keep long-haul diesel viable through 2030, underpinning the bulk of the United States refrigerated trucking market.
By Destination: International Trade Drives Cross-Border Cold-Chain Development
Domestic routes still comprise 64.50% of revenue in 2025, yet international shipments are expected to advance at a 6.55% CAGR between 2026-2031. Texas surpassed California on reefer volumes thanks to robust Mexican produce inflows and improved customs throughput.
USMCA harmonization and USDA pre-clearance programs at Port Houston simplify document cycles, minimizing dwell times that could compromise perishables. Carriers fit reefers with dual-band GPS and e-seals to satisfy both U.S. and Mexican regulatory checkpoints, reinforcing cross-border resilience and expanding the scope of the United States refrigerated trucking market.
Note: Segment shares of all individual segments available upon report purchase
By Goods Configuration: Fluid Goods Leverage Specialized Transport Requirements
Solid goods, fresh produce, dairy, frozen entrees, accounted for 72.90% of total value in 2025, but fluid goods such as liquid chocolate, brewing inputs, and biotech reagents are forecast to grow 6.63% CAGR (2026-2031). Specialized insulated tanks with on-board refrigeration and CIP (clean-in-place) systems reduce contamination risk, commanding rate premiums.
DOT hazmat rules heighten driver-training costs; however, smart-tank telemetry now monitors temperature, pressure, and microbial counts in real time, curbing spoilage claims and raising trust among high-value shippers in the United States refrigerated trucking market.
By Temperature Type: Frozen Applications Accelerate Cold Chain Innovation
Chilled freight still leads with 55.15% of the revenue share in 2025, but frozen categories are expected to climb at a 6.93% CAGR (2026-2031) on expanding frozen meals, ice cream, and biologic therapies. Cryogenic reefers integrate phase-change plates to hold −70°C for 120 hours without shore power, hedging against blackout risks.
Internet of Things (IoT) sensors feed anomaly detectors that forecast compressor failure six hours ahead, preventing total load loss. Improved vacuum-panel insulation cuts energy draw by 18%, enhancing route length flexibility across the United States refrigerated trucking market.
Note: Segment shares of all individual segments available upon report purchase
By Truckload Specification: Less-Than-Truck-Load (LTL) Consolidation Drives Efficiency Gains
Full-Truck-Load remains the workhorse at 69.05% share of the United States refrigerated trucking market size in 2025, a reflection of route density and simpler temperature management. However, LTL volumes are forecast to increase 6.82% CAGR (2026-2031) as direct-to-consumer models emphasize shipment frequency over pallet counts.
Multi-temperature trailers and AI route engines let LTL carriers consolidate compatible SKUs without compromising safety seals, raising profit per cubic foot. Knight-Swift’s 2024 LTL acquisition added 10% terminal capacity and widened two-day service footprints to 70% of U.S. households, exemplifying how consolidation chases network density and customer coverage.
Geography Analysis
Texas now anchors the highest reefer load-to-truck ratio at 14.4, more than double California’s 5.1, propelled by Mexican agricultural imports and expanding in-state crop output. Gulf Coast port spending, USD 73 million at Gulfport and USDA cold-treatment certification in Houston, strengthens export lanes for poultry, beef, and tree fruit. Coupled with agricultural-corridor grants, the Gulf region is evolving into a balanced headhaul-backhaul ecosystem that cushions rate volatility.
The Midwest leverages dense meat-processing clusters and abundant cold-storage capacity to feed East Coast consumption zones efficiently. However, many warehouses date back four decades, spurring retrofit projects that integrate solar-assisted refrigeration and automated pallet systems to pare energy costs. Rising e-commerce penetration across the Northeast intensifies demand for sub-24-hour grocery fulfillment, escalating short-haul reefer work around Boston, New York, and Philadelphia.
California remains a regulatory bellwether: zero-emission TRU rules catalyze rapid electrification rollout, with early adopters leveraging HVIP subsidies of up to USD 400,000 per unit. Technology diffusion crosses state borders as large fleets standardize assets nationwide, influencing purchasing decisions in Arizona, Nevada, and Oregon. Meanwhile, Southeastern biotech corridors in North Carolina and Georgia fuel ultra-cold pharmaceutical lanes, diversifying regional revenue streams across the United States refrigerated trucking market.
Competitive Landscape
The United States refrigerated trucking market is moderately fragmented, with the top 10 carriers accounting for significant sector revenue, leaving ample room for niche specialists. Prime Inc leads in reefer sales, closely followed by KLLM Transport Services and Stevens Transport. J.B. Hunt’s autonomous program with Kodiak Robotics logged 50,000 zero-incident miles between Atlanta and Dallas, signaling future cost and safety advantages.
Mergers and acquisitions momentum continues. Knight-Swift’s Dependable acquisition expanded LTL door count by 10%, tightening control over dense metro delivery grids. Globally, DSV’s USD 15.8 billion absorption of DB Schenker adds cold-chain heft and broader procurement leverage. Smaller fleets turn to SaaS routing engines and trailer telematics subscriptions to match big-fleet efficiency without heavy balance-sheet strain.
Electric-TRU readiness and ultra-cold pharma credentials increasingly shape bid awards, nudging fleets into targeted CapEx cycles. Cybersecurity investments also differentiate providers as shippers scrutinize data-governance policies before committing high-value loads. Overall, technology adoption speed and regulatory compliance depth separate leaders from laggards within the United States refrigerated trucking market.
United States Refrigerated Trucking Industry Leaders
-
Prime, Inc.
-
C.R. England
-
KLLM Transport Services (Owned by Duff Capital Investors)
-
Stevens Transport, Inc.
-
Hirschbach Motor Lines, Inc.
- *Disclaimer: Major Players sorted in no particular order

Recent Industry Developments
- March 2025: C.R. England rolled out Lytx AI video-safety systems across 3,500 reefers to elevate driver coaching and incident prevention.
- February 2025: Hirschbach Motor Lines opened a Salt Lake City office, adding 30 regional jobs to back western expansion.
- January 2025: Prime, Inc. enhanced its "Success Lease Purchase Program," providing an affordable option for customers to lease or purchase trucks from a diverse inventory of both new and used tractors.
- July 2024: Knight-Swift acquired Dependable Highway Express’s LTL unit, enlarging terminal capacity and pushing coverage to 70% of U.S. households.


United States Refrigerated Trucking Market Report Scope
Refrigerated trucking (sometimes known as "reefer") is a freight shipping technique that specializes in the delivery of foods and items that require temperature control. Trailers include an in-built cooling system that keeps temperatures stable during travel to ensure cargo safety. The report provides key insights into the US refrigerated trucking market, along with technology developments, trends, and government regulations. It also focuses on market dynamics and competitive landscape, which is analyzed through the profiles of key players active. The report also covers the impact of COVID-19 on the market.
The US refrigerated trucking market is segmented by destination (national and international) and end user (food and beverages, agriculture, healthcare and pharmaceuticals (including biopharma), and other end users). The report offers the value in (USD billion) for the above segments.
| Horticultural Products |
| Dairy Products |
| Meats, Fish, and Poultry |
| Processed Food Products |
| Healthcare and Pharmaceutical |
| Other Applications |
| Full-Truck-Load (FTL) |
| Less than-Truck-Load (LTL) |
| Containerized |
| Non-Containerized |
| Long Haul |
| Short Haul |
| Fluid Goods |
| Solid Goods |
| Domestic |
| International |
| Chilled |
| Frozen |
| Ambient |
| Application | Horticultural Products |
| Dairy Products | |
| Meats, Fish, and Poultry | |
| Processed Food Products | |
| Healthcare and Pharmaceutical | |
| Other Applications | |
| Truckload Specification | Full-Truck-Load (FTL) |
| Less than-Truck-Load (LTL) | |
| Containerization | Containerized |
| Non-Containerized | |
| Distance | Long Haul |
| Short Haul | |
| Goods Configuration | Fluid Goods |
| Solid Goods | |
| Destination | Domestic |
| International | |
| Temperature Type | Chilled |
| Frozen | |
| Ambient |


Key Questions Answered in the Report
What is the value of the United States refrigerated trucking market in 2026?
The market is valued at USD 32.69 billion in 2026 with a projected 6.23% CAGR between 2026-2031.
Which application segment is growing the fastest?
Processed Food Products is forecast to expand at a 7.02% CAGR between 2026-2031.
How large is the long-haul portion of the market?
Long-haul freight holds 71.60% of 2025 revenue and is projected to grow at a 6.54% CAGR (2026-2031).
Why is Texas leading reefer freight?
Texas benefits from robust Mexican imports and agricultural output, registering a 14.4 load-to-truck ratio.
What challenges do carriers face in electrifying TRUs?
High capital costs, uneven fire-code standards, and limited charging infrastructure slow electric-TRU adoption.
Are autonomous reefers commercially proven?
A Kodiak Robotics partnership logged 50,000 miles with 100% on-time delivery and zero accidents, evidencing readiness for broader rollout.
Page last updated on:


