
Market Overview
| Study Period | 2020 - 2031 |
|---|---|
| Forecast Data Period | 2026 - 2031 |
| Base Year Market Size (2025) | USD 0.33 Billion |
| Market Size (2026) | USD 0.46 Billion |
| Market Size (2031) | USD 2.29 Billion |
| Growth Rate (2026 - 2031) | 38.12% CAGR |
| Market Concentration | Low |
Major Players *Disclaimer: Major Players sorted in no particular order Image © Mordor Intelligence. Reuse requires attribution under CC BY 4.0. | |
United States Real Time Payments Market Analysis by Mordor Intelligence
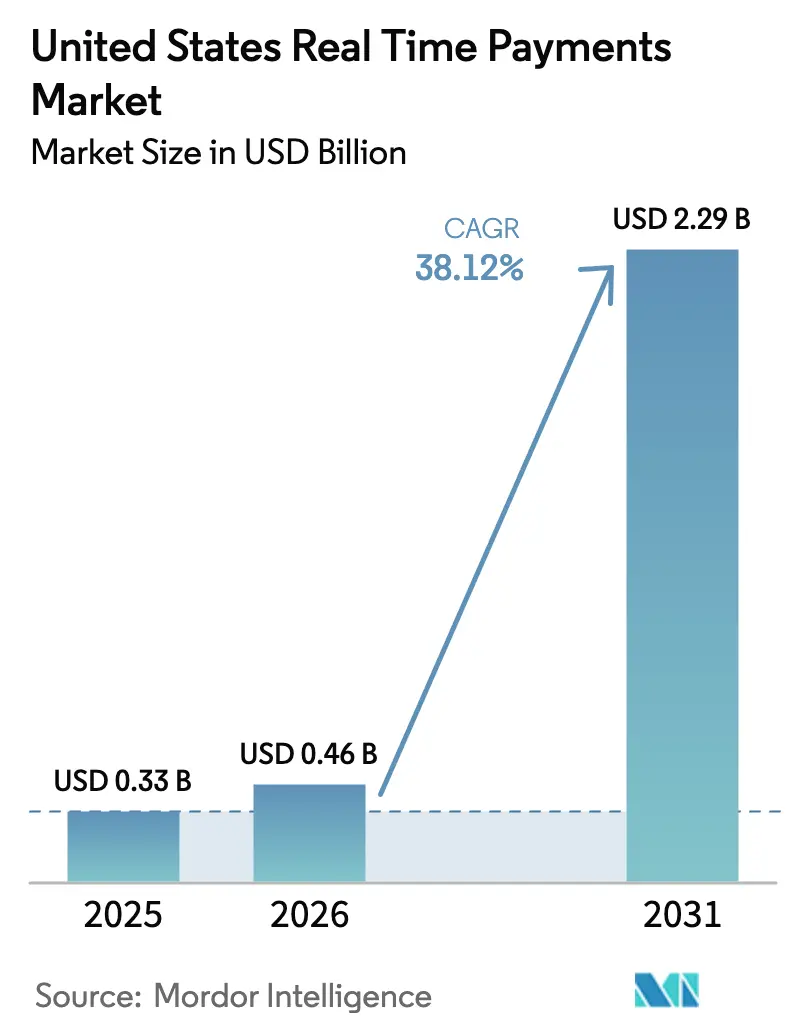
The US real time payments market size in 2026 is estimated at USD 0.46 billion, growing from 2025 value of USD 0.33 billion with 2031 projections showing USD 2.29 billion, growing at 38.12% CAGR over 2026-2031. Momentum reflects the combined force of the Federal Reserve’s FedNow Service, The Clearing House (TCH) RTP network expansion, and Executive Order 14247, which eliminates costly paper checks for federal disbursements by September 2025.[1]Bureau of the Fiscal Service, “Government Payment Modernization,” ustreasury.gov Enterprises are also reacting to USD 707 billion in trapped liquidity identified across S&P 1500 companies, making real-time settlement a working-capital imperative.[2]Bureau of the Fiscal Service, “Government Payment Modernization,” ustreasury.gov Technology maturity—especially cloud-native infrastructure—lowers entry barriers for the 900+ institutions already enrolled in FedNow and the 400+ participating in RTP, intensifying competitive pressure on incumbent card rails.
Key Report Takeaways
- By transaction type, P2P held 71.76% of the US real time payments market share in 2025, while the P2B segment is forecast to expand at a 39.45% CAGR through 2031.
- By component, platform solutions captured 63.28% revenue share in 2025; services are projected to grow at 33.9% CAGR to 2031.
- By deployment mode, cloud models accounted for 58.23% share of the US real time payments market size in 2025 and are advancing at 36.8% CAGR through 2031.
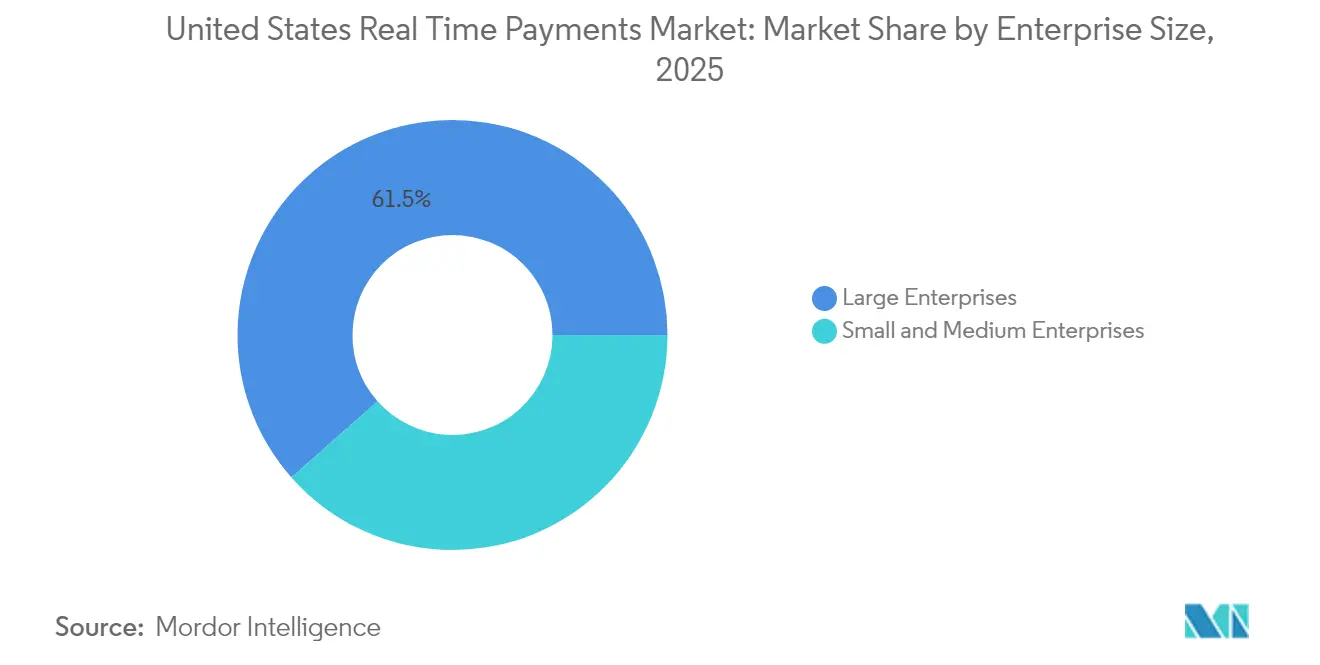
- By enterprise size, large enterprises led with 61.52% share in 2025, whereas SMEs are set to grow at 39.06% CAGR.
- By end-user industry, retail & e-commerce controlled 36.88% share in 2025; healthcare is the fastest-growing vertical at 40.1% CAGR.
Note: Market size and forecast figures in this report are generated using Mordor Intelligence’s proprietary estimation framework, updated with the latest available data and insights as of 2026.
United States Real Time Payments Market Trends and Insights
Drivers Impact Analysis*
| Driver | (~) % Impact on CAGR Forecast | Geographic Relevance | Impact Timeline |
|---|---|---|---|
| Expansion of TCH RTP Network Across Mid-Tier & Community Banks | +8.2% | National, concentrated in Midwest and Southeast community banking corridors | Medium term (2-4 years) |
| Launch of FedNow Service Enabling 24×7×365 Interbank Settlement | +12.5% | National, with early adoption in Northeast and West Coast metropolitan areas | Short term (≤ 2 years) |
| Instant Payroll & Earnings Disbursement Demand from Gig-Economy Platforms | +6.8% | National, with concentration in urban centers and tech hubs | Short term (≤ 2 years) |
| Adoption of Request-for-Payment by U.S. Billers & Utilities | +4.3% | National, with early implementation in Texas, California, and Florida utility markets | Medium term (2-4 years) |
| ISO 20022 & Open-API Integration Driving FinTech Partnerships | +5.7% | National, with technology corridor concentration | Long term (≥ 4 years) |
| Merchant Push-to-Card / Instant Funding Programs Scaling in E-commerce | +3.2% | National, with e-commerce hub concentration | Medium term (2-4 years) |
| Source: Mordor Intelligence | |||
Expansion of TCH RTP network across mid-tier & community banks
TCH’s funding-agent model allows community institutions with assets under USD 1 billion to join RTP at roughly 40% of prior cost, leveling the competitive field against national banks.[3]Tyler Benson, “Community Banks Tap Funding Agents for RTP,” cgi.com Bankers’ Bank and KeyBank illustrate scalability: KeyBank alone expects 4 million RTP transactions in 2025, benefiting Midwest manufacturing clients that rely on just-in-time cash flow. February 2025’s hike of the single-payment cap to USD 10 million opens B2B use cases such as real-estate closings and supplier finance. As over 70% of US banking institutions fall in the community category, this driver meaningfully enlarges addressable volume and injects new competitive dynamics to the US real time payments market.
Launch of FedNow Service enabling 24×7×365 interbank settlement
FedNow settles directly against Fed master accounts, eliminating prefunding and counterparty risk that limit private rails. Cloud-native design gives resiliency and scalability, letting smaller banks go live in weeks rather than quarters. More than 900 institutions enrolled by end-2024—nearly double RTP’s base—highlight trust in a government-operated system. Treasury’s mandate that federal agencies migrate to electronic disbursements by September 2025 guarantees a committed demand corridor, while the planned USD 1 million transaction ceiling in summer 2025 positions FedNow to cannibalize traditional wire revenue.
Instant payroll & earnings disbursement demand from gig-economy platforms
Four in five gig workers choose platforms that pay instantly, making real-time rails an employee-retention lever. With independent-worker counts due to surpass 86 million by 2027, volume potential is substantial. PYMNTS reports that 39% of ad-hoc gig payouts already use instant methods, primarily push-to-card, but platforms such as Uber and DoorDash now pilot bank-to-bank RTP to reduce card interchange. Nium’s analysis shows faster pay correlates with up to 25% higher platform loyalty, adding strategic urgency.
Adoption of Request-for-Payment by US billers & utilities
Truist’s alias-based RfP solution relies on 150 million tokenized email and phone IDs to push invoices and receive immediate settlement. Utilities in Texas and telecom majors like Verizon have embraced the model to reduce dunning cycles by up to 60%. U.S. Bank now keeps RfP requests visible until user-defined expiration, improving bill presentment transparency. The Clearing House is broadening RfP beyond utilities to government invoices, magnifying impact on the US real time payments market.
Restraints Impact Analysis*
| Restraint | (~) % Impact on CAGR Forecast | Geographic Relevance | Impact Timeline |
|---|---|---|---|
| Core Banking Legacy Integration & Batch-Processing Constraints | -7.8% | National, with higher impact in Midwest and Southeast regional banks | Long term (≥ 4 years) |
| Escalating Authorised Push-Payment (APP) Fraud & Scam Risks | -4.2% | National, with concentration in high-transaction metropolitan areas | Short term (≤ 2 years) |
| Absence of Universal Identity Directory Hindering Interoperability | -3.1% | National, affecting cross-network transaction efficiency | Medium term (2-4 years) |
| Per-Transaction Limit Caps & Liquidity Management Concerns | -2.4% | National, with higher impact on commercial banking segments | Medium term (2-4 years) |
| Source: Mordor Intelligence | |||
Core banking legacy integration & batch-processing constraints
Roughly 94% of US banks still rely on overnight batch cores conceived decades ago, making 24×7 posting a technical hurdle. The Federal Reserve Bank of Kansas City estimates full modernizations cost hundreds of millions and require 3-5 years, a burden magnified for community lenders. Third-party enablers mitigate pain, yet high integration complexity continues to slow rollouts, tempering the growth trajectory of the US real time payments market.
Escalating authorised push-payment (APP) fraud & scam risks
Instant irrevocability heightens fraud. APP losses could reach USD 6.8 billion by 2027 if controls lag transaction growth. Regulatory gaps under the Electronic Fund Transfer Act mean consumer restitution is not guaranteed, dampening trust. Banks are racing to layer machine-learning analytics and behavioral biometrics, but frictionless-versus-secure trade-offs remain a restraint on adoption velocity.
*Our forecasts treat driver/restraint impacts as directional, not additive. The impact forecasts reflect baseline growth, mix effects, and variable interactions.
Segment Analysis
By Transaction Type: P2B Growth Outpaces P2P Volume Leadership
P2P transactions dominated the US real time payments market with 71.76% share in 2025. Zelle alone processed 1.7 billion transfers worth USD 481 billion in H1 2024, affirming consumer uptake. That said, the P2B corridor is the market’s growth engine. At a 39.45% CAGR, P2B is forecast to narrow the volume gap by 2031 as corporates use instant settlement to cut days-sales-outstanding. The segment tackles the USD 707 billion in US corporate trapped cash, unlocking supply-chain liquidity. FedNow’s planned USD 1 million limit also enables high-value invoice payments, accelerating commercial use.
Fintech gateways are adding dynamic discount tools that auto-calculate supplier incentives when invoices are paid instantly, making P2B strategically valuable for treasury teams. Early data from the Swedish central bank suggests small suppliers experience improved sales and employment once buyers deploy real-time settlements. As middle-market firms display willingness to pay 3% service fees for automated payables, monetization potential reinforces momentum in this corridor.


By Component: Services Acceleration Challenges Platform Dominance
Platforms accounted for 63.28% of spending in 2025, underlining up-front infrastructure demand as banks connect to RTP and FedNow rails. However, managed services—fraud analytics, ISO 20022 translation, treasury dashboards—are projected to outpace with a 33.9% CAGR. Banks cite lower total cost of ownership and faster time-to-market when outsourcing ongoing operations to enablers such as Fiserv and Finastra.
Regulatory change drives the tilt toward services. ISO 20022 migration deadlines push institutions to secure translation gateways, and 63% of corporates expect their banks to handle message conversion. As the US real time payments market matures, differentiation shifts from mere connectivity to value-added orchestration, positioning service vendors for share gains.
By Deployment Mode: Cloud Infrastructure Drives Scalability
Cloud deployments captured 58.23% share in 2025 and are on track for 36.8% CAGR to 2031, reflecting preference for elastic capacity and opex models. FedNow’s own cloud-native build validated security and resiliency, easing board-level concerns. Community institutions can spin up receivership capability in under 90 days, a timeline unthinkable for on-premise builds.
Conversely, Tier-1 banks still maintain hybrid stacks to comply with internal governance, yet many funnel new workloads to private clouds to support 24×7 uptime. BNY Mellon found that 92% of US corporates will expand payments budgets in the next three years, with cloud hosting the favored path for rapid feature releases. As cybersecurity toolsets gain parity on hyperscale providers, residual resistance continues to fade, cementing cloud as the default deployment route for the US real time payments market.
By Enterprise Size: SME Adoption Momentum Challenges Large-Enterprise Leadership
Large enterprises held 61.52% revenue share in 2025 thanks to IT budgets and transaction volumes. Yet survey data shows 92% of mid-sized firms already use RTP and 77% have adopted FedNow, illustrating grassroots momentum. SMEs are drawn by liquidity benefits; PYMNTS calculates firms allowing >30-day terms lose 4.6% of revenue, equivalent to USD 19 million in the mid-market band.
Simplified onboarding helps. Payment-as-a-service vendors pre-integrate with accounting packages, cutting rollout to weeks. Willingness to pay premium fees for automated payables underscores revenue upside for providers. As a result, SMEs are forecast to eclipse large-enterprise growth at 39.06% CAGR, reshaping the adoption map of the US real time payments market.
By End-User Industry: Healthcare Innovation Outpaces Retail Volume
Retail & e-commerce accounted for 36.88% of 2025 volume, leveraging real-time settlement to reduce chargebacks and accelerate merchant funding. Healthcare, though smaller today, is projected to grow 40.1% CAGR as insurers and providers integrate instant claims payout to curb administrative drag. CAQH estimates USD 803 million in annual savings once medical EFT becomes ubiquitous.
Government mandates also propel public-sector uptake. Executive Order 14247 compels federal agencies to achieve electronic disbursement ubiquity, channeling volumes to FedNow. Utilities exploit Request-for-Payment to shorten collection cycles, while title insurers deploy RTP to slash escrow fraud risk. The diversity of vertical use cases underlines the broad addressable footprint of the US real time payments market.
Geography Analysis
FedNow enrolment skews toward technology corridors in the Northeast and West Coast, where digital readiness and gig-economy density sharpen the need for instant rails. California platforms such as Airbnb and DoorDash are early adopters, influencing local banks to integrate quickly. In contrast, the Midwest and Southeast drive RTP growth through community-bank participation, enabled by funding-agent hubs like Bankers’ Bank.
Utility billers in Texas, California, and Florida pioneered Request-for-Payment pilots, leveraging large residential bases and supportive state regulators. Border states anticipate cross-border corridors: Fiserv now pilots US-to-Pix payments, positioning Texas merchants to accept Brazilian instant transfers at the point of sale.
Rural adoption trails due to broadband constraints, yet Treasury’s push for ubiquitous federal payment modernization creates a baseline demand signal nationwide. As ISO 20022 enables interoperability, states with export-oriented economies—such as Arizona’s manufacturing cluster—expect incremental lift once cross-border instant connectivity becomes mainstream.
Regulatory Landscape
The United States real time payments market operates under a mix of Federal Reserve operating rules for FedNow participation and broader consumer and funds-transfer frameworks such as Regulation E (Electronic Fund Transfer Act) and Regulation J. The White House directive to modernize federal payments and phase out paper checks by September 30, 2025 reinforced agency migration to electronic disbursements, increasing the policy pull for always-on payment rails.
Supervision is also tightening for major digital payment and wallet providers that sit on top of instant rails. The Consumer Financial Protection Bureau began supervising large nonbank digital payment and wallet providers effective January 9, 2025 (thresholded at over 50 million U.S. dollar transactions annually). On the infrastructure side, the Federal Reserve Banks amended Operating Circular 8 effective April 1, 2026, adding terms for a new Network Intelligence supporting service for FedNow participants. In April 2026, the Federal Reserve Board published a Federal Register proposal to amend Regulation J to allow FedNow participants to use non-Reserve Bank intermediaries for the international portion of cross-border transactions. In parallel, the PACE Act (H.R. 8395) was introduced in April 2026 as proposed legislation addressing registered covered provider status for non-bank access to Federal Reserve payment rails.
Value Chain Analysis
The value chain begins with two primary instant-payment infrastructures, the Federal Reserve's FedNow Service and The Clearing House RTP network. These provide clearing and settlement rules, participant onboarding, and rail-level messaging (ISO 20022) for data-rich payments. Participation has scaled across banks and credit unions, and by July 2026 FedNow reported over 1,800 participating financial institutions, while RTP reported over 1,200, expanding reachability for consumer and business use cases.
Upstream and midstream layers include bank core processors and connectivity providers that integrate legacy cores to 24x7 posting, orchestration platforms that manage multi-rail routing across FedNow and RTP, and security and fraud-analytics specialists that screen transactions in real time. Downstream, enterprises and billers consume these capabilities via ERP, treasury, and payables/receivables applications, with use cases extending into supply chain finance and high-value disbursements as both networks moved to higher limits (USD 10 million caps in 2025). Operational bottlenecks concentrate in legacy core modernization and continuous liquidity management, which supports demand for managed services, ISO 20022 translation, reconciliation tooling, and rail-specific operational support.
Competitive Landscape
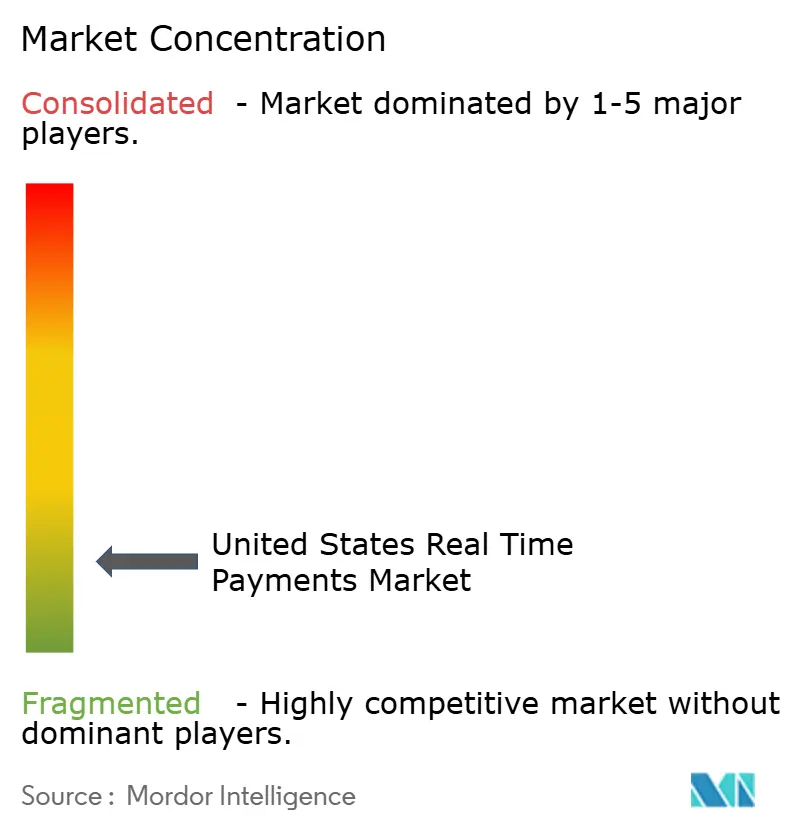
The US real time payments market features a two-rail backbone—FedNow and TCH RTP—supported by a layered ecosystem of core-bank processors, fintech enablers, and fraud-analytics specialists. No single vendor exceeds 10% of enablement revenue, indicating moderate fragmentation.
Strategic alliances dominate. Walmart’s pact with Fiserv brings pay-by-bank checkout nationwide, letting the retailer bypass card interchange and potentially save tens of millions annually. Visa Direct counter-moves by guaranteeing sub-one-minute funds availability to 99% of US accounts, preserving card-network relevance.
Consolidation is accelerating: FIS bought Global Payments’ Issuer Solutions unit for USD 12 billion in April 2025 to expand issuer processing scale and capture more embedded-payments value. Patent filings indicate Big Tech is exploring conversational-payment interfaces and decentralized settlement models, signaling long-term competitive threats to incumbents. Still, community-bank service providers like Volante thrive by offering turnkey rails access, underscoring white-space in specialized integration niches.
United States Real Time Payments Industry Leaders
ACI Worldwide Inc.
Fidelity National Information Services Inc. (FIS)
Fiserv Inc.
Mastercard Incorporated
PayPal Holdings Inc.
- *Disclaimer: Major Players sorted in no particular order

Market Opportunities and Future Outlook
Commercial and treasury workflows present a monetization corridor as the U.S. instant-payment ecosystem shifts from consumer transfers into higher-value business payments under expanded rail limits (USD 10 million on both RTP and FedNow following 2025 increases). Market activity shows production-scale utilization: in Q2 2026 the RTP network processed 142 million transactions totaling USD 576 billion, and The Clearing House reported a single-day record on May 1, 2026, of 2.27 million transactions worth USD 8.62 billion. That level of throughput creates whitespace for banks and enablers to productize ISO 20022-based invoicing and reconciliation, request-for-payment style bill presentment, and working-capital offerings that attach fees to data enrichment, straight-through posting, and supplier settlement automation rather than connectivity alone.
A second opportunity area is multi-rail reach and liquidity tooling as institutions connect to both networks for redundancy and broader counterparty coverage. The Clearing House approved revisions to RTP Operating Rules in April 2026, effective September 30, 2026, to incorporate Liquidity Management Transfer (LMT) Service enhancements, and related operational capabilities to support around-the-clock prefunding, intraday positioning, and exception handling. Policy and rulemaking activity around access models also introduces new platform demand: the Federal Reserve's April 2026 proposed Regulation J change for cross-border transaction intermediaries and the introduction of the PACE Act (H.R. 8395) in April 2026 highlight active workstreams on non-bank participation and cross-border routing. Together, they point to near-term needs for compliance controls, risk governance, and identity and directory-like interoperability services across rail participants.
Recent Industry Developments
- May 2026: NMI completed its acquisition of Dwolla, adding account-to-account infrastructure and real-time payment capabilities to NMI's embedded payments platform. The deal broadens NMI's reach beyond card-centric acceptance and improves its ability to support pay-by-bank and instant payout workflows for merchants and software platforms.
- April 2026: ACI Worldwide announced ACI Connetic platform integration across eight U.S. networks, including FedNow, The Clearing House RTP, and Zelle alongside high-value rails such as Fedwire and CHIPS. This gives ACI a path to sell a unified orchestration layer as banks and enterprises manage multi-rail routing, settlement choices, and data-rich messaging across instant and legacy networks.
- June 2025: Verizon partnered with Trustly to roll out pay-by-bank at retail locations, targeting reduced card acceptance costs and deeper customer engagement. The partnership supports broader merchant adoption of account-to-account payments and increases competitive pressure on card rails as retailers add bank-to-bank checkout options.


Research Methodology Framework and Report Scope
Market Definition and Coverage
For this methodology, the market includes the United States value of real-time payment solutions and related services that enable initiation, clearing, and near-instant settlement on a 24x7x365 basis for business and consumer use cases.
Scope exclusions: We exclude non-instant rails (such as ACH and card batch settlement), cash, checks, and cross-border-only instant payment corridors.
Segmentation Overview
- By Transaction Type
- Peer-to-Peer (P2P)
- Peer-to-Business (P2B)
- By Component
- Platform / Solution
- Services
- By Deployment Mode
- Cloud
- On-Premise
- By Enterprise Size
- Large Enterprises
- Small and Medium Enterprises
- By End-User Industry
- Retail and E-Commerce
- BFSI
- Utilities and Telecom
- Healthcare
- Government and Public Sector
- Other End-user Industries
Data Sources, Market Sizing, and Validation
Desk Research
Desk work starts with public payment-rail and policy signals to set the boundaries of what counts as a real-time payment in the United States. We typically rely on sources such as Federal Reserve publications and service updates, payment-rail operator statistics, U.S. Treasury and other government releases for disbursement modernization, and broad financial system data from agencies such as the FDIC.
To convert those signals into modeling inputs, we also review sources such as SEC filings and investor materials from ecosystem participants, industry association resources, and reputable financial press for product rollouts and fee disclosures. When needed, we reference paid subscriptions limited to company financials and intelligence, news and financials screening, patent databases, and global contracts and tenders. These desk research sources are illustrative and not exhaustive, and we also use other public and proprietary references for data collection, validation, and research clarification.
Primary Interviews and Surveys
Primary work is used to pressure-test adoption timing and pricing logic, because real-time payment monetization can vary by use case and by who pays the fee (sender, receiver, or enterprise). We spoke with a mix of banks, payment operations leaders, technology providers, and enterprise treasury teams across the United States so the model reflects both supply-side readiness and buyer-side willingness to shift volumes.
Distribution of primary research fieldwork respondents
| Company type | Respondent position | Region |
|---|---|---|
| Top tier: 33% | CXOs: 13% | |
| Mid tier: 53% | Functional/Unit leaders: 28% | |
| Smaller Players: 14% | Managers: 59% |
Market-Sizing & Forecasting
Sizing is built using top-down and bottom-up checks, with the main structure starting from the United States real-time payments demand pool and then translating it into market value through monetization assumptions. In practice, we reconstruct value from adoption and usage growth across instant-payment rails, and then apply blended price-per-transaction and service attachment logic that matches how platforms and service providers charge in this space.
Key inputs include transaction volume growth for real-time rails, average transaction values (to sanity-check use case mix), participating institution counts, enterprise penetration for high-frequency use cases (such as bill pay and disbursements), and mix shifts between P2P and P2B activity. Those indicators are then corroborated with selective bottom-up approximations, such as sampled revenue disclosures, channel checks on implementation and messaging fees, and service-to-platform ratios. Where data is incomplete, we use conservative range assumptions and later narrow them through interviews.
For forecasting, we use scenario analysis supported by a light multivariate regression overlay. Adoption drivers (bank participation, enterprise enablement timelines, and policy-led disbursement momentum) are stress-tested under base, faster, and slower migration cases. Assumptions are kept traceable so a change in one driver, like fee compression or faster onboarding, can be seen clearly in the output.
Data Validation & Update Cycle
Outputs are checked against independent market signals before sign-off, including rail-level activity trends and the implied revenue yield per transaction, which helps catch overstated monetization. Variance checks are run by year and by major use case, and anomalies trigger a review of the pricing blend, adoption curve shape, and any one-time ramps.
Each report goes through multi-step analyst review, followed by targeted re-contacts when inputs shift or new public numbers create a mismatch with earlier assumptions. The full refresh is annual, and interim updates are made when material events occur, such as rule changes, major network expansions, or visible pricing moves. Right before delivery, a final pass is completed so clients receive the most current view.
Mordor Intelligence's United States Real Time Payments Market Estimate Compared With Other Published Estimates
Different published market sizes can look far apart because some sources refresh activity and pricing assumptions at different points in the year, and they convert growing transaction volumes into dollars using different fee proxies. When growth is steep, even a small lag in volume updates or a different currency timing convention can shift the reported total.
Key gaps usually come from what is counted as market value (platform and service revenue versus gross payment value), which rails are treated as in-scope, and whether pricing is held flat or allowed to compress as scale rises. By checkpointing rail activity and aligning ASP progressions to current fee schedules before converting to USD, Mordor Intelligence keeps the estimate tied to monetizable processing and enablement revenue rather than payment flows.
Benchmark comparison
| Source | Market Size | Gaps in Research Methodology |
|---|---|---|
| Mordor Intelligence | USD 0.33 B (2025) | |
| Trade Journal A | USD 0.28 B (2025) | Uses a narrower definition that emphasizes rail transaction processing only, and it applies a flatter fee-per-transaction assumption that limits services and implementation revenue uplift. |
| Industry Association B | USD 0.40 B (2025) | Leans closer to gross monetization potential by applying higher blended pricing and faster enterprise adoption, with less adjustment for fee compression as volumes scale. |
The spread in the table is mainly explained by refresh timing and how transaction growth is translated into revenue, not by disagreement on adoption direction. When scope is anchored to monetizable enablement and processing revenue and then checked against implied yield signals, the final market size stays transparent and repeatable for planning decisions.


Key Questions Answered in the Report
What is the current value of the US real time payments market?
The market is valued at USD 0.46 billion in 2026 and is forecast to reach USD 2.29 billion by 2031.
How fast is the market growing?
The US real time payments market is expanding at a 38.12% CAGR between 2026 and 2031.
Which transaction type is growing the quickest?
P2B (person-to-business) payments are the fastest, projected at a 39.45% CAGR through 2031.
Why are SMEs adopting real-time payments rapidly?
SMEs seek working-capital relief and show willingness to pay for automated solutions that shorten cash-conversion cycles.
What role does FedNow play in market expansion?
FedNow offers a government-run rail that removes prefunding barriers, driving rapid onboarding of over 900 institutions and channeling federal disbursements to real-time rails.
How significant is fraud in instant payments?
Authorised push-payment fraud could cost USD 6.8 billion by 2027, pushing banks to invest heavily in advanced detection and customer-protection measures.
Page last updated on:






