Market Overview
| Study Period | 2017 - 2030 |
|---|---|
| Base Year For Estimation | 2024 |
| Forecast Data Period | 2025 - 2030 |
| Market Size (2025) | USD 6.8 Billion |
| Market Size (2030) | USD 8.36 Billion |
| Growth Rate (2025 - 2030) | 4.21% CAGR |
| Market Concentration | Low |
Major Players*Disclaimer: Major Players sorted in no particular order Image © Mordor Intelligence. Reuse requires attribution under CC BY 4.0. |
|

United States Protein Market Analysis by Mordor Intelligence
The United States Protein Market size is estimated at 6.8 billion USD in 2025, and is expected to reach 8.36 billion USD by 2030, growing at a CAGR of 4.21% during the forecast period (2025-2030).
The United States protein market continues to evolve with changing consumer preferences and industry innovations. Despite the rising popularity of plant protein alternatives, traditional protein sources maintain strong consumer demand, with approximately 80% of US adult consumers in 2022 preferring conventional protein sources like pork, beef, poultry, and fish. Major industry players are making substantial investments to meet this sustained demand, as evidenced by Archer Daniels Midland's USD 300 million investment in 2022 to expand alternative protein production at its Decatur facility, while Bunge announced a USD 550 million investment in a new soy protein concentrate facility, highlighting the industry's commitment to both traditional and plant protein sources.
The market is witnessing significant technological advancements and strategic consolidations to enhance production capabilities and meet evolving consumer demands. In early 2024, Arla Foods Ingredients secured FDA approval for whey protein hydrolysates supporting allergy management and gut comfort in infant formula, representing a breakthrough in specialized nutrition. This development was followed by Arla Foods' strategic acquisition of Volac's Whey Nutrition business, demonstrating the industry's focus on expanding specialized protein offerings. Additionally, companies like Ingredion are launching innovative products, such as their 2024 introduction of VITESSENCE Pea protein, specifically designed for cold-pressed bars.
The personal care and cosmetics sector is emerging as a significant growth driver for protein ingredients, with manufacturers responding to increasing consumer demand for natural and sustainable solutions. Seven US states implemented bans on animal-tested cosmetics in 2022, accelerating the industry's shift toward plant-based and sustainable protein sources in beauty products. Companies like Estee Lauder and Guerlain are intensifying their research and development efforts to develop effective and sustainable protein-based ingredients, particularly focusing on naturally occurring proteins like collagen, elastin, and keratin for their proven efficacy in strengthening skin and hair texture.
The snack food segment is experiencing notable transformation with protein-enriched offerings becoming increasingly mainstream. In 2022, approximately 52% of the US population reported snacking at least once daily, driving manufacturers to innovate with protein-fortified options. The industry's response includes the development of new protein-enhanced products that align with consumer preferences for healthier snacking options, while maintaining taste and convenience. This trend is further supported by the confectionery sector's shift toward healthier formulations, with 85% of chocolates and candies sold in 2022 containing 200 calories or less, indicating a broader movement toward health-conscious protein-enriched snack options.
United States Protein Market Trends and Insights
The consumption growth of animal protein fuels opportunities for key players in the ingredients segment
- Despite the rising vegan population, the demand for animal protein has been steady in the United States. The majority of protein in the American diet comes from beef and poultry, followed by dairy. In 2022, 80% of US adult consumers preferred pork, beef, poultry, and fish as their main sources of protein. Due to its water-binding properties, the market is majorly driven by the growing usage of gelatin in the functional food industry. Consumers continue to demand traditional protein options, but they are signaling an expectation of the animal protein industry to do more to address environmental concerns.
- With a wide range of applications and consumer preferences toward a healthy lifestyle, many US ingredient manufacturers are trying to enter the collagen market, which is the major reason for the increase in per capita consumption patterns. From 2019 to 2021, the unadjusted prevalence of doctor-diagnosed arthritis in the United States was 24.2% among women and 17.9% among men. Due to the high incidence of arthritis in the area, there is a growing need for collagen-based supplements to support bone and joint health.
- Over the years, considerable research has proven that animal protein has a higher biological value than plant protein. In the Protein Digestibility-corrected Amino Acid Score proposed by the Food and Agricultural Organization, milk and whey protein scored 1, indicating that the protein would provide 100% (or more) of all the amino acids required in the diet. On the contrary, plant sources lack one or more amino acids, with delayed digestibility. This factor is driving athletes and fitness enthusiasts to consume animal-based protein.

Understand The Key Trends Shaping This Market
Download PDF
Meat and milk production contributes majorly as raw material for animal protein ingredients
- The graph given depicts the production data for raw materials such as meat of cattle, pigs, and chicken (with bone, fresh or chilled), raw milk from cattle and goats, skim milk from cows, and dry whey powder. In 2023, 24,087 pounds of milk was produced per cow, an increase of 1.30% from 23,777 pounds in 2020. As of 2022, the average number of milk cows in the United States was 9,402. Milk is usually separated through various processes into components and processed into fluid beverage milk or the manufacture of other dairy products.
- The United States is the world’s largest producer of chicken meat and accounted for a 20% share of global chicken meat production in 2023. The meat production and processing sector is estimated to benefit from government initiatives such as ‘Biden-Harris Administration’s Action Plan,” which has been introduced to support the development of a fairer, more competitive, and more resilient meat and poultry supply chain in the country. The US Department of Agriculture made USD 32 million in grants to 167 existing meat and poultry processing facilities to help them reach more customers.
- Cattle meat is one of the most common sources of collagen, providing a significant amount of this unique protein. On average, beef has approximately 2-3% collagen in its composition. With the largest fed-cattle industry in the world, the United States is also the world’s largest producer of cattle meat, primarily high-quality, grain-fed cattle meat for domestic and export use. Beef cattle are raised in all 50 states of the United States, with Texas, Oklahoma, Missouri, Nebraska, South Dakota, Kansas, and Montana as the leading cattle meat-producing states in the country as of July 2023.

Understand The Key Trends Shaping This Market
Download PDF
OTHER KEY INDUSTRY TRENDS COVERED IN THE REPORT
- Baby food is expected to witness steady growth post-pandemic
- Innovation is expected to help maintain a steady growth rate
- Consumer preferences are shifting to premium condiments and sauces, away from packaged soups
- Dairy alternatives are expected to witness a significant growth rate
- There are great opportunities for meat alternative products
- Key players focused more on healthy ingredients post-COVID-19
- Rising US feed exports and feed prices are expected to impact production
- Growth in plant protein consumption provides opportunities for key players in the ingredients market
- The growth of the bakery industry is led by large commercial players
- Sustainable and innovative packaging trends are expected to influence the breakfast cereal market
- Key players are expected to focus on fortification and nutritional enrichment
- The emphasis on awareness and innovation is the driving force behind the growth of the elderly nutrition market
- E-commerce is expected to emerge as one of the most preferred channels
- Sport/performance nutrition is expected to witness significant growth during the forecast period
- The US cosmetics industry is expected to be driven by the synergy of innovation and social media influence
- Soy, wheat, and pea production contributes majorly as raw material for plant protein ingredients manufacturers
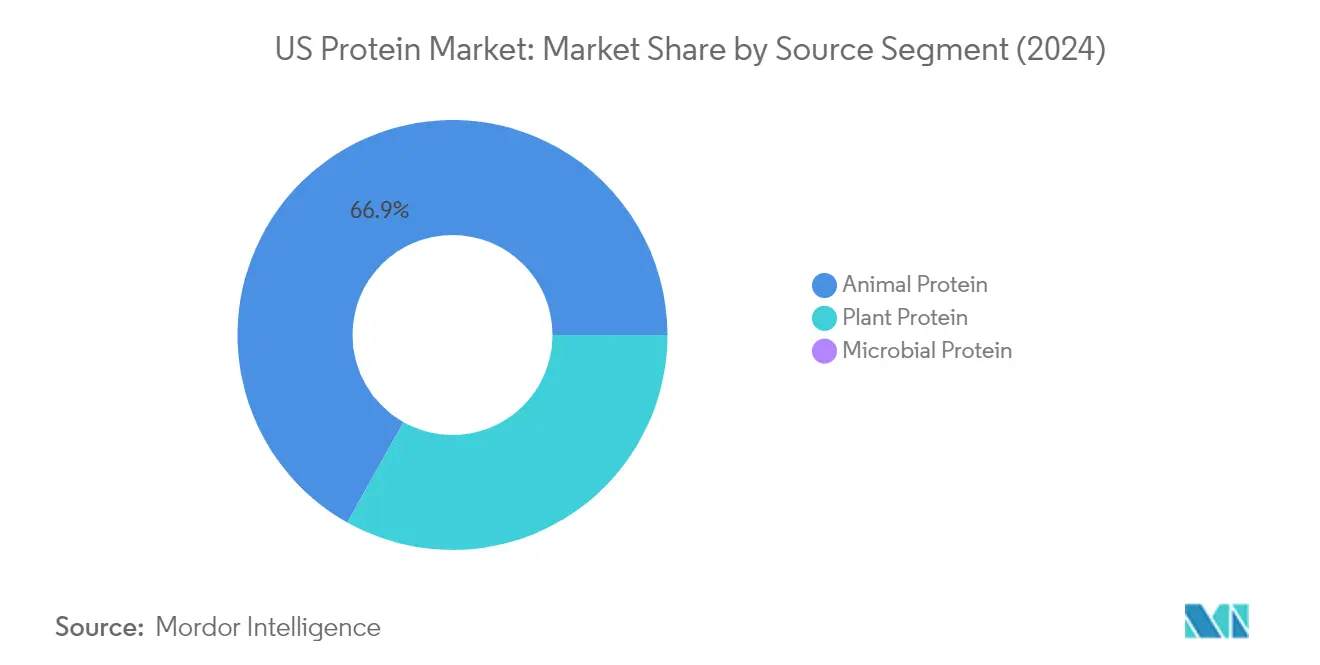
Segment Analysis: Source
Animal Protein Segment in US Protein Market
Animal protein dominates the United States protein market, holding approximately 67% market share in 2024. This significant market position is primarily driven by its complete amino acid profile, making it highly preferable for sports protein nutrition and various industrial applications. The segment's strong performance is supported by increased usage across several industries, including animal feed production and supplements. Animal proteins, particularly those found in dairy and eggs, are increasingly being employed in the food and beverage industry, which continues to drive market growth. The industry's expansion is further fueled by the rising demand for proteins as functional and dietary components, with consumers showing strong preference for traditional protein options despite growing plant-based alternatives.
Microbial Protein Segment in US Protein Market
The microbial protein segment is projected to experience the most rapid growth in the US protein market during 2024-2029, with an expected CAGR of approximately 7% by value. This impressive growth trajectory is attributed to its high nutritional value in terms of protein content, amino acid quality, and nutritional acceptability. The segment's expansion is being driven by gradually expanding research on these protein components, which is propelling the scope for innovations and building customer confidence. The growth is particularly notable in the food and beverage sector, where microbial proteins are gaining traction due to their sustainable production methods and efficient resource utilization. The segment's advancement is further supported by increasing market penetration and greater acceptance of sustainable protein alternatives among US consumers.
Remaining Segments in Source Segmentation
The plant protein segment represents a significant portion of the US protein market, driven by consumers' growing willingness to reduce animal-based product consumption. This segment has gained substantial traction due to its sustainability credentials and appeal to health-conscious consumers. Plant proteins, particularly from sources like soy and wheat, have established a strong presence in various applications, including meat alternatives, sports protein nutrition, and functional foods. The segment's growth is supported by continuous innovation in extraction technologies and processing methods, leading to improved functionality and taste profiles. The increasing number of flexitarian consumers and the expanding variety of plant-based protein sources continue to shape the segment's development in the market.
Segment Analysis: End User
Food and Beverages Segment in US Protein Market
The Food and Beverages (F&B) segment dominates the United States protein market, commanding approximately 52% market share in 2024. This substantial market position is primarily driven by the dairy and meat-alternative sub-segments, which together account for about 35% of the overall proteins consumed in the country. The segment's leadership is largely influenced by the rising number of vegan and flexitarian consumers who are increasingly embracing animal-free product offerings. The F&B segment's dominance is further strengthened by continuous innovations in plant-based alternatives, protein-fortified beverages, and functional protein foods. Major food manufacturers are actively expanding their protein-enriched product portfolios to cater to the growing consumer demand for healthier and more sustainable food options.
Personal Care and Cosmetics Segment in US Protein Market
The Personal Care and Cosmetics segment is emerging as the most dynamic sector in the US protein market, projected to grow at approximately 7% CAGR from 2024 to 2029. This remarkable growth is driven by the increasing incorporation of protein ingredients in various personal care products, including emulsions, gels, shampoos, conditioners, and creams. The segment's expansion is particularly fueled by the rising popularity of proteins naturally found in the body, such as collagen, elastin, and keratin, which are gaining traction due to their higher efficacy in naturally strengthening skin and hair texture. Companies like Estée Lauder and Guerlain are making significant investments in research and development to develop more effective and sustainable alternative protein sources, further boosting the ingredient scope and application in personal care products.
Remaining Segments in End User Segmentation
The Animal Feed and Supplements segments continue to play vital roles in the US protein market landscape. The Animal Feed segment maintains its position as the second-largest end-user category, driven by the increasing demand for high-quality protein ingredients in livestock and pet nutrition. The segment's stability is supported by the growing inclusion of sustainable alternative protein sources, such as insect protein. Meanwhile, the Supplements segment serves a crucial role in meeting the specialized nutritional needs of various consumer groups, particularly in sports protein nutrition and elderly care applications. Both segments are characterized by ongoing innovations in protein formulations and increasing focus on sustainable sourcing practices.
Competitive Landscape
Top Companies in United States Protein Market
The US protein market is characterized by companies actively pursuing innovation-led growth strategies to maintain their competitive positions. Major protein companies are consistently expanding their product portfolios through new launches focused on plant-based alternatives, specialty proteins, and clean-label offerings to meet evolving consumer preferences. Operational agility is demonstrated through strategic manufacturing facility expansions and modernization initiatives, particularly in regions with strong raw material access. Companies are increasingly forming strategic partnerships and joint ventures to strengthen their supply chain capabilities and expand distribution networks. Research and development investments are primarily directed towards developing novel protein sources and improving extraction technologies, while sustainability initiatives and certification programs are being implemented to enhance market credibility and meet environmental commitments.
Fragmented Market with Strong Regional Players
The US protein industry exhibits a fragmented competitive structure with a mix of global conglomerates and specialized regional manufacturers. Large multinational companies leverage their extensive research capabilities and established distribution networks to maintain market leadership, while regional players capitalize on their local sourcing relationships and specialized product offerings. The market is witnessing increased consolidation through strategic acquisitions, particularly in the plant-based and specialty proteins market segments, as companies seek to expand their technological capabilities and market reach. Companies with integrated operations from raw material sourcing to final product manufacturing demonstrate stronger market positions.
The competitive landscape is further shaped by the presence of agricultural cooperatives and ingredient specialists who maintain significant market shares in specific protein categories. Merger and acquisition activities are primarily driven by the need to acquire innovative technologies, expand production capabilities, and gain access to new market segments. Companies are increasingly focusing on vertical integration strategies to ensure supply chain control and maintain product quality standards. The market also sees active participation from ingredient technology companies that provide specialized protein ingredients solutions to food and beverage manufacturers.
Innovation and Sustainability Drive Future Success
Success in the US protein market increasingly depends on companies' ability to innovate while maintaining sustainable operations. Market leaders are strengthening their positions through investments in advanced processing technologies and the development of novel protein sources. Companies are focusing on building direct relationships with raw material suppliers and implementing traceability systems to ensure product quality and meet consumer demands for transparency. The ability to scale production while maintaining cost competitiveness remains crucial, particularly as new entrants introduce alternative protein sources.
Future market success will be determined by companies' ability to adapt to changing regulatory requirements and consumer preferences. Players are investing in research and development to improve protein functionality and application versatility while reducing environmental impact. Building strong relationships with food and beverage manufacturers through customized solution development and technical support is becoming increasingly important. Companies are also focusing on developing robust e-commerce capabilities and digital platforms to enhance customer engagement and streamline distribution. The market shows potential for new entrants with innovative technologies or unique protein sources, provided they can establish efficient production processes and strong distribution networks. Companies offering protein production service market solutions are well-positioned to capitalize on these trends.
United States Protein Industry Leaders
-
Archer Daniels Midland Company
-
Darling Ingredients Inc.
-
Glanbia PLC
-
International Flavors & Fragrances, Inc.
-
Kerry Group PLC
- *Disclaimer: Major Players sorted in no particular order

Need More Details on Market Players and Competitors?
Download PDF
Recent Industry Developments
- August 2024: Global dairy co-operative Fonterra and natural ingredient manufacturer Superbrewed Food have teamed up to boost sustainable food production. The partnership combines Superbrewed’s biomass protein platform with Fonterra’s dairy processing, ingredients, and application expertise to develop additional nutrient-rich, functional biomass protein.
- July 2024: Ingredion Incorporated expanded its range of North American-grown and produced protein fortification solutions by launching VITESSENCE® Pea 100 HD in the U.S. and Canada. This pea protein is specifically designed for cold-pressed bars. The new product helps maintain bar softness throughout shelf life, enhances texture and sensory attributes, and increases nutritional value to improve consumer appeal.
- July 2024: Arla Foods Ingredients has secured US Food & Drug Administration approval for the use of whey protein hydrolysates that support allergy management and gut comfort in infant formula. The FDA agreed that four ingredients in the company’s Peptigen® and Lacprodan® ranges meet the definition of peptones in the US Code of Federal Regulations and are permitted for use in early-life nutrition.
United States Protein Market Report Scope
Animal, Microbial, Plant are covered as segments by Source. Animal Feed, Food and Beverages, Personal Care and Cosmetics, Supplements are covered as segments by End User.
Source
| Animal | By Protein Type | Casein and Caseinates |
| Collagen | ||
| Egg Protein | ||
| Gelatin | ||
| Insect Protein | ||
| Milk Protein | ||
| Whey Protein | ||
| Other Animal Protein | ||
| Microbial | By Protein Type | Algae Protein |
| Mycoprotein | ||
| Plant | By Protein Type | Hemp Protein |
| Pea Protein | ||
| Potato Protein | ||
| Rice Protein | ||
| Soy Protein | ||
| Wheat Protein | ||
| Other Plant Protein |
End User
| Animal Feed | ||
| Food and Beverages | By Sub End User | Bakery |
| Beverages | ||
| Breakfast Cereals | ||
| Condiments/Sauces | ||
| Confectionery | ||
| Dairy and Dairy Alternative Products | ||
| Meat/Poultry/Seafood and Meat Alternative Products | ||
| RTE/RTC Food Products | ||
| Snacks | ||
| Personal Care and Cosmetics | ||
| Supplements | By Sub End User | Baby Food and Infant Formula |
| Elderly Nutrition and Medical Nutrition | ||
| Sport/Performance Nutrition | ||
| Source | Animal | By Protein Type | Casein and Caseinates |
| Collagen | |||
| Egg Protein | |||
| Gelatin | |||
| Insect Protein | |||
| Milk Protein | |||
| Whey Protein | |||
| Other Animal Protein | |||
| Microbial | By Protein Type | Algae Protein | |
| Mycoprotein | |||
| Plant | By Protein Type | Hemp Protein | |
| Pea Protein | |||
| Potato Protein | |||
| Rice Protein | |||
| Soy Protein | |||
| Wheat Protein | |||
| Other Plant Protein | |||
| End User | Animal Feed | ||
| Food and Beverages | By Sub End User | Bakery | |
| Beverages | |||
| Breakfast Cereals | |||
| Condiments/Sauces | |||
| Confectionery | |||
| Dairy and Dairy Alternative Products | |||
| Meat/Poultry/Seafood and Meat Alternative Products | |||
| RTE/RTC Food Products | |||
| Snacks | |||
| Personal Care and Cosmetics | |||
| Supplements | By Sub End User | Baby Food and Infant Formula | |
| Elderly Nutrition and Medical Nutrition | |||
| Sport/Performance Nutrition | |||
Need A Different Region or Segment?
Customize Now
Market Definition
- End User - The Protein Ingredients Market operates on a B2B basis. Food, Beverages, Supplements, Animal Feed, and Personal Care & Cosmetic manufacturers are considered to be end-consumers in the market studied. The scope excludes manufacturers buying liquid/dry whey to be used for application as a binding agent or thickener or other non-protein applications.
- Penetration Rate - Penetration Rate is defined as the percentage of Protein-Fortified End User Market Volume in the Overall End User Market Volume.
- Average Protein Content - Average protein content is the average protein content present per 100 g of product manufactured by all end-user companies considered under the scope of this report.
- End User Market Volume - End-user market volume is the consolidated volume of all types and forms of end-user products in the country or region.
| Keyword | Definition |
|---|---|
| Alpha-lactalbumin (α-Lactalbumin) | It is a protein that regulates the production of lactose in the milk of almost all mammalian species. |
| Amino acid | It is an organic compound that contains both amino and carboxylic acid functional groups, which are required for the synthesis of body protein and other important nitrogen-containing compounds, such as creatine, peptide hormones, and some neurotransmitters. |
| Blanching | It is the process of briefly heating vegetables with steam or boiling water. |
| BRC | British Retail Consortium |
| Bread improver | It is a flour-based blend of several components with specific functional properties designed to modify dough characteristics and give quality attributes to bread. |
| BSF | Black Soldier Fly |
| Caseinate | It is a substance produced by adding an alkali to acid casein, a derivative of casein. |
| Celiac disease | Celiac disease is an immune reaction to eating gluten, a protein found in wheat, barley, and rye. |
| Colostrum | It is a milky fluid that’s released by mammals that have recently given birth before breast milk production begins. |
| Concentrate | It is the least processed form of protein and has a protein content ranging from 40-90% by weight. |
| Dry protein basis | It refers to the percentage of "pure protein" present in a supplement after the water in it is completely removed through heat. |
| Dry whey | It is the product resulting from drying fresh whey which has been pasteurized and to which nothing has been added as a preservative. |
| Egg protein | It is a mixture of individual proteins, including ovalbumin, ovomucoid, ovoglobulin, conalbumin, vitellin, and vitellenin. |
| Emulsifier | It is a food additive that facilitates the blending of foods that are immiscible with one another, such as oil and water. |
| Enrichment | It is the process of addition of micronutrients that are lost during the processing of the product. |
| ERS | Economic Research Service of the USDA |
| Extrusion | It is the process of forcing soft mixed ingredients through an opening in a perforated plate or die designed to produce the required shape. The extruded food is then cut to a specific size by blades. |
| Fava | Also known as Faba, it is another word for yellow split beans. |
| FDA | Food and Drug Administration |
| Flaking | It is a process in which typically a cereal grain (like corn, wheat, or rice) is broken down into grits, cooked with flavors and syrups, and then pressed into flakes between cooled rollers. |
| Foaming agent | It is a food ingredient that makes it possible to form or maintain a uniform dispersion of a gaseous phase in a liquid or solid food. |
| Foodservice | It refers to the part of the food industry which includes businesses, institutions, and companies which prepare meals outside the home. It includes restaurants, school and hospital cafeterias, catering operations, and many other formats. |
| Fortification | It is the deliberate addition of micronutrients that are not found in them naturally or which are lost during processing, to improve a food product's nutritional value. |
| FSANZ | Food Standards Australia New Zealand |
| FSIS | Food Safety and Inspection Service |
| FSSAI | Food Safety and Standards Authority of India |
| Gelling agent | It is an ingredient that functions as a stabilizer and thickener to provide thickening without stiffness through the formation of gel. |
| GHG | Greenhouse Gas |
| Gluten | It is a family of proteins found in grains, including wheat, rye, spelt, and barley. |
| Hemp | It is a botanical class of Cannabis sativa cultivars grown specifically for industrial or medicinal use. |
| Hydrolysate | It is a form of protein manufactured by exposing the protein to enzymes that can partially break the bonds between the protein's amino acids and break down large, complicated proteins into smaller pieces. Its processing makes it easier and quicker to digest. |
| Hypoallergenic | It refers to a substance that causes fewer allergic reactions. |
| Isolate | It is the purest and most processed form of protein which has undergone separation to obtain a pure protein fraction. It typically contains ≥ 90% of protein by weight. |
| Keratin | It is a protein that helps form hair, nails, and the outer layer of skin. |
| Lactalbumin | It is the albumin contained in milk and obtained from whey. |
| Lactoferrin | It is an iron‑binding glycoprotein that is present in the milk of most mammals. |
| Lupin | It is the yellow legume seeds of the genus Lupinus. |
| Millenial | Also known as Generation Y or Gen Y, it refers to the people born from 1981 to 1996. |
| Monogastric | It refers to an animal with a single-compartmented stomach. Examples of monogastric include humans, poultry, pigs, horses, rabbits, dogs, and cats. Most monogastric are generally unable to digest much cellulose food materials such as grasses. |
| MPC | Milk protein concentrate |
| MPI | Milk protein isolate |
| MSPI | Methylated soy protein isolate |
| Mycoprotein | Mycoprotein is a form of single-cell protein, also known as fungal protein, derived from fungi for human consumption. |
| Nutricosmetics | It is a category of products and ingredients that act as nutritional supplements to care for skin, nails, and hair natural beauty. |
| Osteoporosis | It is a medical condition in which the bones become brittle and fragile from loss of tissue, typically as a result of hormonal changes, or deficiency of calcium or vitamin D. |
| PDCAAS | Protein digestibility-corrected amino acid score (PDCAAS) is a method of evaluating the quality of a protein based on both the amino acid requirements of humans and their ability to digest it. |
| Per-capita consumption of animal protein | It is the average amount of animal protein (such as milk, whey, gelatin, collagen, and egg proteins) that is readily available for consumption by each person in an actual population. |
| Per-capita consumption of plant protein | It is the average amount of plant protein (such as soy, wheat, pea, oat, and hemp proteins) that is readily available for consumption by each person in an actual population. |
| Quorn | It is a microbial protein manufactured using mycoprotein as an ingredient, in which the fungus culture is dried and mixed with egg albumen or potato protein, which acts as a binder, and then is adjusted in texture and pressed into various forms. |
| Ready-to-Cook (RTC) | It refers to food products that include all of the ingredients, where some preparation or cooking is required through a process that is given on the package. |
| Ready-to-Eat (RTE) | It refers to a food product prepared or cooked in advance, with no further cooking or preparation required before being eaten. |
| RTD | Ready-to-Drink |
| RTS | Ready-to-Serve |
| Saturated fat | It is a type of fat in which the fatty acid chains have all single bonds. It is generally considered unhealthy. |
| Sausage | It is a meat product made of finely chopped and seasoned meat, which may be fresh, smoked, or pickled and which is then usually stuffed into a casing. |
| Seitan | It is a plant-based meat substitute made out of wheat gluten. |
| Softgel | It is a gelatin-based capsule with a liquid fill. |
| SPC | Soy protein concentrate |
| SPI | Soy protein isolate |
| Spirulina | It is a biomass of cyanobacteria that can be consumed by humans and animals. |
| Stabilizer | It is an ingredient added to food products to help maintain or enhance their original texture, and physical and chemical characteristics. |
| Supplementation | It is the consumption or provision of concentrated sources of nutrients or other substances that are intended to supplement nutrients in the diet and is intended to correct nutritional deficiencies. |
| Texturant | It is a specific type of food ingredient that is used to control and alter the mouthfeel and texture of food and beverage products. |
| Thickener | It is an ingredient that is used to increase the viscosity of a liquid or dough and make it thicker, without substantially changing its other properties. |
| Trans fat | Also called trans-unsaturated fatty acids or trans fatty acids, it is a type of unsaturated fat that naturally occurs in small amounts in meat. |
| TSP | Textured soy protein |
| TVP | Textured vegetable protein |
| WPC | Whey protein concentrate |
| WPI | Whey protein isolate |
Need More Details on Market Definition?
Ask a Question
Research Methodology
Mordor Intelligence follows a four-step methodology in all our reports.
- Step-1: Identify Key Variables: The quantifiable key variables (industry and extraneous) pertaining to the specific product segment and country are selected from a group of relevant variables & factors based on desk research & literature review; along with primary expert inputs. These variables are further confirmed through regression modeling (wherever required).
- Step-2: Build a Market Model: In order to build a robust forecasting methodology, the variables and factors identified in Step-1 are tested against available historical market numbers. Through an iterative process, the variables required for market forecast are set and the model is built on the basis of these variables.
- Step-3: Validate and Finalize: In this important step, all market numbers, variables and analyst calls are validated through an extensive network of primary research experts from the market studied. The respondents are selected across levels and functions to generate a holistic picture of the market studied.
- Step-4: Research Outputs: Syndicated Reports, Custom Consulting Assignments, Databases & Subscription Platforms

Get More Details On Research Methodology
Download PDF


