
Market Overview
| Study Period | 2020 - 2031 |
|---|---|
| Forecast Data Period | 2026 - 2031 |
| Historical Data Period | 2020 - 2024 |
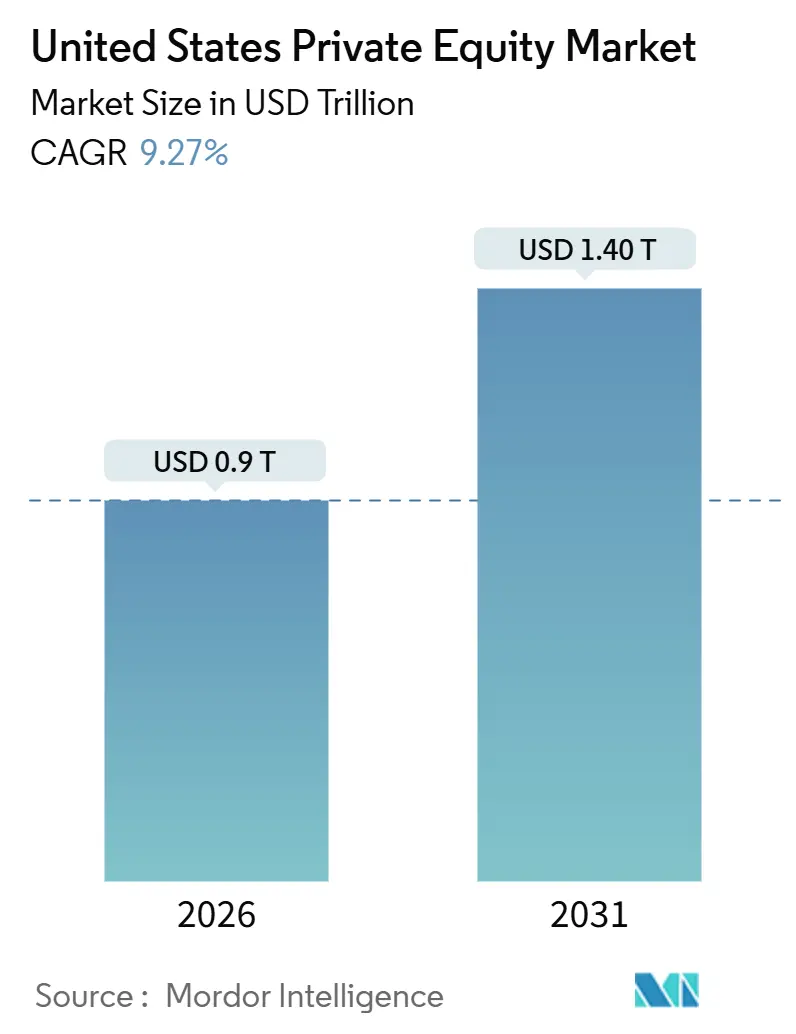
| Market Size (2026) | USD 0.9 Trillion |
| Market Size (2031) | USD 1.40 Trillion |
| Growth Rate (2026 - 2031) | 9.27 % |
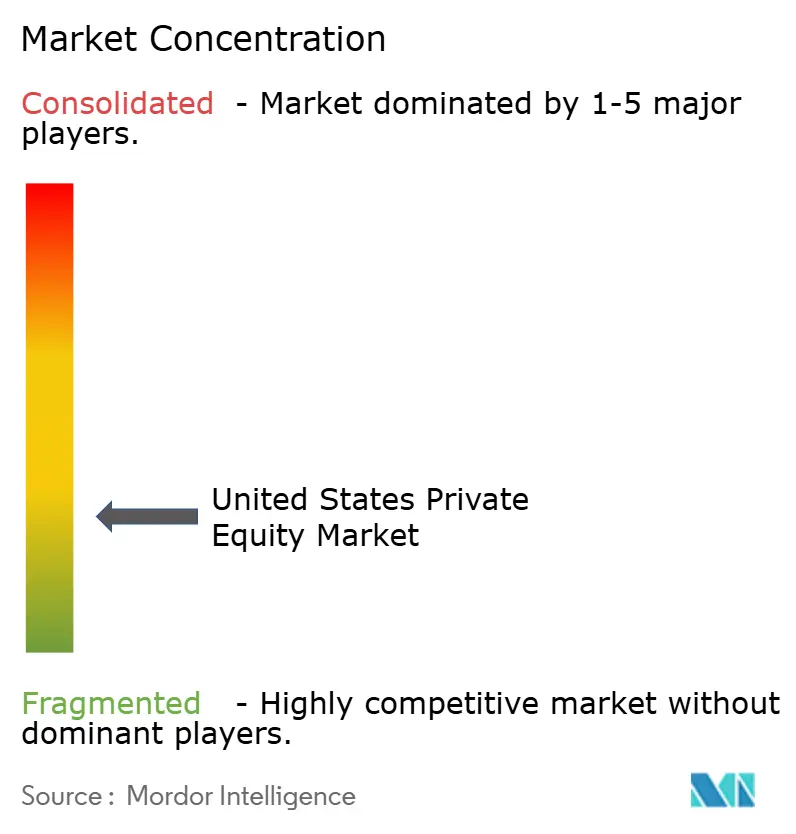
| Market Concentration | Low |
Major Players *Disclaimer: Major Players sorted in no particular order Image © Mordor Intelligence. Reuse requires attribution under CC BY 4.0. | |
United States Private Equity Market Analysis by Mordor Intelligence
The United States private equity market size is USD 900.16 billion in 2026 and is projected to reach USD 1,402.46 billion by 2031 at a 9.27% CAGR. This growth path reflects stronger deployment of dry powder, easier accredited-investor verification for Rule 506(c) offerings, and a wider pipeline of corporate carve-outs that align with operational value creation. Valuation discipline remains a core theme as sponsors compete with strategic acquirers and sovereign funds that bid aggressively for high-quality assets, which intensifies the need for operational transformation to offset thinner multiple arbitrage. The reacceleration reflects three structural shifts: first, dry-powder reserves now exceed USD 880 billion among US-based funds as of September 2025, creating deployment pressure that pushes sponsors toward mid-market platforms and add-on strategies. Liquidity management continues to evolve as continuation vehicles and secondaries provide interim distributions while preserving upside in core assets.
Key Report Takeaways
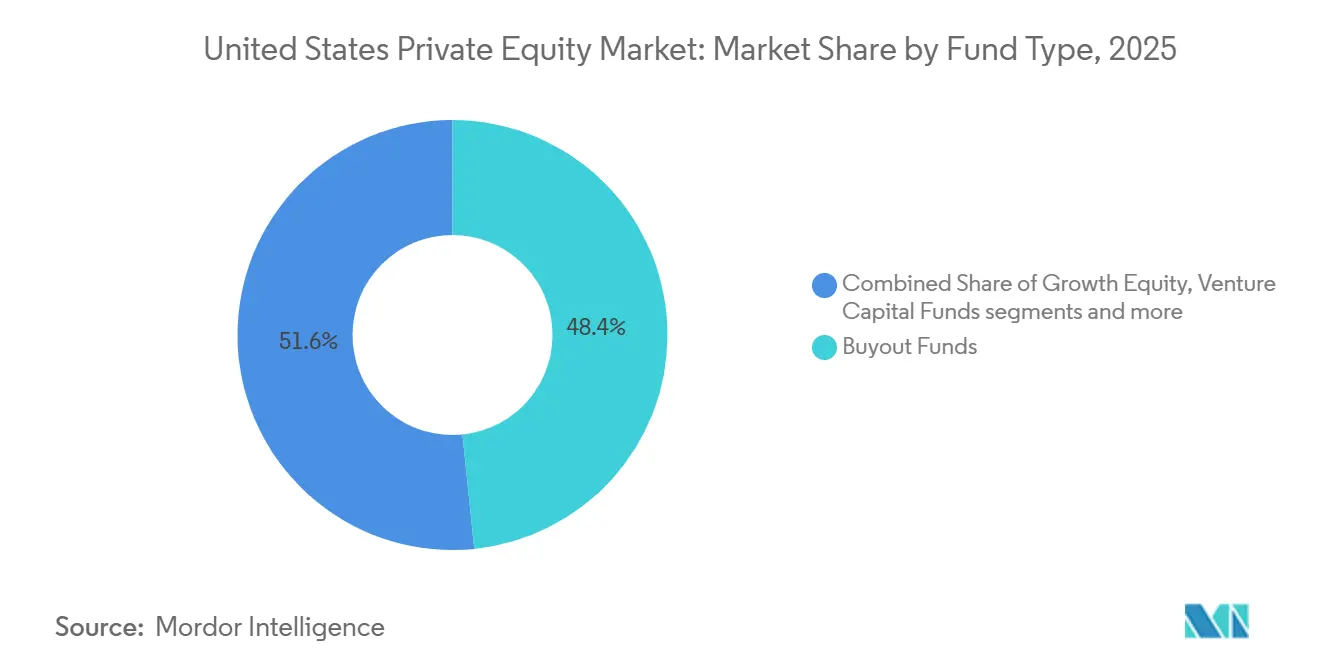
- By fund type, Buyout Funds led with 48.39% market share in 2025, while Venture Capital Funds are projected to expand at a 12.37% CAGR through 2031.
- By sector focus, Technology & Software commanded 33.24% share in 2025, while Healthcare & Life Sciences is forecasted to grow at a 14.39% CAGR to 2031.
- By deal size, Mid-Cap transactions held 42.34% share in 2025, while Small-Cap deals are projected to grow at an 8.39% CAGR through 2031.
- By investor type, Pension Funds accounted for a 36.83% share in 2025, while Family Offices & HNWIs are expected to grow at a 9.38% CAGR to 2031.
- By geography, the Northeast accounted for 41.64% of activity in 2025, while the West is projected to grow at a 12.38% CAGR through 2031.
Note: Market size and forecast figures in this report are generated using Mordor Intelligence’s proprietary estimation framework, updated with the latest available data and insights as of January 2026.
United States Private Equity Market Trends and Insights
Drivers Impact Analysis*
| Driver | ( ~ ) % Impact on CAGR Forecast | Geographic Relevance | Impact Timeline |
|---|---|---|---|
| Rising Dry-Powder Levels from U.S. Institutional Allocations | +2.1% | Global, with core concentration in the Northeast (NY) and the West (CA) financial hubs | Medium term (2-4 years) |
| Digitization-Led Deal Flow in Software & Tech-Enabled Services | +2.8% | National, with early gains in Silicon Valley, Seattle, and Austin that will spill over to mid-market tech corridors | Short term (≤ 2 years) |
| Generational Succession in U.S. Mid-Market Businesses Creating Buyout Targets | +1.6% | Midwest manufacturing belt (IL, OH, MI), South (TX, GA), Northeast SME clusters | Long term (≥ 4 years) |
| SEC Marketing-Rule Relaxation Expanding Accredited-Investor Pool | +1.3% | National, with outsized benefit for evergreen fund managers targeting retirement plans | Medium term (2-4 years) |
| Energy-Transition Mandates Driving Infrastructure & Renewables PE Funds | +0.9% | West (CA solar and wind, CO grid modernization), South (TX battery storage), APAC spillover to MEA | Long term (≥ 4 years) |
| Corporate Carve-outs Accelerating as Conglomerates Refocus on Core | +0.5% | National, with notable activity in Midwest industrials, South energy assets, Northeast pharma and tech | Short term (≤ 2 years) |
| Source: Mordor Intelligence | |||
Rising Dry-Powder Levels from U.S. Institutional Allocations
Global private equity dry powder reached USD 2.51 trillion by mid-June 2025, with United States-based funds holding roughly USD 880 billion, which sustains a strong deployment agenda across the United States private equity market. Allocators continued to raise target weights in late 2024 and 2025, and a meaningful portion of investors signaled intention to raise commitments through 2026 despite slower distributions, which prolongs the reinvestment cycle within the United States private equity market. Time pressure has grown as more mature assets sit in portfolios awaiting exit windows, so managers prioritize platform strategies and roll-ups where operating levers can shape returns independent of broad market timing within the United States private equity market. Institutions have concentrated commitments in USD 1 billion to USD 5 billion funds that can execute repeatable exits, which reinforces the middle-market’s appeal for proprietary sourcing and integration plays. This dynamic tilts activity toward founder succession, add-on programs, and disciplined bolt-ons, where execution steps can buffer elevated entry multiples and produce clearer value bridges in the United States private equity market.
Digitization-Led Deal Flow in Software & Tech-Enabled Services
Technology’s share of deployment climbed through 2024 and into 2025 as sponsors favored software models with high recurring revenue and predictable retention, which remains a core allocation driver in the United States private equity market. Software deal values rose in 2024 and early 2025, and median revenue multiples moved higher as buyers priced durable growth into platforms positioned for AI and cloud infrastructure needs across the United States private equity market. Generative AI absorbed a large share of venture capital in 2025, which reinforced sponsor appetite for carve-outs of tech-enabled divisions where stand-alone governance can accelerate product roadmaps. Thoma Bravo’s agreement to purchase Boeing’s Digital Aviation Solutions business in April 2025 highlighted the carve-out pipeline from legacy industrials into sponsor ownership inside the United States private equity market. Adoption of AI tools across the investment lifecycle has broadened, as firms automate sourcing, diligence, and portfolio monitoring workflows to expand capacity and improve decision quality in the United States private equity market [1]Thoma Bravo, “Portfolio Companies and Transactions,” Thoma Bravo, thomabravo.com.
SEC Marketing-Rule Relaxation Expanding Accredited-Investor Pool
In March 2025, the SEC staff issued a no-action letter simplifying accredited-investor verification for Rule 506(c) offerings by allowing issuers to rely on minimum investment amounts, which reduces friction for managers engaging a broader accredited base. Before this change, issuers often preferred Rule 506(b) to avoid the verification burden, which limited general solicitation and hampered outreach to new investor cohorts across the United States private equity market. Law firm commentary characterized the update as a catalyst for semi-liquid and evergreen fund structures that can serve mass-affluent pools while maintaining regulatory guardrails. Defined-contribution channels present a sizable opportunity, as product design and fiduciary frameworks evolve to allow private market sleeves within target-date strategies in the United States private equity market. Managers are responding by developing retail-aligned offerings with clearer liquidity, transparency, and fee structures that meet the expectations of the SEC and ERISA.[2]Reed Smith, “SEC Staff Simplifies Accredited Investor Verification for Rule 506 Offerings,” Reed Smith, reedsmith.com
Energy-Transition Mandates Driving Infrastructure & Renewables PE Funds
Global investment into energy-transition infrastructure accelerated through 2024 and 2025 as policy support and cost curves improved, which strengthened the infrastructure sleeve within the United States private equity market. Climate-focused fundraising grew even as broader PE fundraising softened, and sponsors targeted digital infrastructure, grid upgrades, and storage where demand visibility is rising alongside AI computing needs in the United States private equity market. The Inflation Reduction Act created tax incentives, financing support, and long-dated visibility that de-risk clean energy and related manufacturing projects, which aligns with pension and insurer demand for duration-matched returns. Institutional commitments, including large public pension allocations to transition strategies, illustrate how yield-plus-growth profiles fit liability-driven mandates in the United States private equity market. Most newly commissioned renewable projects in 2024 were already more cost-effective than the cheapest fossil alternatives, which reinforces sponsor conviction in stable operating cash flows and scalable platforms.[3]International Renewable Energy Agency, “Renewable Power Generation Costs,” IRENA, irena.org
Restraints Impact Analysis*
| Restraint | ( ~ ) % Impact on CAGR Forecast | Geographic Relevance | Impact Timeline |
|---|---|---|---|
| SEC Fee-Transparency Crackdown Raising Compliance Costs | -0.7% | National, with acute pressure on mid-sized managers lacking a dedicated compliance infrastructure | Medium term (2-4 years) |
| Sharp Rise in Interest Rates Inflating Leveraged Buyout Financing Costs | -1.2% | National, with greater sensitivity in mid-market deals reliant on syndicated debt | Short term (≤ 2 years) |
| Heightened Competition from SPACs & Strategics Compressing Entry Multiples | -0.8% | National, with bidding wars concentrated in Tech, Healthcare, and Consumer | Medium term (2-4 years) |
| Growing Political & ESG Scrutiny of PE Labor Practices | -0.3% | National, with enforcement concentrated in 19 anti-ESG states and litigation hot-spots | Long term (≥ 4 years) |
| Source: Mordor Intelligence | |||
SEC Fee-Transparency Crackdown Raising Compliance Costs
SEC enforcement and examination priorities in 2025 sustained a focus on valuation, fees and expenses, custody, and marketing disclosures, which increased fixed overhead for mid-sized managers in the United States private equity market. Actions and penalties related to fee calculation and conflicts of interest required many advisers to invest in personnel, systems, and third-party valuation support. New and amended rules covering incident response, customer notification timelines, and AML program requirements that take effect in 2026 further raise the compliance bar in the United States private equity market. These obligations weigh more heavily on emerging managers that lack scale to amortize costs across larger asset bases, which can accelerate consolidation. Managers are responding with enhanced internal controls, audit readiness, and clearer client communications to reduce regulatory risk within the United States private equity market.[4]Sidley Austin, “2025 Fiscal Year in Review: SEC Enforcement Against Investment Advisers,” Sidley, sidley.com
Heightened Competition from SPACs & Strategics Compressing Entry Multiples
Buyout entry multiples moved higher in 2024 and 2025 as more sponsors and strategic buyers chased fewer scaled platforms, which increased pricing pressure across the United States private equity market. Strategics often paid a premium for assets with product or channel fit, forcing sponsors to justify bids with faster value-creation plans and structured consideration where needed. Creative tools such as earnouts and seller notes became more common to bridge valuation gaps, which added complexity to documentation and post-close governance in the United States private equity market. Elevated entry multiples and lower exit multiples compressed the room for multiple expansion, so operating improvements and margin expansion carried more of the return load. Niche sector specialists with proprietary sourcing and operating playbooks were better positioned to sidestep crowded auctions and protect underwriting discipline within the United States private equity market.
*Our forecasts treat driver/restraint impacts as directional, not additive. The impact forecasts reflect baseline growth, mix effects, and variable interactions.
Segment Analysis
By Fund Type: Venture Capital Races Ahead Despite Buyout Dominance
Buyout Funds commanded 48.39% of the United States private equity market share in 2025, reflecting sponsor preference for mature, cash-flow-generative platforms with reliable exit paths. Venture Capital Funds are projected to grow at a 12.37% CAGR through 2031, supported by the concentration of capital in AI and machine learning that captured a large portion of 2025 deal value in early-stage and growth rounds. Growth Equity Funds represented a notable share of deal flow by count in mid-2025, although large buyout add-ons skewed value toward control transactions across the United States private equity market. Mezzanine and preferred structures gained traction for bridging valuation gaps and managing downside in separation-heavy processes. Infrastructure and energy transition strategies attracted commitments consistent with long-duration needs and stable yield targets within the United States private equity market.
The United States private equity industry continues to diversify across fund types as allocators balance return targets against liquidity and risk preferences. Distressed and turnaround strategies remain a smaller slice but can expand if macro conditions tighten and over-levered assets need restructuring. Large, sector-focused managers with repeatable operating playbooks have broadened their capital menu to include structured equity and private credit, which widens their opportunity set in the United States private equity market. The performance wedge between top-quartile sector specialists and generalists emphasizes the benefit of scale and domain expertise. Managers who demonstrate disciplined underwriting, deep sourcing, and technology-enabled diligence continue to draw support in the United States private equity market.


By Sector Focus: Healthcare & Life Sciences Accelerate on AI-Enabled Diagnostics
Technology & Software captured a 33.24% share in 2025, driven by SaaS, cloud, and data platforms that align with mission-critical workflows in the United States private equity market. Healthcare & Life Sciences is forecasted to grow at a 14.39% CAGR through 2031 as AI-enabled diagnostics, specialty care, and medtech platforms draw sponsor interest. Medtech deal activity and exits picked up in 2025 versus 2024, creating scope for take-privates and carve-outs that can benefit from digital and AI-enabled operating upgrades. Energy, power, and utilities deal flow continued to tilt toward renewables, grid, and storage, reflecting policy support and project finance visibility in the United States private equity market.
The United States private equity industry also saw momentum across financial services and fintech, where payment processing, embedded finance, and wealth platforms attracted sponsor capital. Consumer and residential services platforms grew as managers used buy-and-build strategies to consolidate HVAC, plumbing, and specialty trades that exhibit recurring demand. Industrials and manufacturing benefited from supply chain realignment and domestic capacity additions, which supported roll-up playbooks that create procurement and operations efficiencies in the United States private equity market. Sponsors are allocating more operating resources to data, pricing analytics, and sales enablement within sector platforms to accelerate organic growth. Sector specialists maintain an edge in sourcing and integration, which supports premium underwriting assumptions in the United States private equity market.
By Deal Size: Small-Cap Buy-and-Build Strategies Gain Momentum
Mid-Cap transactions held 42.34% share in 2025 and represented the core of buyout activity by count and value in late 2024 and 2025. Small-Cap deals are projected to grow at an 8.39% CAGR through 2031 as succession-driven sales and regional manufacturing consolidation continue to supply targets for roll-ups in the United States private equity market. Large-cap and mega transactions saw a rebound in the number of USD 5 billion and above deals in 2024, which favored platforms with access to scaled capital and underwriting capacity. Entry multiples for mid-market deals stayed below large-cap levels, which preserved better odds for value creation through operating improvements. Sponsors with sector focus and disciplined integration playbooks achieved stronger relative outcomes in the United States private equity market.
Managers continue to use add-ons to capture regional density, standardize systems, and upgrade pricing strategies to widen margins in the United States private equity market. Deal teams also lean on private credit partners to balance speed and certainty where syndicated markets remain selective. Mega deals experienced slower exit cycles in mid-2025, which pushed some managers to extend hold periods or explore continuation vehicles to align horizons. Selectivity and execution discipline remain the differentiators across the deal-size spectrum in the United States private equity market.

By Investor Type: Family Offices Drive Co-Investment Surge
Pension Funds remained the largest capital supplier with a 36.83% share in 2025, which matches long-duration liabilities to fund life cycles in the United States private equity market. Family Offices & HNWIs are the fastest-growing investor cohort at a 9.38% CAGR through 2031 as co-investment interest and direct exposure increase. Direct deals account for a significant share of family office allocations, and many groups co-invest alongside sponsors to lower fees while accessing scale in the United States private equity market. Endowments and foundations continue to anchor diversified programs, given access to managers and the ability to tolerate illiquidity. Insurance companies and funds of funds maintain steady roles, and corporate LPs appear more frequently as strategic co-investors in the United States private equity market.
The United States private equity industry also sees rising product innovation for individual investors as managers develop semi-liquid vehicles designed for retirement channels. Regulatory interpretation and fiduciary safeguards guide how these products are structured, including transparency and liquidity frameworks. Interest in private markets from the mass-affluent base supports the design of evergreen and interval funds that fit within retirement plan guardrails in the United States private equity market. Distribution partnerships and digital platforms play a larger role in scaling these vehicles. As product structures evolve, fee models align to net asset value rather than committed capital for semi-liquid formats in the United States private equity market.
Geography Analysis
The Northeast accounted for 41.64% of the United States' private equity market share in 2025, anchored by the New York financial hub and the Boston biotech corridor that supports healthcare and software deal pipelines. The region benefits from deep advisory ecosystems and the proximity of leading limited partners, which tightens feedback loops between allocators and managers in the United States private equity market. Legal and accounting infrastructure in the corridor supports separation-heavy transactions and cross-border financings, which positions the region well for carve-outs and complex exits. Regulatory oversight from the SEC’s core offices informs adviser compliance priorities that are often adopted early by Northeast-based managers. The United States private equity market size in the Northeast reflects a concentration of high-value deals that rely on sector specialization and operating expertise.
The West is projected to grow at a 12.38% CAGR through 2031 as Silicon Valley software consolidation and Colorado’s clean energy investments advance. California anchors enterprise software, cloud infrastructure, and AI platforms, and the region’s venture density offers exit optionality through sponsor secondaries and continuation vehicles in the United States private equity market. Compliance considerations tied to climate disclosure rules in California and other states expand diligence requirements for West Coast targets. Arizona and Nevada are developing into data center hubs that serve AI workloads, and Utah’s software corridor supplies vertical-SaaS targets for platform roll-ups in the United States private equity market. These dynamics keep the West an attractive region for both buyout and growth equity sponsors.
The South and Midwest continue to capture inflows supported by corporate relocations, demographic growth, succession-driven founders, and energy transition projects. Texas remains a top destination for energy, technology, and healthcare investments, while Florida shows momentum in healthcare services and logistics in the United States private equity market. North Carolina and Georgia attract capital across fintech and financial services, and government contracting footprints in Virginia and Tennessee add depth to deal pipelines. The Midwest remains fertile for manufacturing and logistics roll-ups where entry multiples often sit below coastal levels and where integration can create value in the United States private equity market. Add-on density remains high in the lower middle market across these regions, which supports national scale strategies under experienced operators.
Regulatory Landscape
US private equity operates under investment adviser oversight led by the Securities and Exchange Commission (SEC), with system-wide monitoring that can involve bodies such as the Financial Stability Oversight Council (FSOC). In March 2025, SEC staff issued a no-action position that simplified accredited-investor verification for Rule 506(c) offerings by permitting reliance on minimum investment amounts. This reduced friction for general solicitation and supported broader retail-aligned, semi-liquid structures.
In 2026, several policy tracks added new compliance and reporting considerations alongside capital-formation initiatives. The SEC and CFTC proposed amendments to Form PF on June 23, 2026 (Release No. IA-6959), aiming for streamlined reporting, higher thresholds, and a tighter focus on systemic-risk monitoring. FSOC also issued proposed interpretive guidance in May 2026 that emphasized an activities-based approach for nonbank financial company oversight, while the US Department of Labor (DOL) advanced ERISA-related rulemaking on fiduciary process for participant-directed plans that can influence how retirement channels evaluate private equity exposure.
Value Chain Analysis
The US private equity value chain begins with capital formation from limited partners (pension funds, insurance companies, endowments, family offices and HNWIs) into general partner-managed funds, followed by sourcing and underwriting through intermediated auctions and proprietary origination. Deal execution then flows through legal, accounting, and advisory providers into acquisition financing, including syndicated leveraged loans, high-yield, and private credit. Post-close governance relies on board oversight and operating partner programs that drive pricing, procurement, digital transformation, and add-on integration.
Downstream stages focus on portfolio value creation and liquidity management, including add-ons, carve-outs, operational transformation, and exits through strategic sales, sponsor-to-sponsor transactions, IPOs, and secondaries or continuation vehicles. Sponsor ecosystems increasingly emphasize portfolio-to-portfolio combinations and platform building, such as Thoma Bravo combining WWEX Group with Auctane to create a larger technology-enabled logistics platform. Trade bodies such as the American Investment Council (AIC) also shape the ecosystem through policy advocacy and engagement on fiduciary and retirement-plan frameworks that influence distribution and product design for private market access.
Competitive Landscape
The United States private equity market is moderately concentrated at the top, with the ten largest managers collectively representing a sizable share of assets while leaving significant room for mid-market specialists. Competition has intensified as sovereign wealth funds and large strategics engage more actively in control transactions, which sustains elevated entry multiples and demands sharper operating theses inside the United States private equity market. Sponsors lean into digital toolkits to accelerate sourcing and diligence, and AI adoption in portfolio operations supports sales and service efficiency. For example, firms have deployed AI to reduce call times and lift retention in customer-facing platforms, which helps offset higher financing costs in the United States private equity market. Scale advantages continue to support fund-raising momentum for sector specialists that can demonstrate repeatable exits and disciplined capital rotation.
Managers are repositioning value creation from financial engineering to revenue and margin growth as exit multiples remain below entry levels in many sectors. Add-on acquisitions comprised a significant share of buyout activity in 2025, which aligns with platform strategies that build regional density and unify systems in the United States private equity market. Technology enablement across pricing, procurement, and integration planning has become a baseline expectation for operating teams. Firms have also accelerated secondaries and continuation vehicles to balance liquidity and long-hold theses, which reduces pressure to sell into soft windows in the United States private equity market. Manager selection matters more as performance dispersion widens between top-quartile and median funds.
Select platform examples illustrate the strategic playbook. Thoma Bravo’s carve-out of Boeing’s Digital Aviation Solutions in April 2025 demonstrated conviction in software platforms with mission-critical workflows and scale potential within the United States private equity market. Warburg Pincus continued to expand in financial services through targeted growth investments that leverage operating partnerships to accelerate product and distribution. Brookfield highlighted operating AI to improve customer service outcomes in residential infrastructure, illustrating how sponsors translate technology into measurable KPIs across holdings in the United States private equity market. These moves reflect a broader pivot toward operating intensity and sector depth that underpins competitive advantage.
United States Private Equity Industry Leaders
Thoma Bravo LP
Apollo Global Management, Inc.
Blackstone Inc.
Kohlberg Kravis Roberts & Co. L.P. (KKR)
The Carlyle Group Inc.
- *Disclaimer: Major Players sorted in no particular order

Market Opportunities and Future Outlook
Retirement-channel access and product structuring remain an active opportunity as policymakers clarify fiduciary process for participant-directed plans. The DOL released a proposed rule on March 30, 2026 that establishes a process-based safe harbor approach for plan fiduciaries selecting designated investment alternatives (DIAs), building on earlier federal actions such as the August 7, 2025 Executive Order focused on reducing barriers to including alternative assets in 401(k) plans. Alongside the SEC staff position in March 2025 that eased Rule 506(c) accredited-investor verification, these steps support new distribution pathways for private equity exposure through registered and retirement-compatible vehicles, where liquidity design, fee transparency, and operational controls align with ERISA and SEC expectations.
Platform consolidation and operational value creation continue to open opportunities in software, tech-enabled services, and infrastructure-linked themes, where sponsors can compound improvements through add-ons and portfolio integrations. Thoma Bravo completed its USD 12.3 billion acquisition of Dayforce in February 2026, reinforcing sponsor willingness to deploy large checks into scaled, recurring-revenue software assets where operational transformation can be applied. Large, structured capital solutions tied to AI and digital infrastructure also point to deal formats that combine sponsor equity, private credit, and partnership capital, expanding the toolkit for managers underwriting complex governance and long-duration cash flows.
Recent Industry Developments
- July 2026: Apollo-managed funds completed the acquisitions of Emerald Holding, Inc. and Questex, LLC, creating a scaled B2B experiential events and media platform. The transaction consolidates fragmented trade-show and business information assets into a single sponsor-controlled platform, with support for cross-sell and margin initiatives through centralized technology and operations.
- July 2026: Blackstone announced an approximately USD 5.34 billion investment in a power-innovation joint venture with Williams. The commitment shows continued sponsor deployment into energy and infrastructure themes adjacent to electrification and data center power needs, alongside a large-scale platform for operating improvements and structured growth capital.
- February 2026: Thoma Bravo completed its acquisition of Dayforce, Inc. for about USD 12.3 billion, taking the human-capital-management software provider private. The close reinforces sponsor appetite for software platforms with sticky workflows and recurring revenue, and it adds another large asset to the pipeline for add-ons, product investment, and AI-enabled efficiency programs.


Research Methodology Framework and Report Scope
Market Definition and Coverage
For this report, the United States private equity market is sized as the value of capital managed and deployed through private equity funds focused on acquiring and actively improving private companies and private buyouts within the United States.
Scope exclusions: The sizing excludes pure venture capital activity, hedge funds, and public market-only strategies that do not involve private equity ownership and control.
Segmentation Overview
- By Fund Type
- Buyout Funds
- Growth Equity Funds
- Venture Capital Funds
- Mezzanine & Preferred Equity Funds
- Distressed/Turnaround Funds
- Infrastructure & Energy Transition Funds
- By Sector Focus
- Technology & Software
- Healthcare & Life Sciences
- Consumer & Retail
- Industrial & Manufacturing
- Financial Services & FinTech
- Energy, Power & Utilities
- By Deal Size
- Small-Cap (Less than $100 M EV)
- Mid-Cap ($100 M - $1 B EV)
- Large-Cap ($1 B - $5 B EV)
- Mega-Deals (Greater than $5 B EV)
- By Investor Type
- Pension Funds
- Insurance Companies
- Endowments & Foundations
- Funds of Funds
- Family Offices & HNWIs
- Corporate/Strategic LPs
- By Geography (United States)
- Northeast
- Midwest
- South
- West
Data Sources, Market Sizing, and Validation
Desk Research
Desk research started by mapping demand and supply signals visible in public disclosures, so the assumptions align with what the private equity industry reports and funds execute in practice. We used sources such as the US Securities and Exchange Commission (Form ADV filings and regulatory releases), the US Bureau of Economic Analysis and Bureau of Labor Statistics (macro and sector activity context), and the Federal Reserve (credit conditions and the rate environment that affects deal financing).
To cross-check fundraising and transaction momentum, we also reviewed trade association publications such as the American Investment Council, along with company filings, investor presentations, and reputable financial press coverage of major buyouts and exits. Where firm-level metrics were not fully available, paid databases were used selectively for company financials and intelligence, news and financials screening, and patent databases to support sector exposure checks. This list is illustrative and not exhaustive, and many other sources were reviewed to collect data, validate assumptions, and clarify open questions.
Primary Interviews and Surveys
Primary interviews and surveys were used to pressure-test what desk sources cannot fully explain, mainly fee dynamics, holding period changes, exit timelines, and how deal size bands move when financing conditions shift. We spoke with fund managers, limited partner participants, advisors, and operating partners across the United States, then revisited responses when a key assumption moved materially, such as leverage appetite or expected exit multiples in common sectors.
Distribution of primary research fieldwork respondents
| Company type | Respondent position |
|---|---|
| Top tier: 37% | CXOs: 14% |
| Mid tier: 48% | Functional/Unit leaders: 35% |
| Smaller Players: 15% | Managers: 51% |
Market-Sizing & Forecasting
The core sizing model starts from a top-down build that uses observable private equity activity pools in the United States, then reconstructs market value through capital formation and deployment indicators that can be verified year by year. Once this first pass was built, totals were corroborated with selective bottom-up approximations, such as sampled manager roll-ups, channel checks on fundraising pace, and implied value using average ticket sizes by deal band multiplied by observed deal counts.
Key inputs treated as fingerprints include fundraising volume, deal value and deal counts by buyout size range, typical holding periods and exit pacing, and the direction of financing conditions (which affects leverage and closing timelines). For forecasting, scenario analysis was used so rate paths, exit window timing, and fundraising recovery can be flexed without breaking the model logic. When bottom-up coverage was thin for smaller managers or less disclosed strategies, gaps were handled through calibrated participation factors. Those factors were validated with interview feedback and then reconciled back to the top-down totals.
Data Validation & Update Cycle
Model outputs were checked against multiple independent signals, including the implied pace of capital raised versus deployed, and whether the trend matches reported dealmaking and exit conditions in the same period. If a variance looked too large, the underlying driver was traced back, such as an outlier in assumed average deal size or an unusual financing year, then corrected before sign-off.
A multi-step internal review is followed so assumptions, calculations, and units are consistent across the series. Reports are refreshed annually, with interim updates triggered by material shifts such as sharp rate moves, a sudden reopening of IPO markets, or regulation changes that impact fundraising. Before delivery, the latest public releases are rechecked so clients receive an updated view.
Mordor Intelligence's United States Private Equity Market Sizing Compared With Other Published Estimates
Published market sizes for US private equity can look far apart because the term is used to mean different things, and the measurement unit changes across studies. Some figures track assets under management, others reflect annual fundraising, and a few mix deal value, private credit, and secondaries into one pool, which changes the total even before forecasting begins.
Fundraising totals, reported deal value, and leverage market conditions are the evidence used to keep Mordor Intelligence's estimate tied to private equity ownership activity rather than annual flow-only measures or broader alternative assets. The biggest gaps typically come from scope choices (AUM versus annual activity), whether growth equity and private credit are included, the treatment of continuation vehicles and secondaries, and how currency timing and refresh cadence are handled when markets move quickly.
Benchmark comparison
| Source | Market Size | Gaps in Research Methodology |
|---|---|---|
| Mordor Intelligence | USD 900.16 B (2026) | |
| Industry Association A | USD 285.00 B (2024) | This figure reflects annual fundraising volume, so it measures new capital raised in the year rather than capital value managed and deployed over fund lifecycles. |
| Advisory Report B | USD 838.50 B (2024) | This estimate is deal activity value focused and can include a broader set of transactions like add-ons and growth equity, which shifts totals based on that year's closing mix and valuation levels. |
Taken together, the spread is mainly explained by what each source counts and the time window being measured. The model remains repeatable because the inputs are tied to visible fundraising, deployment, and deal activity signals, and assumptions are revisited when the market environment changes.


Key Questions Answered in the Report
What is the current size and growth outlook for the United States private equity market?
The United States private equity market size is USD 900.16 billion in 2026 and is projected to reach USD 1,402.46 billion by 2031 at a 9.27% CAGR.
Which fund types lead and which grow fastest in the United States private equity market?
Buyout Funds led with 48.39% share in 2025, while Venture Capital Funds are projected to grow fastest at a 12.37% CAGR through 2031.
Which sectors show the strongest momentum within the United States private equity market?
Technology & Software led with 33.24% share in 2025, while Healthcare & Life Sciences is projected to expand at a 14.39% CAGR to 2031.
How are financing conditions affecting deals in the United States private equity market?
All-in borrowing costs eased from 2023 peaks but often remain near 9% to 10% for upper mid-market credits, which raises equity checks and increases the focus on operating value creation.
Where is regional activity concentrated in the United States private equity market?
The Northeast accounted for 41.64% of activity in 2025, and the West is projected to grow at a 12.38% CAGR through 2031.
What strategies are sponsors using to address exit and liquidity timing in the United States private equity market?
Managers increasingly use add-ons for scale, continuation vehicles, and secondaries to provide interim distributions while preserving long-term upside.
Page last updated on:


 Your data is secure and never sold or shared.


