
Market Overview
| Study Period | 2020 - 2031 |
|---|---|
| Forecast Data Period | 2026 - 2031 |
| Base Year Market Size (2025) | USD 8.86 Billion |
| Market Size (2026) | USD 9.12 Billion |
| Market Size (2031) | USD 10.54 Billion |
| Growth Rate (2026 - 2031) | 2.94 % |
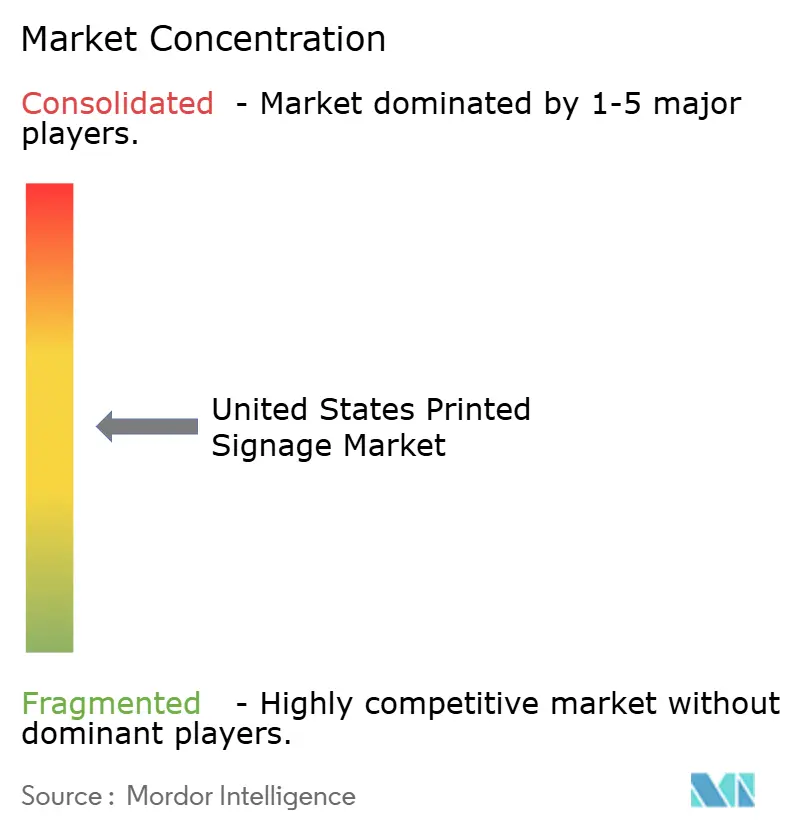
| Market Concentration | Medium |
Major Players *Disclaimer: Major Players sorted in no particular order Image © Mordor Intelligence. Reuse requires attribution under CC BY 4.0. | |
United States Printed Signage Market Analysis by Mordor Intelligence
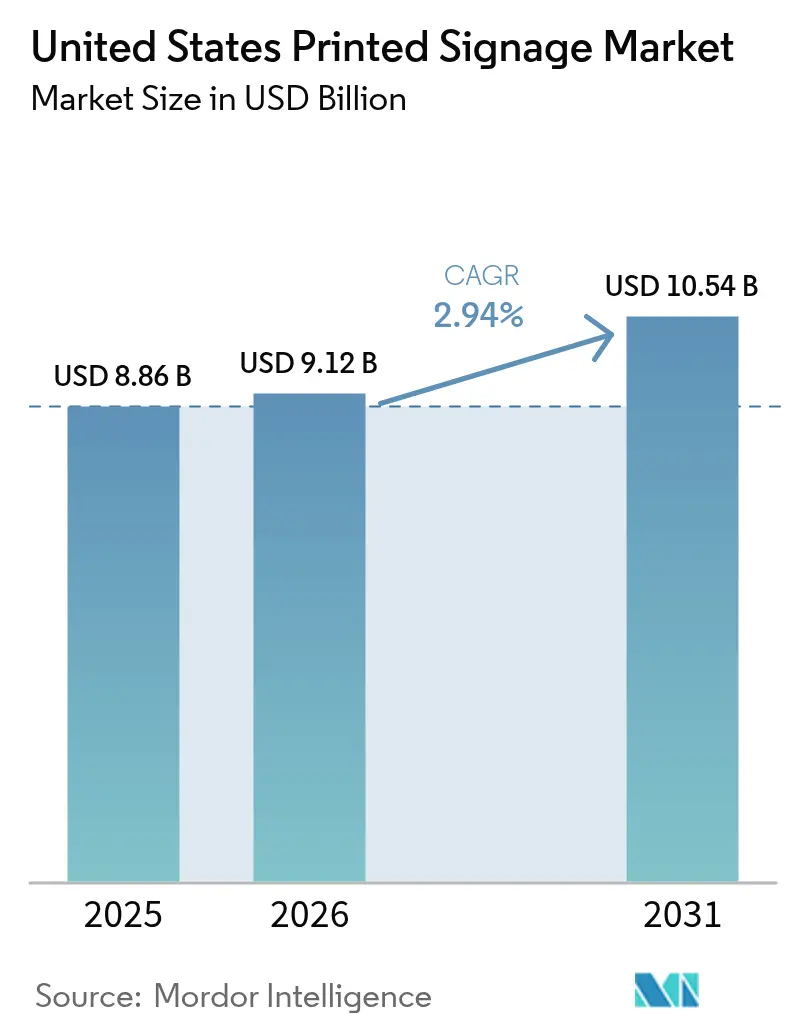
The United States printed signage market size was valued at USD 8.86 billion in 2025 and estimated to grow from USD 9.12 billion in 2026 to reach USD 10.54 billion by 2031, at a CAGR of 2.94% during the forecast period (2026-2031). The market size outlook reflects structural shifts in which static media competes with digital solutions even as infrastructure funding and evolving retail formats bolster demand. Cost-effectiveness in long-duration outdoor applications, federal “Investing in America” branding mandates, and rapid quick-service restaurant (QSR) roll-outs underpin near-term growth. Material innovation-especially recyclable substrates-mitigates regulatory risk, while inkjet’s short-run economics strengthen provider margins. Supply-chain volatility for PVC and aluminum composites, together with widening environmental oversight, poses strategic risks that favor diversified sourcing and sustainable materials.
Key Report Takeaways
- By material, PVC and plastic composites led with 38.02% of the United States printed signage market share in 2025, while paper and cardboard are set to expand at a 4.18% CAGR through 2031.
- By product, banners, flags, and backdrops accounted for 31.05% of the United States printed signage market size in 2025; backlit displays hold the fastest growth outlook at 3.38% CAGR to 2031.
- By application, outdoor formats dominated with 60.78% of the United States printed signage market share in 2025, whereas indoor signage is projected to rise at a 4.04% CAGR over 2026-2031.
- By end-user vertical, retail commanded 27.18% of the United States printed signage market size in 2025; education and government demand is climbing at a 3.92% CAGR to 2031.
- By printing technology, inkjet systems held 42.05% United States printed signage market share in 2025 and are predicted to advance at a 4.14% CAGR through 2031.
Note: Market size and forecast figures in this report are generated using Mordor Intelligence’s proprietary estimation framework, updated with the latest available data and insights as of 2026.
United States Printed Signage Market Trends and Insights
Drivers Impact Analysis*
| Driver | (~) % Impact on CAGR Forecast | Geographic Relevance | Impact Timeline |
|---|---|---|---|
| Cost-effectiveness of printed signage | +0.8% | National, QSR and value-focused retail | Short term (≤ 2 years) |
| Surging demand from quick-service restaurants | +0.6% | Texas, California, Florida corridors | Medium term (2-4 years) |
| Digital short-run printing lowering inventory costs | +0.5% | Nationwide, regional franchises | Medium term (2-4 years) |
| Growing retail pop-up and experiential stores | +0.4% | New York, California, Illinois urban centers | Short term (≤ 2 years) |
| Infrastructure stimulus boosting outdoor advertising | +0.3% | IIJA transportation corridors | Long term (≥ 4 years) |
| Rise of recyclable/biodegradable sign materials | +0.2% | California and Northeast | Long term (≥ 4 years) |
| Source: Mordor Intelligence | |||
Cost-Effectiveness Drives Market Resilience Against Digital Alternatives
Printed signage remains the lowest-total-cost option for static outdoor and QSR drive-through menus because it requires no electricity or network infrastructure. Digital displays consume 100–400 watts and impose service costs, whereas printed boards are maintenance-light, an advantage for operators struggling with staffing gaps as 70% of restaurants reported hard-to-fill positions in 2024. Budget-sensitive chains therefore continue to standardize on durable print packages for high-traffic sites. The result is sustained baseline demand that supports the United States printed signage market even as digital alternatives mature.
QSR Expansion Fuels Systematic Signage Demand
U.S. QSR sales surpassed USD 1.1 trillion in 2024, prompting new builds and remodels that each require full signage suites-storefront, menu boards, compliance notices, and temporary promotions. Franchisees favor printed assets for uniform color matching across hundreds of outlets and simpler procurement compared with IT-heavy digital screens. Drive-through lanes, where glare and weather challenge LCD readability, further secure printed formats. These high-volume roll-outs anchor revenue visibility for vendors across the United States printed signage market.
Digital Short-Run Printing Transforms Inventory Economics
Modern inkjet presses eliminate setup plates, allowing economical runs of fewer than 100 units. Retailers capitalize on this agility to refresh seasonal campaigns without locking cash in old inventory. Labels and Labeling reported accelerating converter investment to meet these micro-run needs. [1] Reduced obsolescence risk encourages broader adoption of localized graphics, extending the application scope for the United States printed signage market.
Pop-Up Retail Drives Temporary Signage Innovation
Experiential pop-ups require lightweight, portable signs that install in hours and exit cleanly. Fabric backdrops and foldable frames now dominate these deployments, meeting urban landlords’ no-alteration clauses. Brands value the tactile impact of printed textiles, which complement digital activations without power or data cabling. These agile formats open incremental revenue pools across the United States printed signage market, especially in dense metros where real estate costs favor temporary concepts.
Restraints Impact Analysis*
| Restraint | (~) % Impact on CAGR Forecast | Geographic Relevance | Impact Timeline |
|---|---|---|---|
| Advent of digital signage | -0.9% | High-traffic QSR and retail sites | Medium term (2-4 years) |
| Environmental regulations on PVC substrates | -0.4% | California, Northeast, federal path | Long term (≥ 4 years) |
| Supply chain volatility of paper and aluminum composites | -0.3% | Nationwide freight-sensitive zones | Short term (≤ 2 years) |
| Labor shortages in wide-format printing shops | -0.2% | Manufacturing regions | Medium term (2-4 years) |
| Source: Mordor Intelligence | |||
Digital Signage Adoption Accelerates Across High-Value Applications
Dynamic menu boards and interactive displays now integrate with cloud CMS and AI analytics, allowing price shifts and personalized ads at scale. Large QSR chains and flagship retailers view these capabilities as revenue multipliers, eroding share from static boards. However, infrastructure costs and maintenance requirements still limit penetration, preserving significant addressable volume for the United States printed signage market in cost-centric venues.
Environmental Regulations Target PVC Substrate Usage
The Environmental Protection Agency’s Safer Choice framework and state-level rules restrict vinyl chloride exposure, driving up compliance costs for PVC sheet suppliers. [2] California’s early bans often set nationwide precedent, prompting multi-state chains to pre-specify recyclable alternatives. While eco-friendly films such as non-PVC polyolefins carry price premiums, early adopters gain procurement preference in government bids, reshaping material demand across the United States printed signage market.
*Our forecasts treat driver/restraint impacts as directional, not additive. The impact forecasts reflect baseline growth, mix effects, and variable interactions.
Segment Analysis
By Material: PVC Dominance Faces Sustainability Pressures
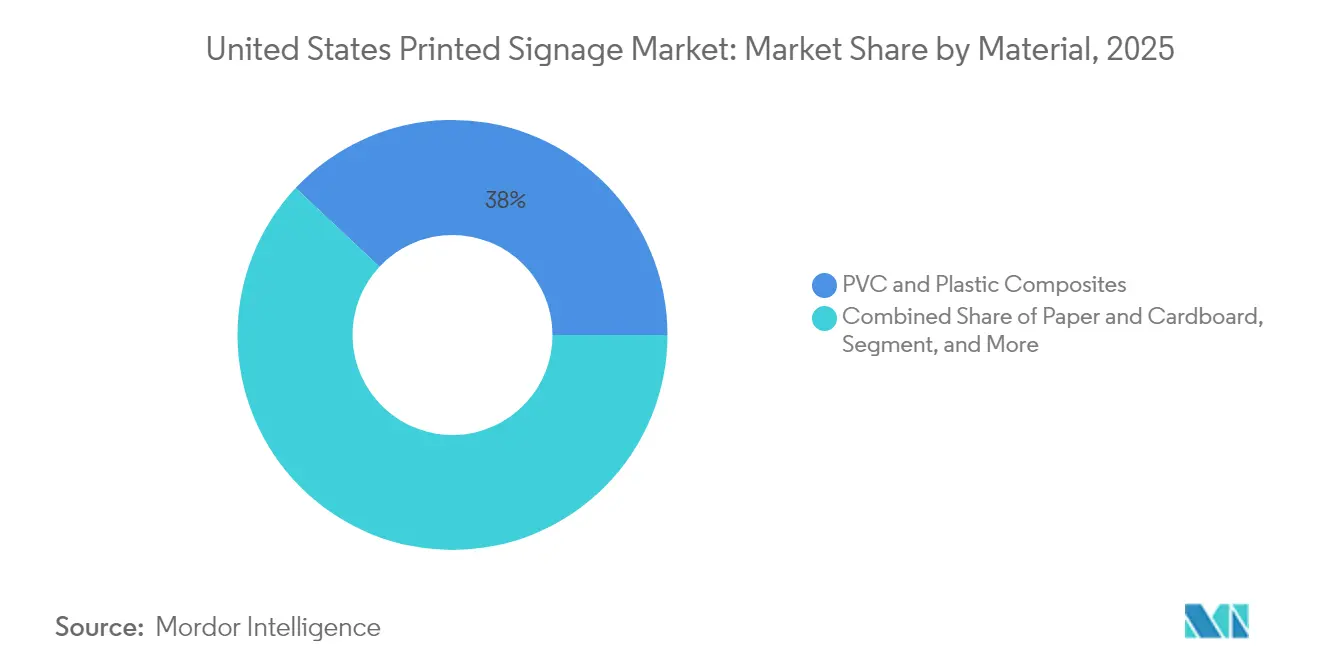
PVC and plastic composites captured 38.02% of United States printed signage market share in 2025 owing to superior weather resistance. The segment’s growth is slowing as compliance costs rise, but absolute demand remains high for highway and construction signage tied to IIJA projects. Paper and cardboard’s 4.18% CAGR signals rapid substitution in indoor décor and short-lifecycle retail campaigns, while recyclable rigid boards such as Neenah’s Endura line win institutional contracts.
For premium outdoor installations, metal sheets retain niche appeal, and fabric substrates scale alongside pop-up retail. Emerging biodegradable films position vendors to hedge regulatory risk and safeguard margins. These shifts ensure material diversification within the United States printed signage market as buyers balance cost, durability, and sustainability credentials.

By Product: Banners Lead While Backlit Displays Accelerate
Banners, flags, and backdrops delivered 31.05% of the United States printed signage market size in 2025, sustained by versatility in events, storefronts, and civic campaigns. Their lightweight construction simplifies logistics and installation, keeping unit costs low. Backlit displays, though smaller in volume, will outpace other products at a 3.38% CAGR. Retailers deploy illuminated graphics in windows and transit hubs, seeking premium aesthetics that command consumer attention after dark.
Billboards remain indispensable where zoning impedes digital boards, especially along federally funded corridors that must feature “Investing in America” branding. Point-of-purchase displays preserve impulse-buy lift in supermarkets, blending with QR-code interactivity. Such diversification underscores the resilience of the United States printed signage market against single-product disruption.
By Application Type: Outdoor Leadership Challenged by Indoor Growth
Outdoor installations represented 60.78% United States printed signage market share in 2025 thanks to billboards, construction hoardings, and roadside menus. IIJA roadway upgrades guarantee multi-year project pipelines for reflective and high-durability substrates. Yet indoor formats will expand faster at 4.04% CAGR as experiential retail, pop-ups, and institutional wayfinding programs scale.
Indoor environments allow cheaper materials and design freedom, fostering creative point-of-sale concepts that reinforce omnichannel campaigns. Educational campuses invest in updated wayfinding and compliance graphics during facility renovations, adding volume to the United States printed signage market while aligning with ADA visibility rules.
By End-User Vertical: Retail Dominance Meets Government Growth
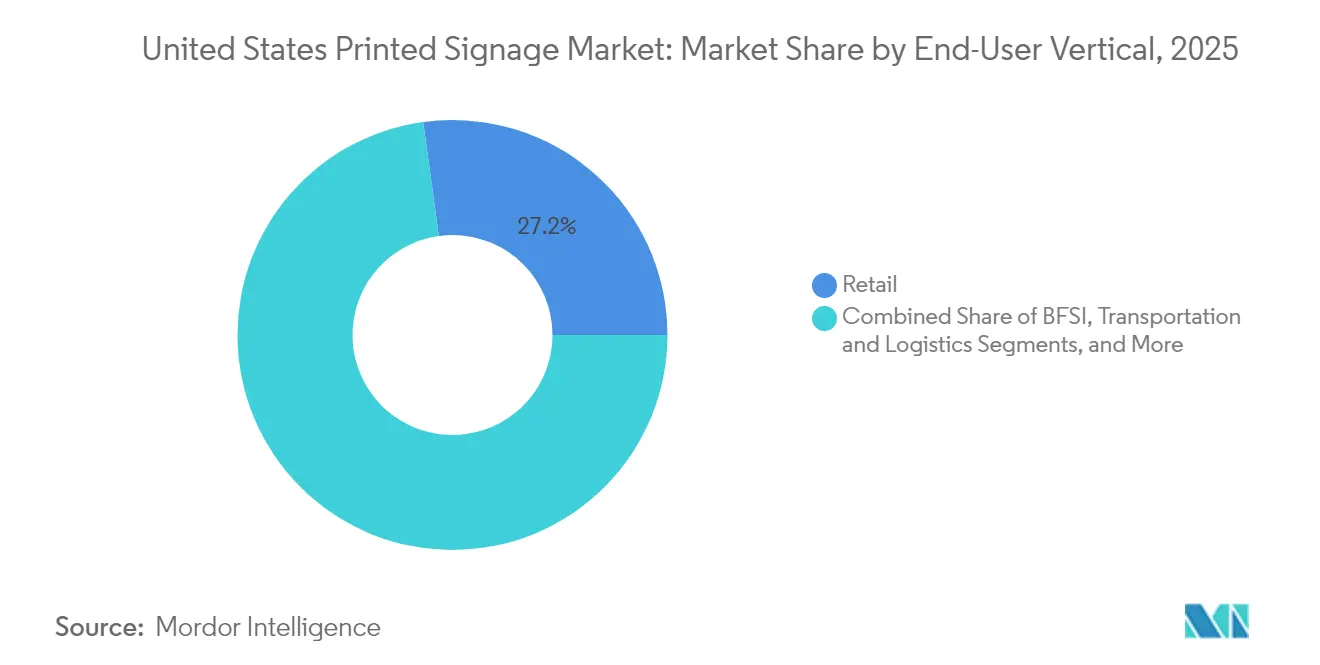
Retail generated 27.18% of the United States printed signage market size in 2025 due to constant promotional activity and store refresh cycles. Chains lean on print kits to maintain brand consistency across thousands of outlets. Education and government entities, however, will record the highest CAGR at 3.92% through 2031. Public-sector funding for school modernizations and transit hubs mandates standardized signage packages that meet accessibility, bilingual, and sustainability criteria.
Transportation authorities commissioning new terminals specify tactile and high-contrast signs, widening scope for specialized vendors. BFSI institutions continue to require audited compliance disclosures posted at branch entrances. Collectively, these vertical trends diversify opportunity streams within the United States printed signage market beyond retail dependence.
By Printing Technology: Inkjet Leadership Strengthens
Inkjet systems secured 42.05% United States printed signage market share in 2025 and will grow at a 4.14% CAGR, propelled by improved UV-curable inks that adhere to varied substrates without primers. Shops embracing single-operator workflows and automated finishing mitigate the sector’s projected 1.9 million labor shortfall by 2033.
Screen printing remains cost-effective for very large runs but lacks the variable-data flexibility retailers now expect. Hybrid lines blending inkjet with rotary screen allow printers to harmonize volume and customization, sustaining competitiveness. As technology refresh cycles shorten, capex decisions increasingly dictate market positioning across the United States printed signage market.
Geography Analysis
California leads spending momentum, backed by USD 32.7 billion in IIJA allocations that stipulate consistent “Investing in America” project branding. The state’s aggressive PVC regulation simultaneously spurs demand for premium non-PVC substrates, raising average selling prices.
Texas follows with USD 28 billion in federal infrastructure grants plus private-sector building booms along the I-35 corridor. Retail buildouts for expanding QSR brands and warehouse logistics hubs require high volumes of outdoor directional signs, bolstering regional contributions to the United States printed signage market.
Northeast metros such as New York absorb USD 23.6 billion in federal funds and exhibit sophisticated buyer preferences-favoring recyclable materials and sleek mounting systems compatible with dense streetscapes. Florida’s hospitality sector cycles seasonal signage packages that withstand UV exposure and hurricane-grade winds, anchoring a steady refurbishment revenue stream.
Midwestern manufacturing zones rely on OSHA compliance and facility signage, prioritizing durable yet economical boards. Mountain-West recreation markets demand eco-sensitive designs that blend with natural scenery, further diversifying substrate requirements. These geographic nuances underline the importance of localized production networks within the United States printed signage market.
Regulatory Landscape
United States printed signage facilities operate under multi-layer regulatory regimes spanning air emissions, chemical handling, and workplace safety. At the federal level, the EPA National Emission Standards for Hazardous Air Pollutants (NESHAP) for the Printing and Publishing Industry under 40 CFR Part 63 governs hazardous air pollutants from printing processes and influences permitting, solvent and ink choices, and control equipment decisions at applicable facilities.
OSHA requirements under 29 CFR 1910 and 29 CFR 1904 apply to printing shops and installation teams, with industry attention focused on heat illness prevention for outdoor and non-climate-controlled operations. Downstream, labeling and consumer information rules anchored by the Fair Packaging and Labeling Act and NIST Handbook 130 guidance shape substrate selection, ink systems, and documentation required for institutional procurement. Local signage ordinances and zoning rules also continue to influence where signage can be installed and how long it can remain in place.
Value Chain Analysis
The United States printed signage value chain begins with raw materials and components, including films, papers, textiles, metals, adhesives, laminates, and inks. These inputs flow to converters and wide-format printers running inkjet, screen, and other printing processes, followed by finishing steps such as lamination, mounting, routing, and kitting. Distribution then moves through local sign shops, franchise networks, and national fulfillment providers serving multi-site retail, QSR, and public-sector customers.
Avery Dennison operates in over 50 countries and supplies materials and digital identification solutions aimed at improving supply chain visibility. Cimpress uses web-to-print platforms to support mass customization across a global brand portfolio. PRINTING United Alliance provides technical guidance on air permitting, hazardous waste, and chemical compliance to support substrate selection and documentation for government procurement.
Competitive Landscape
The United States printed signage market remains moderately fragmented as regional providers offer rapid turnarounds unachievable for national chains. Consolidation persists, typified by R.R. Donnelley’s pending Williams Lea acquisition that extends marketing services across 26 countries. Players investing in high-speed inkjet lines and automated finishing offset rising wages and worker shortages.
Sustainability marks a key differentiator: Arlon’s launch of non-PVC DPF V9500 film captures buyers seeking regulatory compliance without sacrificing outdoor longevity. Start-ups leverage web-to-print portals for direct-to-SMB ordering, pressuring incumbents on price transparency. Patent filings on bio-composite boards and AI-driven layout tools suggest continuous innovation cycles that will reshape market shares over the forecast horizon.
While top suppliers collectively control enough capacity to serve national roll-outs, no single firm exceeds a dominant threshold, keeping pricing disciplined yet competitive. Automation, eco-credentialing, and multi-touchpoint service bundles will determine leadership trajectories inside the United States printed signage market.
United States Printed Signage Industry Leaders
-
Avery Dennison Corporation
-
3A Composites USA Inc.
-
Neenah Paper & Packaging LLC
-
Cimpress plc (Vistaprint)
-
Kelly Gold & Co. Signs Inc.
- *Disclaimer: Major Players sorted in no particular order
Market Opportunities and Future Outlook
Substrate substitution toward recyclable and non-PVC materials is creating identifiable whitespace as buyers look to improve sustainability performance, with paper and cardboard positioned as faster-expanding material segments. Circular-economy programs are also influencing institutional buyers, while IIJA-funded outdoor infrastructure programs and branding initiatives support multi-year signage pipelines. Cimpress web-to-print platforms further support standardized offerings for SMBs and multi-location brands.
Connected and trackable printed graphics broaden what signage can do beyond static messaging, particularly when identification and digital utility are included in deployment. Avery Dennison is advancing NFC inlays and RFID capabilities, and its first-to-market integration of Pragmatic Semiconductor's flexible IC (FlexIC) into its NFC inlay portfolio highlights how interactive signage assets are being built for retail deployments and similar multi-site use cases.
Recent Industry Developments
- May 2026: Avery Dennison announced first-to-market OCC-E certification and How2Recycle pre-qualification for thermal paper label products (DT300LD PLUS and TT with S2550). The move strengthens recyclability signaling across print supply chains and supports buyers tightening sustainability specifications in signage programs. This development expands sustainable-material capabilities for signage labeling and workflow integration.
- February 2026: Avery Dennison announced first-to-market integration of Pragmatic Semiconductor's flexible IC (FlexIC) into its NFC inlay portfolio. This expands interactive signage capabilities, enabling connected assets in retail environments and multi-site rollouts.
- March 2025: Trade-secrets litigation was filed by R.R. Donnelley against Prisma Graphics, highlighting rising intellectual-property stakes in the print-services ecosystem. The action signals tighter IP protections as the market shifts toward integrated marketing services and technology-enabled print workflows. This development underscores the need for robust IP strategies in nationwide signage deployment.
Research Methodology Framework and Report Scope
Market Definition and Coverage
For this methodology, the market covers revenue earned from printed signage products sold and installed in the United States, covering both indoor and outdoor uses, and counted in USD value for the study period.
Scope exclusions: digital-only signage (such as LED video walls) and pure design or advertising services without a printed output are excluded.
Segmentation Overview
- By Material
- Paper and Cardboard
- PVC and Plastic Composites
- Fabric and Textile
- Metal Sheets and Foils
- Wood and Rigid Boards
- By Product
- Billboards
- Backlit Displays
- Point-of-Purchase (POP) Displays
- Banners, Flags and Backdrops
- Corporate Graphics, Exhibition and Trade-show Materials
- Transit and Street Furniture
- Other Products
- By Application Type
- Indoor Printed Signage
- Outdoor Printed Signage
- By End-user Vertical
- Retail
- BFSI
- Transportation and Logistics
- Sports and Leisure
- Entertainment and Media
- Education and Government
- Other End-User Verticals
- By Printing Technology
- Screen Printing
- Inkjet Printing
- Toner-based (Electrophotography)
- Other Printing Technologies
Data Sources, Market Sizing, and Validation
Desk Research
Desk work started with public data that helps us gauge the addressable print activity in the United States and how it is shifting by application. We referenced sources such as the US Census Bureau (Economic Census and related industry datasets), the US Bureau of Labor Statistics (employment and wage series for printing and sign-related roles), the US International Trade Commission DataWeb (imports and exports for printed products and key substrates), and EPA material guidance that affects inks and substrates.
We also reviewed demand triggers and replacement cycles, using transportation and infrastructure program publications, state and local procurement portals, and association or conference materials for wide-format printing where that information was publicly available. Company filings, investor presentations, and reputable press were used to sanity-check pricing direction, substrate availability, and customer mix. For a few private-company checks, we relied on paid subscriptions for financials and intelligence, and for patent activity we used a paid patent database to track printing and substrate innovation. The sources listed here are illustrative only, and many other public and paid references were used for validation and clarification.
Primary Interviews and Surveys
Primary inputs were collected through expert interviews and structured surveys with printing service providers, signage fabricators, substrate distributors, and buyers who procure printed signage for retail, commercial, and public locations. Because this is a United States market, coverage was balanced across major demand pockets using state and metro areas, then cross-checked with input from both national and regional operators so assumptions did not over-rely on one route to market. These conversations helped confirm typical order sizes, the share of indoor versus outdoor work, technology shifts (for example, screen to inkjet), and practical pricing movements reflected in quotes.
Distribution of primary research fieldwork respondents
| Company type | Respondent position |
|---|---|
| Top tier: 29% | CXOs: 13% |
| Mid tier: 54% | Functional/Unit leaders: 30% |
| Smaller Players: 17% | Managers: 57% |
Market-Sizing & Forecasting
Sizing was built using a top-down approach where demand pools were reconstructed from end-use activity that regularly drives purchases of printed signs, then applying adoption and replacement patterns for indoor and outdoor placements. After the demand spine was formed, we corroborated it with selective bottom-up checks using sampled price quotes, typical square-footage per job, and supplier and channel checks from interviews, and then adjusted totals when gaps showed up.
Key inputs for this market included the mix of indoor versus outdoor applications, the share of products like billboards and backlit displays within printed formats, substrate preference shifts (paper and cardboard versus PVC and plastic composites), and the shift in printing technology toward inkjet for short runs. We also tracked indicators that affect order flow, such as retail store openings and refresh cycles, public infrastructure and wayfinding activity, and material and freight cost movements that influence pricing. Forecasts were produced through scenario analysis supported by expert views on budgets and replacement cadence, and then smoothed to keep year-to-year changes consistent with observed operating conditions. Where bottom-up signals were missing for smaller local players, proxies were applied based on regional density and average ticket sizes validated in interviews.
Data Validation & Update Cycle
Outputs were checked in multiple steps so the final numbers stayed consistent with real market signals. We compared the model against independent cues such as printing activity indicators, substrate trade flows, and reported business conditions from industry bodies, then investigated outliers before the final review. If a variance was traced to a definition issue (for example, a product counted as a display rather than signage), we corrected the scope boundary and reran the model.
Reports are refreshed annually, and we also revisit key assumptions when a material event occurs, such as sharp substrate price swings or regulatory changes that affect ink or PVC use. Before delivery, a final analyst pass is completed to incorporate the latest public releases and fresh primary confirmations so clients receive an updated view.
Mordor Intelligence's United States Printed Signage Market Size Compared Against Other Published Estimates
Published market sizes often differ because each publisher defines the market boundary differently and applies different pricing logic for printed output versus related services. Timing also matters, since updates to material prices and demand cycles can move a value-based market quickly.
Shipment and substrate trade signals, along with interview-validated pricing ranges for common printed sign jobs, are used as checks to keep Mordor Intelligence's estimate focused on printed output sold into indoor and outdoor placements, rather than folding in broader advertising spend or equipment revenue.
Benchmark comparison
| Source | Market Size | Gaps in Research Methodology |
|---|---|---|
| Mordor Intelligence | USD 8.86 B (2025) | |
| Industry Publisher A | USD 28.40 B (2026) | Often uses a wider scope that can blend printed signs with adjacent categories like promotional displays, vehicle wraps, and broader sign-related services, which lifts the value pool beyond printed signage output. |
| Industry Dataset B | USD 2.20 B (2026) | Typically reflects only sign and banner shop activity, which can exclude in-house print operations, large-format print within commercial printers, and bigger national fabricators, thereby understating the full printed signage value. |
The spread across figures mainly comes from what is counted and what is left out, not from arithmetic differences. When the scope is tightened to printed signage output in the United States and the pricing assumptions are anchored to repeatable job-level checks, the result is easier to trace, explain, and refresh in a consistent way.
Key Questions Answered in the Report
How large is the United States printed signage market in 2026?
It is valued at USD 9.12 billion and is projected to reach USD 10.54 billion by 2031.
Which product category is growing the fastest?
Backlit displays hold the highest projected CAGR at 3.38% through 2031.
Why does inkjet technology lead U.S. signage production?
Inkjet combines short-run cost efficiency, broad substrate compatibility, and automation features that offset labor shortages.
What regulatory factors influence material choices?
EPA initiatives and state PVC restrictions push buyers toward recyclable and non-PVC substrates.
Which end-user segments show the strongest growth?
Education and government signage demand is expanding at a 3.92% CAGR due to infrastructure modernization programs.
How will infrastructure spending affect future demand?
IIJA requirements for standardized project branding guarantee multi-year volume for outdoor and transit signage.