
Market Overview
| Study Period | 2020 - 2031 |
|---|---|
| Forecast Data Period | 2026 - 2031 |
| Base Year Market Size (2025) | USD 9.15 Billion |
| Market Size (2026) | USD 9.33 Billion |
| Market Size (2031) | USD 10.77 Billion |
| Growth Rate (2026 - 2031) | 2.92 % |
| Market Concentration | Medium |
Major Players *Disclaimer: Major Players sorted in no particular order Image © Mordor Intelligence. Reuse requires attribution under CC BY 4.0. | |
United States Print Label Market Analysis by Mordor Intelligence
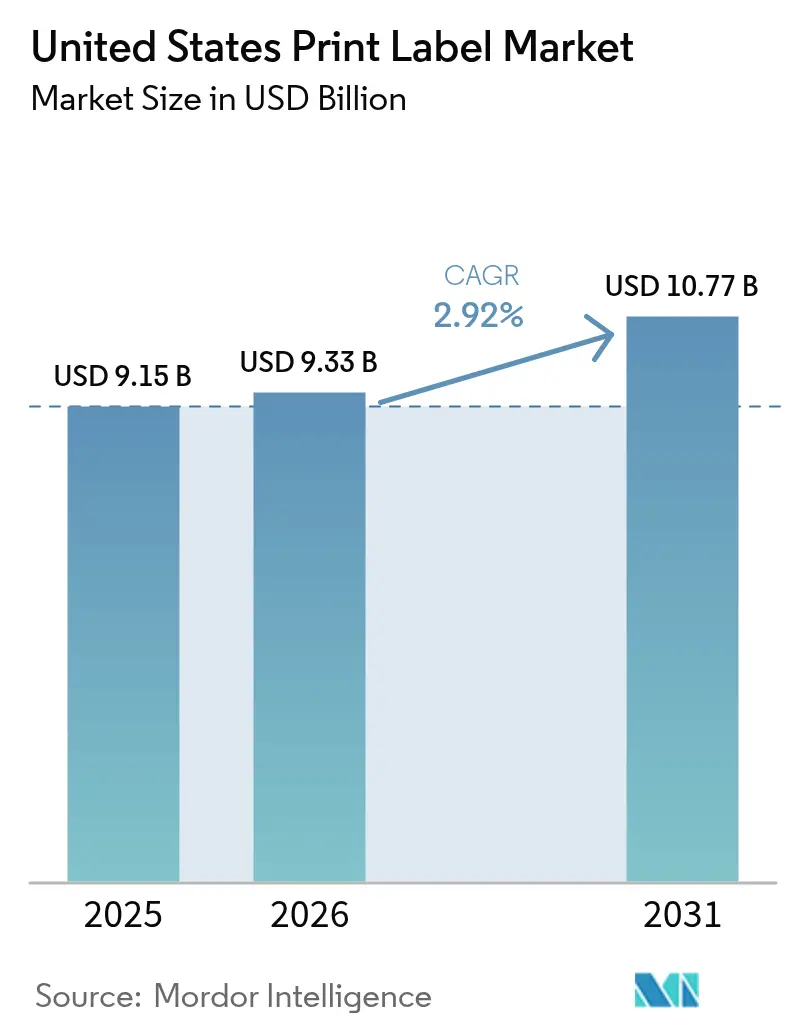
The United States print label market size is projected to expand from USD 9.15 billion in 2025 and USD 9.33 billion in 2026 to USD 10.77 billion by 2031, registering a CAGR of 2.92% between 2026 to 2031. Substrate leaders are feeling cost pressure from acrylic and hot-melt resins, yet converters continue to invest in recyclable polyethylene terephthalate (PET) and biobased films to comply with state Extended Producer Responsibility (EPR) mandates. Brand owners are asking for shorter runs, lot-specific variable data, and sustainability certifications, thereby accelerating the migration from analog flexography toward toner and inkjet presses that eliminate plate waste and permit 48-hour lead times. Consolidation among roughly 2,000 independent converters is reshaping the competitive balance as private-equity-backed roll-ups acquire regional shops and standardize their workflows, raising the minimum efficient scale for new entrants. At the same time, skilled-labor scarcity and volatile substrate lead times are holding back capacity additions, which explains the moderate growth trajectory relative to faster-growing Asian counterparts.
Key Report Takeaways
- By substrate material, PET captured 37.83% market share of the United States print label market in 2025, while biobased and compostable films are forecast to record a 3.57% CAGR through 2031.
- By print technology, flexography held 45.63% of the United States print label market share in 2025, whereas digital printing is projected to grow at a 3.21% CAGR between 2026-2031.
- By label type, pressure-sensitive formats led the United States print label market with 48.04% of the market in 2025, and linerless alternatives are poised for a 3.68% CAGR through 2031.
- By end-user industry, healthcare and pharmaceuticals represented a smaller base but are forecast to post a 3.45% CAGR, the fastest among all segments through 2031. whereas, Food retained the highest contribution at 28.16% in 2025, reflecting stable replenishment of packaged SKUs across U.S. retail channels.
Note: Market size and forecast figures in this report are generated using Mordor Intelligence’s proprietary estimation framework, updated with the latest available data and insights as of 2026.
United States Print Label Market Trends and Insights
Drivers Impact Analysis*
| Driver | (~) % Impact on CAGR Forecast | Geographic Relevance | Impact Timeline |
|---|---|---|---|
| Digital Print Technology Penetration | +0.5% | United States—early adoption in Northeast and West Coast metro areas | Medium term (2-4 years) |
| Healthcare and Cosmetics Label Uptake | +0.4% | United States—pharmaceutical hubs in New Jersey, Massachusetts, California and cosmetics centers in New York, California | Medium term (2-4 years) |
| E-commerce and Logistics Label Volumes | +0.6% | United States—fulfillment-center corridors in Ohio, Pennsylvania, Texas, California | Short term (≤ 2 years) |
| EPR-Driven Shift to Linerless and Recyclable Labels | +0.4% | United States—led by California, Colorado, Maine, Oregon with spillover to national brands | Long term (≥ 4 years) |
| Smart and IoT Labels for Supply-Chain Traceability | +0.3% | United States—early gains in apparel, pharmaceuticals, perishable food | Long term (≥ 4 years) |
| Near-Shoring Driving Short-Run Variable-Data Print | +0.3% | United States—manufacturing reshoring in Southeast and Southwest | Medium term (2-4 years) |
| Source: Mordor Intelligence | |||
Digital Print Technology Penetration
Digital printing already accounts for roughly one-fifth of United States print label market value even though it represents less than one-tenth of unit volume. Converters report that most digital orders run below 5,000 pieces and ship within 48 hours, metrics unattainable for plate-based flexography, so brand owners pay a premium for rapid SKU proliferation and late-stage customization. Hybrid presses that combine flexographic white or spot colors with digital overprints allow converters to amortize their existing narrow-web infrastructure while capturing high-margin short runs. Inline finishing die-cutting, lamination, and foil stamping eliminates secondary steps, slashing makeready waste and supporting sustainability scorecards. Equipment vendors are responding with wider-web digital units, which should lower the cost per square meter and lift digital’s share of the United States print label market over the medium term.[1]
Healthcare and Cosmetics Label Uptake
Serialization deadlines under the Drug Supply Chain Security Act forced pharmaceutical plants to encode National Drug Code, lot, and expiration data on every saleable unit by November 2024, providing a durable tailwind for pressure-sensitive and booklet labels that can carry significant variable information. Parallel FDA enforcement of Unique Device Identification for Class II and III medical devices expanded demand for durable labels resistant to autoclave and gamma-sterilization environments. Cosmetics brands faced new ingredient-disclosure rules under the Modernization of Cosmetics Regulation Act and California’s Right to Know statute, triggering SKU revisions and smaller-batch production. The biological therapeutics pipeline also calls for cryogenic adhesives and tamper-evident seals, lifting the value density of each label sold into this channel. Collectively these factors support the fastest end-user CAGR inside the United States print label market.
E-commerce and Logistics Label Volumes
Parcel volume handled by the United States Postal Service climbed 8% in 2024, with private carriers posting comparable growth, and each shipped item needs at least one thermal or pressure-sensitive label. Same-day delivery hubs process thousands of SKUs per hour, driving the uptake of linerless thermal media that reduce changeovers and cut waste by 30% to 40% by weight. Brands running subscription boxes and meal kits add QR codes linking to unboxing content or returns portals, jobs ideally suited to digital printing. Lithium-battery shipment regulations add separate hazmat pictograms, boosting multi-part label demand. These logistics dynamics explain the +0.6 percentage-point swing to the overall CAGR in the United States print label market.[2]
EPR-Driven Shift to Linerless and Recyclable Labels
Four U.S. states enacted EPR laws that impose escalating fees on hard-to-recycle formats, prompting national brands to specify wash-off adhesives and mono-material constructions validated by the Association of Plastic Recyclers. Wash-off pressure-sensitive labels detach at 60 °C in alkaline baths, preserving PET flake purity for bottle-to-bottle loops. Retailers value linerless alternatives because they eliminate silicone-coated release paper entirely, lowering both disposal costs and Scope 3 carbon metrics. Converter interest has spurred capital spending on specialized coating lines and adhesive chemistries optimized for high-speed logistics printers. Although dispenser compatibility remains a hurdle, the regulatory direction is clear, giving this driver a long-term tailwind inside the United States print label market.
Restraints Impact Analysis*
| Restraint | (~) % Impact on CAGR Forecast | Geographic Relevance | Impact Timeline |
|---|---|---|---|
| Durability Limits in Harsh Conditions | -0.2% | United States—industrial, automotive, outdoor uses | Medium term (2-4 years) |
| Volatile Paper and Resin Input Costs | -0.3% | United States—nationwide across all converters | Short term (≤ 2 years) |
| Skilled Narrow-Web Labor Shortages | -0.2% | United States—Midwest and Southeast corridors | Long term (≥ 4 years) |
| Recycling-Stream Fragmentation | -0.2% | United States—EPR states and municipal programs | Long term (≥ 4 years) |
| Source: Mordor Intelligence | |||
Volatile Paper and Resin Input Costs
Bleached-kraft pulp prices peaked in mid-2024 and were still 18% above 2023 averages in early 2025, while acrylic and hot-melt resin indices held 12% higher than pre-spike levels, compressing converter margins on fixed-price contracts.[3] Smaller converters without hedging programs endure working-capital swings when specialty film lead times triple and post-consumer recycled PET trades at premiums of USD 200-400 per metric ton. Inventory buffers tie up cash, limit capital upgrades, and slow the shift to sustainable materials, shaving 0.3 percentage points off the forecast CAGR for the United States print label market.
Skilled Narrow-Web Labor Shortages
Commercial-printing employment declined 3.2% between 2019-2024, and wage premiums for flexographic press operators now exceed 15% in key Midwest and Southeast clusters. With fewer apprentices entering the trade, converters delay press-line expansions and pay overtime, elevating total cost of ownership for new capacity. Automation can offset some of the gap, yet full Job Definition Format integration covers only a minority of pressrooms. Persistent talent scarcity therefore trims 0.2 percentage points from United States print label market growth over the coming four years.
*Our forecasts treat driver/restraint impacts as directional, not additive. The impact forecasts reflect baseline growth, mix effects, and variable interactions.
Segment Analysis
By Substrate Material: PET Dominance Meets Biobased Disruption
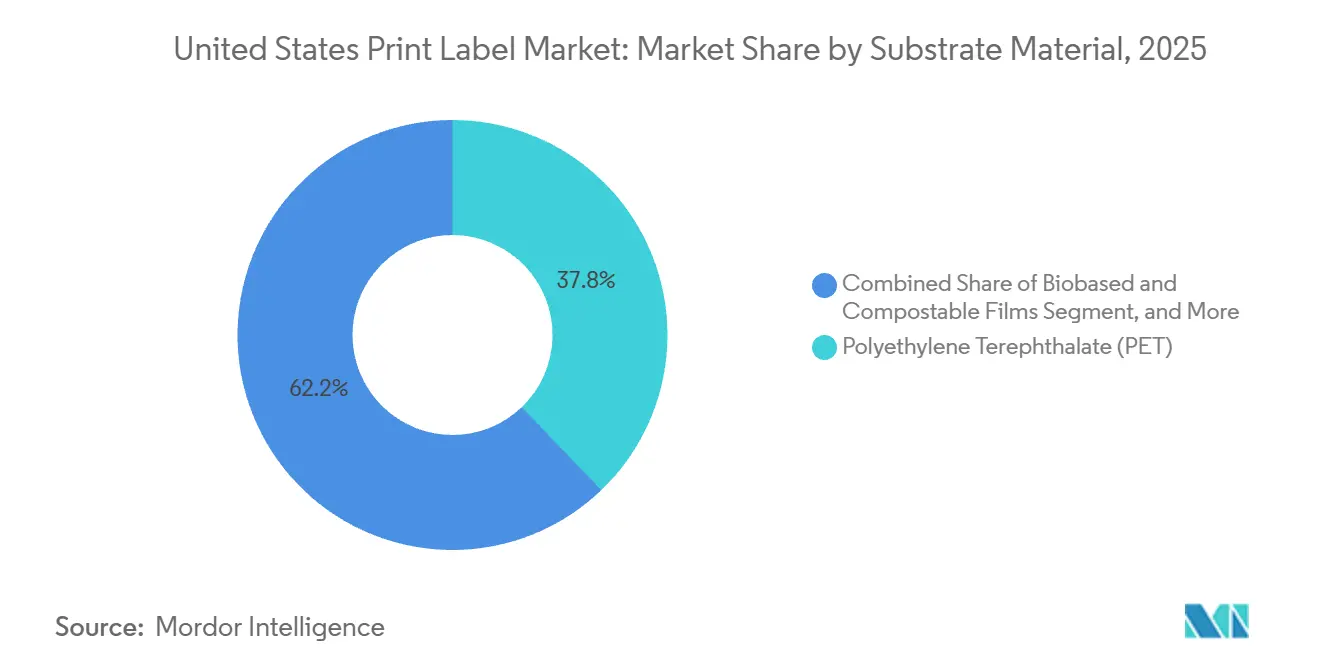
Polyethylene terephthalate sustained a 37.83% market share in 2025, making it the anchor substrate for beverage, personal-care, and pharmaceutical applications that value clarity and recyclability. That prominence keeps PET as the single largest slice of the United States print label market size at both dollar and volume levels. Yet EPR fee structures and retailer scorecards are steering incremental growth toward polylactic-acid and cellulose-based films that meet ASTM D6400 compostability criteria. Biobased offerings are set to grow 3.57% per year to 2031, outpacing every legacy polymer. The premium they command, often 40%-60% higher than standard PET, encourages converters to carve out specialized production cells rather than cannibalize mainstream lines. Over the medium term, broader municipal composting infrastructure will determine how fast these new materials convert trial orders into baseline specifications in the United States print label market.
Investments in recyclable label technologies are picking up. Clean-flake adhesive systems now allow pressure-sensitive labels to float off during caustic washing, unlocking equivalent resin quality to virgin PET for bottle-to-bottle loops. Such innovations not only reinforce PET leadership but also protect its share against polypropylene, which suffers from lower curbside recovery rates. Looking ahead, federal recycled-content mandates, if enacted, could reprice virgin inputs and accelerate brand migration toward both post-consumer recycled PET and bio-based substitutes, reshaping the material hierarchy inside the United States print label market.

By Print Technology: Flexography’s Installed Base Versus Digital’s Agility
Flexography generated 45.63% of market share in 2025 because converters retain decades of investment in narrow-web presses, anilox inventories, and inline finishing assets. These sunk costs keep cost-per-thousand labels low on jobs beyond 10,000 units, anchoring flexo’s role in high-volume food and beverage programs that dominate the United States print label market share figure. However, digital printing’s 3.21% forecast CAGR demonstrates a clear pivot toward short runs and variable data requirements. Hybrid presses now marry flexo for solid backgrounds and white underprints with digital heads for versioning, effectively blurring the boundary between the two technologies.
The economic breakeven between flexo and digital continues to creep upward as inkjet manufacturers release wider-web models and raise maximum linear speed. Concurrently, LED-curable inks improve energy efficiency on newer flexo units, narrowing the total-cost gap. Converters that invest today in workflow automation and color-management software will capture margin from both halves of the technology split, but laggards risk ceding premium work to digitally native entrants as the United States print label market evolves.
By Label Type: Pressure-Sensitive Versatility Challenged by Linerless Efficiency
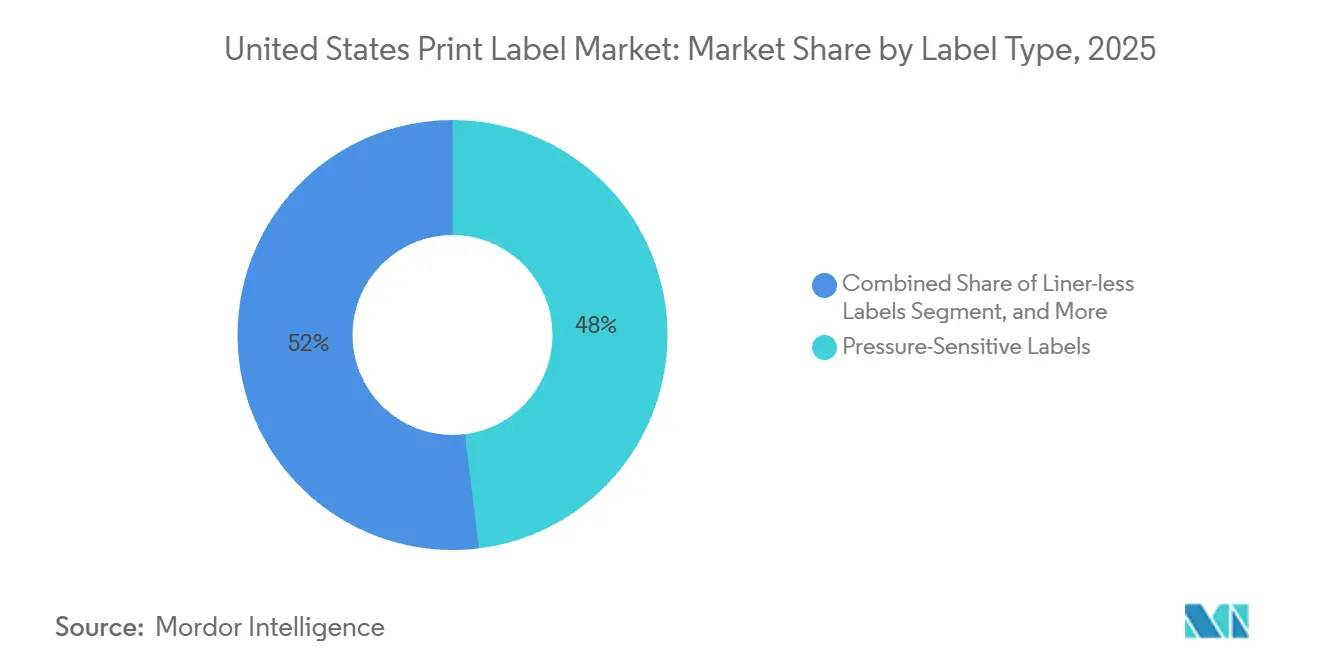
Pressure-sensitive constructions occupied 48.04% of market share in 2025, thanks to dependable application speeds above 600 units per minute and compatibility with nearly every container shape. That versatility will keep them central to the United States print label market, yet linerless rolls are the fastest-growing, with a 3.68% CAGR, propelled by retailers and carriers looking to slash waste sent to landfill. Converters are resolving lingering adhesive bleed issues by developing micro-pattern coatings and climate-controlled inventory protocols, improving machine uptime on high-speed applicators.
Shrink-sleeve labels retain share in craft beverages and personal-care promotions that leverage 360-degree decoration, but PETG and oriented polystyrene are gradually replacing polyvinyl chloride to solve recycling compatibility challenges. Traditional wet-glue paper formats hold on in beer bottling lines where capital depreciation has ended and changeover times are minimal. These sub-trends illustrate how no single format will dominate; instead, converters must maintain multi-technology portfolios to defend their slice of the United States print label market size across diverse end-use cases.
By End-User Industry: Food Stability Versus Healthcare Dynamism
Food applications accounted for 28.16% of market share in 2025, as grocery shelves require constant replenishment of branded and private-label SKUs. This segment yields high volumes yet low margins, and private-label penetration tempers unit expansion. Healthcare and pharmaceuticals, in contrast, will be the fastest-growing vertical at 3.45% CAGR through 2031 as cold-chain biologics and regulatory serialization multiply label formats per vial, carton, and shipper.
Beverage labels benefit from craft-beer proliferation and premium spirits, both of which demand tactile embellishments and variable barcodes for deposit tracking. Cosmetics grow in line with the overall United States print label market, but new ingredient disclosure rules force frequent artwork updates, favoring digital printing. Finally, industrial and logistics labels command the highest value per square meter due to their extreme durability requirements, yet volumes are smaller and cyclical, exposing converters to resin price swings and macro slowdowns.
Geography Analysis
The United States print label market is heavily concentrated in the Northeast, Midwest, and West Coast, which together represented roughly 70% of market share in 2025. These three corridors host most large food processors, pharmaceutical campuses, and consumer-goods headquarters, delivering a steady base of high-volume flexographic work. California has an outsized influence because SB 54 sets a 65% recycling or composting threshold by 2032, forcing national brands to pilot wash-off adhesives and linerless formats in the state first before rolling them out nationwide. The Northeast benefits from dense population centers and proximity to global brand owners that require multilingual artwork and frequent regulatory updates. Meanwhile, the Pacific Northwest attracts early adopters of RFID-enabled shelf tags, leveraging technology sector expertise to roll out frictionless checkout programs that drive incremental smart-label demand.
The Southeast corridor stretching from Georgia through Tennessee is the fastest-growing region thanks to reshored manufacturing in food, apparel, and home-care categories. New facilities specify digital presses that can handle small batches and multilingual packaging without expensive plate changes, thereby enlarging the digital share of the United States print label market in this geography. Texas has become a logistics powerhouse after carriers opened several megasortation hubs around Dallas-Fort Worth and Houston, lifting thermal and linerless shipping-label volumes. Mountain and Plains states remain smaller in absolute terms, yet they post above-average percentage gains tied to craft beverage and organic food brands that favor short-run digital jobs. These dynamics explain why converters continue to add narrow-web sites in Arizona, Colorado, and Utah despite the lower population density.
The Midwest faces competing trends that balance growth and constraint. On one hand, legacy flexographic press builders, large food canners, and brewing facilities provide a stable pipeline of label orders that favor long-run flexo economics. On the other hand, skilled-labor shortages are acute; wage premiums for experienced press operators rose above 15% between 2023-2025, and some converters now recruit from technical colleges as far away as Florida to staff new shifts. State-level regulations create further complexity, as California’s Proposition 65 warnings, Maine’s stewardship rules, and New York’s textile-labeling standards each impose unique copy and formatting, fragmenting SKUs and raising artwork management costs. Municipal composting pilots in Seattle, San Francisco, and Portland encourage brands to test polylactic-acid labels, yet real landfill diversion lags because many facilities cannot hold the 55 °C temperatures needed for rapid biodegradation. Collectively, these cross-currents ensure that no single region can dictate nationwide substrate or print-technology choices, compelling converters to maintain multi-plant networks and agile workflows tailored to local requirements.
Regulatory Landscape
The United States print label market operates under federal packaging labeling rules anchored by the Fair Packaging and Labeling Act (15 U.S.C. Chapter 39) and its implementing FTC regulations (16 CFR Parts 500-503), which shape mandatory net contents statements, identity declarations, and related formatting expectations across consumer packaged goods. Alongside federal baselines, policy momentum is moving toward tighter governance of environmental marketing claims. H.R. 6832, introduced in December 2025, proposes national requirements for recyclable, compostable, and reusable claims on consumer product packaging, which raises the compliance bar for sustainability statements that often appear on labels.
For regulated end uses, FDA oversight of food-contact materials and packaging chemicals directly affects the coatings, inks, and adhesive selections used in labels. In May 2026, the FDA finalized a systematic post-market assessment process for food additives, color additives, and food contact substances. From March through May 2026, multiple effective Food Contact Notifications covered resins, coatings, and adhesives, reinforcing the need for converter and material-supplier documentation when serving food and beverage programs. Measurement and label uniformity also continue to be shaped through the 2026 edition of NIST Handbook 130, which maintains the Uniform Packaging and Labeling Regulation used by states for weights-and-measures enforcement.
Value Chain Analysis
The value chain starts with upstream inputs such as paper and films, notably PET, plus pressure-sensitive adhesive systems tied to acrylic and hot-melt resins. These feed into inks, coatings, and overlaminates that vary by end-use durability and regulatory needs, including low-migration systems for food contact applications. Materials then move to labelstock and specialty-material suppliers, followed by converters that print, coat, laminate, die-cut, and finish labels across flexography, digital (toner/inkjet), and hybrid press lines. Converters ship finished rolls or sheets to brand owners, co-packers, and contract packagers, with logistics and service models increasingly built around short runs and fast replenishment.
Downstream steps include application at filling and packing lines, with distribution through retail, e-commerce fulfillment, and healthcare channels. Variable data and traceability needs influence label design and production scheduling. Within the converter segment, workflow software, inspection systems, and inline finishing are key value-add stages because they determine makeready waste, color repeatability, and turnaround times that brand owners demand, including the 48-hour lead-time programs referenced in the report context. Structural constraints run through multiple points in the chain, including volatile resin and pulp-linked costs and skilled narrow-web labor scarcity. Consolidation among independent converters also increases purchasing leverage for substrates and can standardize qualification and compliance documentation across multi-plant networks.
Competitive Landscape
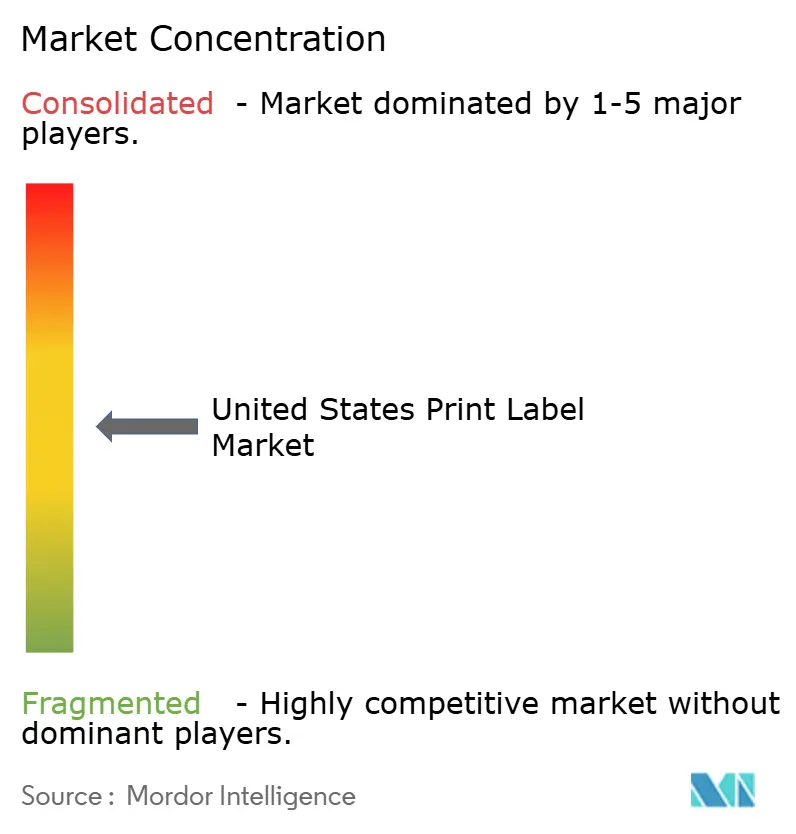
The United States print label industry posts moderate fragmentation. Approximately 2,000 independent converters populate the United States print label market, but the ownership map is shifting as private-equity roll-ups accelerate. Fortis Solutions, Resource Label Group, and Brook and Whittle alone closed more than 20 acquisitions since 2024, typically targeting family-owned shops with USD 10 million-USD 50 million in sales to build national footprints. Their combined share rose beyond 12% in 2025, forcing regional independents to consider specialty niches, geographic alliances, or outright sale. Valuation multiples climbed because strategic buyers prize converters that already run digital presses, hold pharmaceutical serialization certifications, or possess sustainability credentials aligned with EPR mandates. As scale increases, large platforms negotiate sharper substrate discounts, hedge resin exposure, and secure priority film allocations during supply crunches.
Technology adoption widens the performance gap between consolidators and stand-alone plants. Leading groups deploy end-to-end Job Definition Format workflows that integrate estimating, scheduling, color management, and inline inspection, shaving hours off makeready and enabling 48-hour ship windows demanded by e-commerce brands. They also invest in predictive-maintenance sensors and automated turret rewinders that raise uptime on both flexo and digital lines, an expense many independents cannot justify. Smaller converters typically defend share by offering ultra-responsive service to local accounts, low-volume prototype runs, or boutique embellishments such as tactile varnishes and holographic foils. Yet even those competitive moats narrow as roll-ups acquire specialty shops and standardize their processes across a multi-plant network, bringing premium finishes to a broader customer base.
Material science and smart-label integration now serve as key differentiators for growth-minded players. Avery Dennison’s CleanFlake adhesive portfolio, recognized by the Association of Plastic Recyclers, helps converters win beverage contracts that must hit rPET usage targets without compromising bottle clarity. RFID and near-field-communication inlays dropped below USD 0.05 per tag in high-volume orders, encouraging grocery and general-merchandise retailers to embed item-level intelligence that reduces shrink and supports frictionless checkout. Converters able to laminate antennas inline or insert chips during press runs capture higher value per square meter than competitors offering only printed graphics. As a result, competitive intensity will continue to hinge on the ability to pair capital scale with specialized functionality, keeping market concentration moderate even as the biggest groups enlarge their footprints.
United States Print Label Industry Leaders
-
Avery Dennison Corporation
-
Multi-Color Corporation
-
AWT Labels & Packaging
-
Taylor Corporation
-
CCL Industries Inc.
- *Disclaimer: Major Players sorted in no particular order
Market Opportunities and Future Outlook
The clearest whitespace is where compliance and data-rich labeling increase SKU complexity and push brands toward variable-data, short-run production. Healthcare and pharmaceutical labeling continues to pull demand toward high-integrity pressure-sensitive constructions and booklets that carry lot, expiration, and serialization information. DSCSA milestones, including the November 2024 requirements referenced in the report context, keep variable printing and inspection capability as a differentiator for converters. Another opportunity is the sustainability-linked shift in specifications: state EPR programs and recyclability scorecards are accelerating adoption of wash-off adhesives and mono-material label constructions, creating room for converters and material suppliers that can validate performance under recycler-recognized protocols.
Technology-driven opportunity areas include smart and connected labels (RFID and QR) and broader digital press adoption as brands seek rapid versioning and late-stage customization. On the supply side, capacity and footprint actions in 2026 point to continued investment in packaging-related manufacturing closer to demand centers. For example, Quad announced a new 100,000-square-foot packaging manufacturing facility in Salt Lake City, Utah, with operations targeted for Q4 2026, supporting faster regional service and adding competitive pressure on turnaround-time expectations. Converters that integrate RFID capabilities, automated finishing and inspection, and traceable material documentation are positioned to win higher-value programs where compliance, waste reduction, and data functionality intersect.
Recent Industry Developments
- May 2026: Multi-Color Corporation completed its comprehensive financial restructuring and emerged from a prepackaged Chapter 11 process. The transaction reduced net debt by about USD 3.8 billion and extended maturities, changing the companys capacity to fund digital press upgrades and sustainable-substrate programs that influence competitive intensity in U.S. labels.
- April 2026: AWT Labels and Packaging transitioned American Label Technologies to the AWT RFID Label Technology brand. The move consolidated its identity around RFID-enabled labels and supports broader commercialization of smart-label programs for healthcare, engineered, and consumer applications.
- December 2025: Inovar Packaging Group acquired Enterprise Marking Products to add flexographic capacity for industrial and automotive labeling needs. The deal expanded Inovars footprint in durable label categories where performance specifications and qualification requirements can raise switching costs for customers.
Research Methodology Framework and Report Scope
Market Definition and Coverage
For this study, the United States print label market is counted as the value of printed labels used on products and packaging, including labels made from paper and films, and labels printed using analog and digital processes for commercial use.
Scope exclusions: We exclude standalone label application machinery, general packaging that is not a label format, and pure design or prepress services when they are sold as separate services.
Segmentation Overview
- By Substrate Material
- Paper and Paperboard
- Polyethylene Terephthalate (PET)
- Polypropylene (PP and BOPP)
- Polyvinyl Chloride (PVC)
- Biobased and Compostable Films
- Other Substrate Materials
- By Print Technology
- Offset
- Flexography
- Screen
- Digital Printing
- Other Print Technologies
- By Label Type
- Wet-glued Labels
- Pressure-Sensitive Labels
- Liner-less Labels
- In-mold Labels
- Shrink Sleeve Labels
- Other Label Types
- By End-user Industry
- Food
- Beverage
- Healthcare and Pharmaceutical
- Cosmetics and Personal Care
- Industrial
- Other End-user Industries
Data Sources, Market Sizing, and Validation
Desk Research
Desk work started with public datasets that track packaging demand and industrial activity, and then we mapped them to label use where the linkage is clear. Sources used for building and checking assumptions included, such as U.S. Census Bureau manufacturing data, Bureau of Labor Statistics producer price indexes, the U.S. International Trade Commission data portal for trade signals, and EPA materials and recycling publications.
We also reviewed technical and market context from sources such as academic journals on printing and packaging materials, patent databases for label and adhesive innovation themes, and industry association publications that discuss pressure sensitive and sleeve label usage. Company filings, investor presentations, and reputable press were used to understand capacity additions, plant moves, pricing commentary, and end use exposure. We also referenced approved paid subscriptions for company financials and for shipment level import and export checks where public series were not detailed enough. The sources listed here are illustrative only, and we used additional public and paid references to collect, validate, and clarify inputs.
Primary Interviews and Surveys
Primary work focused on validating the demand pool and the pricing logic for printed labels across major end users in the United States, including food, beverage, healthcare, personal care, and industrial products. We used expert interviews and structured surveys with converters, raw material participants, and packaging buyers to confirm substrate mix shifts, run length trends (including short runs), and the practical impact of compliance labeling requirements on volumes and label formats.
Distribution of primary research fieldwork respondents
| Company type | Respondent position |
|---|---|
| Top tier: 35% | CXOs: 13% |
| Mid tier: 47% | Functional/Unit leaders: 30% |
| Smaller Players: 18% | Managers: 57% |
Market-Sizing & Forecasting
Sizing was built using a top-down and bottom-up approach, where the top-down view reconstructs the label demand pool from packaging output and end user production signals, and then converts that into value using price and mix assumptions. In practice, we tied the model to the U.S. consumption base by end use, and then applied a realistic split by label format and substrate so the totals stay aligned with how labels are actually purchased.
To keep the model grounded, we used practical inputs that directly move market value. These included packaged food and beverage production trends, shipment activity linked to e-commerce and logistics labels, substrate mix movement between paper and common films, changes in digital printing adoption for short runs, and typical price movement indicators for paper, films, and key adhesive related inputs. Where data was not available at a clean cut, we used gap handling by applying conservative ranges and then narrowing them using channel checks with interviewees.
Forecasts were produced using scenario analysis supported by trend lines from the historical series, and then adjusted based on what industry participants expect for pricing, sustainability-driven material changes, and end market demand. The final numbers were also cross checked with selective bottom-up approximations like sampled converter revenue roll ups and volume times average selling price checks so the outputs do not rely on a single method.
Data Validation & Update Cycle
Validation was handled in steps so the final outputs stay consistent with real world signals. We compared model results against independent indicators like packaging production movement, pricing index direction, and trade related inputs that can hint at substrate availability, and then investigated any sharp variances before sign-off.
Assumptions were reviewed across analysts, and interview follow-ups were triggered when large gaps appeared between desk findings and what participants were seeing in orders or pricing. Reports are refreshed annually, and interim updates are done when there are material events such as major capacity changes, demand shocks in key end markets, or unusual price swings. Before delivery, the model receives a fresh pass so clients get the latest updated view.
Mordor Intelligence's United States Print Label Market Estimate Compared With Other Published Estimates
Published market values for U.S. print labels can vary because the scope line is not always consistent, and because price and mix assumptions move the total quickly. Differences also come from whether a source is counting only printed label stock, or whether it folds in adjacent labeling solutions and services.
By tracking substrate mix and average selling price movement across key label formats, and then rechecking boundaries with interviews, Mordor Intelligence keeps the market total tied to printed label value rather than a wider labels and packaging bucket.
Benchmark comparison
| Source | Market Size | Gaps in Research Methodology |
|---|---|---|
| Mordor Intelligence | USD 9.15 B (2025) | |
| Industry Study A | USD 20.60 B (2025) | This estimate appears to address the broader U.S. labels market, which can include non-print label types and a wider set of applications beyond print label formats, thereby lifting the total versus a print-only boundary. |
| Industry Bulletin B | USD 15.42 B (2024) | The number is presented as a USA labels total and likely blends multiple label categories and use cases, and it may use different price-year assumptions and currency timing, which can shift the reported value year to year. |
The spread in the table is mainly explained by category boundaries and by how price and mix are handled for paper versus film labels. When the scope is kept to printed labels and the pricing logic is refreshed using clear indicators, the outcome becomes easier to trace and repeat for planning.
Key Questions Answered in the Report
How fast is digital printing growing inside the United States print label market?
Digital printing is forecast to advance at a 3.21% CAGR through 2031 as brand owners request short runs and variable data.
Which substrate commands the largest revenue share today?
PET leads with a 37.83% revenue share because of its clarity, stability, and recycling compatibility.
Why are linerless labels gaining traction?
Retailers and logistics carriers adopt linerless rolls to cut label waste by up to 40% and extend run length between applicator changeovers.
What is driving label demand in healthcare and pharmaceuticals?
Serialization under the Drug Supply Chain Security Act and biologics cold-chain growth lift healthcare label demand at a 3.45% CAGR.
How fragmented is the converter landscape?
About 2,000 independent converters exist, yet recent private-equity roll-ups have pushed the top three players to roughly 12% combined share.
Which U.S. regions show the strongest growth?
The Southeast and Texas lead growth due to reshored manufacturing and e-commerce fulfillment center expansion.