
Market Overview
| Study Period | 2021 - 2031 |
|---|---|
| Forecast Data Period | 2026 - 2031 |
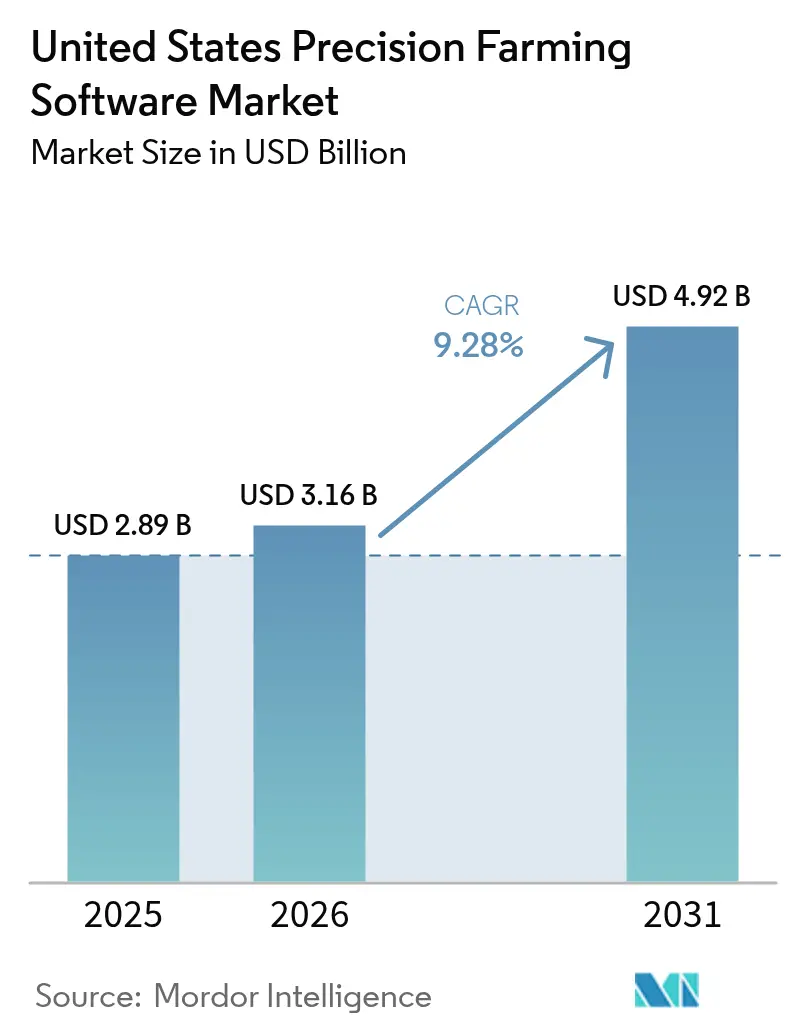
| Base Year Market Size (2025) | USD 2.89 Billion |
| Market Size (2026) | USD 3.16 Billion |
| Market Size (2031) | USD 4.92 Billion |
| Growth Rate (2026 - 2031) | 9.28 % |
| Market Concentration | Medium |
Major Players *Disclaimer: Major Players sorted in no particular order Image © Mordor Intelligence. Reuse requires attribution under CC BY 4.0. | |
United States Precision Farming Software Market Analysis by Mordor Intelligence
The United States precision farming software market size was valued at USD 2.89 billion in 2025 and estimated to grow from USD 3.16 billion in 2026 to reach USD 4.92 billion by 2031, at a CAGR of 9.28% during the forecast period (2026-2031). Strong momentum stems from the digitalization of farming practices as operators respond to persistent labor shortages, new climate-smart incentive programs, and expanding rural broadband coverage. Cloud-based platforms, already accounting for most installations, continue to benefit from faster networks that support real-time analytics. Integrated decision-support suites are displacing single-purpose tools because they merge field data, agronomic models, and regulatory reporting into one environment. Meanwhile, artificial intelligence augments software value by raising yield predictions and improving return-on-investment visibility, especially for specialty-crop growers.
Key Report Takeaways
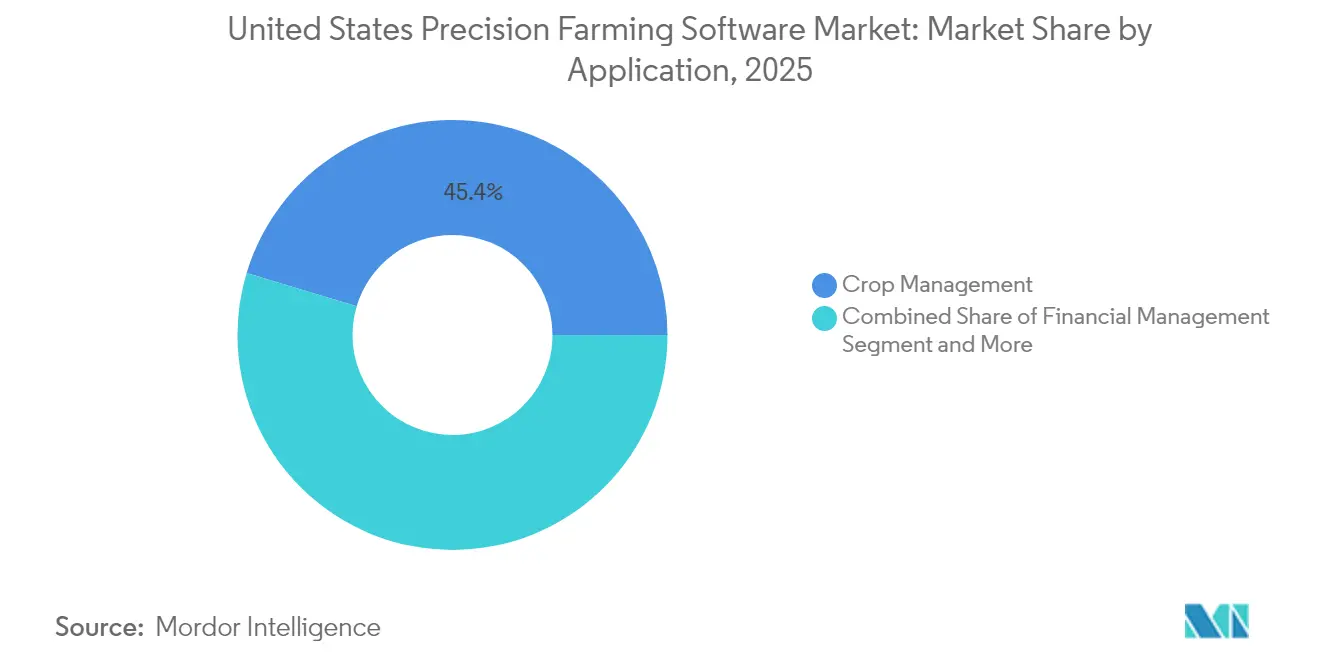
- By application, crop management captured 45.35% of the United States precision farming software market share in 2025, while weather tracking and forecasting is advancing at a 11.35% CAGR through 2031.
- By deployment type, cloud platforms commanded a 60.25% share of the United States precision farming software market size and are growing at an 11.02% CAGR.
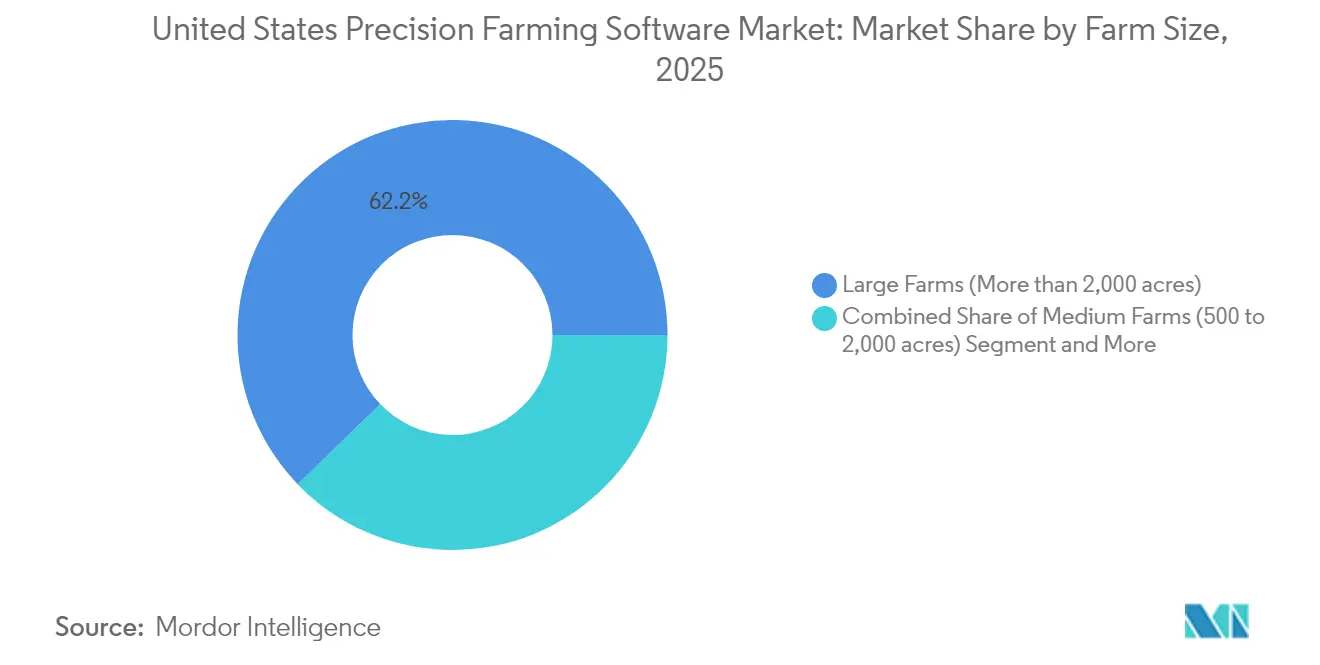
- By farm size, operations larger than 2,000 acres held 62.20% of the United States precision farming software market size in 2025, while the 500–2,000 acre cohort is climbing at a 11.56% CAGR.
- By end-user, row-crop producers controlled 68.10% share of the United States precision farming software market size in 2025, whereas specialty-crop growers represent the fastest rise at 12.78%.
Note: Market size and forecast figures in this report are generated using Mordor Intelligence’s proprietary estimation framework, updated with the latest available data and insights as of 2026.
United States Precision Farming Software Market Trends and Insights
Drivers Impact Analysis*
| Driver | (~) % Impact on CAGR Forecast | Geographic Relevance | Impact Timeline |
|---|---|---|---|
| Farm-labor scarcity and rising average farm size | +2.8% | Global, with the highest impact in North America and Europe | Medium term (2-4 years) |
| Federal cost-share programs for digital tools | +2.1% | North America, with spillover to the European Union through similar programs | Short term (≤ 2 years) |
| Expanding cloud connectivity in rural broadband | +1.9% | Global, with early gains in the Midwest, West, and South regions | Medium term (2-4 years) |
| AI-driven agronomy improving ROI visibility | +1.6% | Global, with advanced adoption in large-scale operations | Long term (≥ 4 years) |
| Carbon-credit revenue models for data-rich farms | +0.8% | North America and the European Union, with emerging opportunities in Asia-Pacific | Long term (≥ 4 years) |
| OEM–software vendor JV activity | +0.6% | Global, concentrated in major agricultural equipment markets | Medium term (2-4 years) |
| Source: Mordor Intelligence | |||
Farm-Labor Scarcity and Rising Average Farm Size
Consolidation into larger holdings amplifies these pressures because covering wider acreages intensifies demand for software that synchronizes field operations, labor scheduling, and inventory flows. Medium-scale farms are the most responsive, posting 12.2% CAGR adoption as they strive to match the efficiency of larger peers. Consequently, the United States precision farming software market increasingly targets features that reduce idle equipment time, streamline input allocation, and substitute scarce human labor. These dynamics position workflow automation and fleet coordination modules as core upgrade priorities over the next two planning cycles.
Federal Cost-Share Programs for Digital Tools
Application volume surged to 156,485 in fiscal 2024, signaling unmet demand that is likely to expand program breadth. These incentives stimulate early upgrades to cloud-based packages that capture granular field data needed for compliance reporting. Although funding does not fully cover backlog demand, its continuity reassures lenders and stimulates longer-term financing for integrated platforms. Consequently, the United States precision farming software market experiences a virtuous cycle wherein cost-share capital catalyzes private investment in sensors, connectivity, and subscription services.
Expanding Cloud Connectivity in Rural Broadband
The USDA ReConnect Program has awarded USD 5.55 billion to deliver a minimum of 100 Mbps symmetrical speeds to underserved communities, directly enabling software that depends on continuous telemetry[1]Source: U.S. Department of Agriculture, “ReConnect Loan and Grant Program Awards,” usda.gov. Connectivity upgrades explain why cloud deployments own a 61% share and sustain an 11.5% CAGR, as farmers increasingly prefer platforms accessible on any device. Weather-tracking modules derive a special advantage because low-latency data exchange ensures that frost, drought, or hail advisories instantly trigger software-generated task lists.
AI-Driven Agronomy Improving ROI Visibility
McKinsey projects that artificial intelligence could unlock USD 100 billion in on-farm gains and another USD 150 billion at the enterprise level by minimizing input waste and elevating output quality. Bayer’s E.L.Y. model lifts query-handling accuracy by 40% and saves staff four hours weekly, demonstrating tangible time and cost savings. Specialty-crop operators, whose per-acre margins justify premium analytics, achieve faster paybacks on investment, propelling that segment’s 13.4% CAGR. These successes strengthen the business case for predictive modules, encouraging broader uptake across the United States precision farming software market even among row-crop producers.
Restraints Impact Analysis*
| Restraint | (~) % Impact on CAGR Forecast | Geographic Relevance | Impact Timeline |
|---|---|---|---|
| High upfront cost and unclear short-term payback | -1.8% | Global, with the highest impact on small and medium farms | Short term (≤ 2 years) |
| Data ownership and privacy concerns | -1.2% | Global, with heightened concerns in North America and the European Union | Medium term (2-4 years) |
| Integration complexity across heterogeneous machinery | -0.9% | Global, particularly affecting mixed-equipment operations | Medium term (2-4 years) |
| Digital skills gap among aging farm operators | -0.7% | Global, with regional variations in demographic profiles | Long term (≥ 4 years) |
| Source: Mordor Intelligence | |||
High Upfront Cost and Unclear Short-Term Payback
Iowa surveys show 74% of growers label precision technologies expensive, even while acknowledging efficiency benefits, indicating hesitancy to invest absent guaranteed returns. Fragmented hardware ecosystems often force multiple, uncoordinated purchases that lengthen payback periods. Although large farms (>2,000 acres) shoulder these costs more easily and now hold 63% market share, smaller holdings still delay upgrades unless subsidies defray capital expense.
Data Ownership and Privacy Concerns
World Bank studies find growers reluctant to transmit detailed operational records to third parties without contractual safeguards, fearing competitive leakage or unfair monetization. Emerging interoperability standards from the Agricultural Industry Electronics Foundation grant users more control, but mainstream implementation is nascent. Until frameworks mature, privacy concerns will continue constraining some investment in the United States precision farming software market, especially among operators with high-value proprietary genetics or niche production methods.
*Our forecasts treat driver/restraint impacts as directional, not additive. The impact forecasts reflect baseline growth, mix effects, and variable interactions.
Segment Analysis
By Application: Crop Management Dominance Drives Platform Integration
Crop management solutions controlled 45.35% of the United States precision farming software market share in 2025, underscoring their status as the operating hub for seeding, fertilization, and harvest decisions. The United States precision farming software market size attributed to crop management is projected to expand alongside advanced imaging, sensor fusion, and rate-variable application features. Adding financial and compliance modules converts point solutions into holistic suites that appeal to diversified operations.
Weather-tracking applications, rising at a 11.35% CAGR, exploit high-resolution radar and machine-learning models that predict micro-climate shifts affecting planting windows. Their success illustrates the shift to microservices architecture, where specialized functions bolt onto an overarching platform via open APIs.


By Deployment Type: Cloud Infrastructure Transforms Rural Operations
Cloud offerings accounted for 60.25% of the United States precision farming software market in 2025 because of remote access, automatic updates, and lower upfront hardware outlays. The United States precision farming software market size for cloud deployments is primed for an 11.02% CAGR as rural fiber installations alleviate coverage gaps. Early adopters cite seamless multi-device collaboration, enabling agronomists, equipment operators, and accountants to share one data source as the principal advantage.
Offline-sync capabilities still matter in fringe signal zones, so hybrid configurations combining cloud cores with edge gateways remain popular. Providers differentiate by embedding cybersecurity protocols and contract clauses that guarantee data portability on termination, easing vendor-lock fears. As machine telemetry volumes escalate, pay-per-use storage and compute models will further shift costs from capital to operating expenditure, sustaining cloud momentum within the United States precision farming software market.
By Farm Size: Medium Operations Drive Technology Adoption Growth
Operations larger than 2,000 acres retained 62.20% of the United States precision farming software market in 2025, reflecting their capacity to amortize system costs over extensive acreage. Yet the 500–2,000 acre bracket now posts a 11.56% CAGR, signaling accelerated democratization of digital tools. Autosteering and variable-rate technologies penetrated 52% of midsize operations in 2023, compared with single-digit levels two decades earlier.
Government cost-share grants offset as much as 75% of subscription and hardware expenses, narrowing adoption gaps between midsize and large farms. Equipment vendors like John Deere earmarked USD 20 billion in U.S. investments to develop autonomous solutions tailored for this segment, providing a retrofit pathway that sidesteps large machinery purchases.
By End-User: Specialty Crops Lead Innovation Adoption
Row-crop growers commanded 68.10% of the United States precision farming software market size in 2025 because of vast corn, soybean, and wheat acreages USDA. The specialty-crop enterprises from orchards to vineyards register a blistering 12.78% CAGR as per-acre value grants faster paybacks on precision tools. AI-enabled vision systems from Orchard Robotics can estimate fruit counts and detect disease at the tree level, cutting manual scouting costs while improving quality grades.
Equipment innovation echoes this trend. John Deere’s autonomous 5ML tractor targets orchard spray operations, integrating seamlessly with cloud dashboards that document chemical usage for export compliance. As these high-margin segments refine analytics and autonomous workflows, lessons learned will diffuse to row-crop operations, thereby elevating feature expectations across the United States precision farming software market.
Geography Analysis
The Midwest retained a significant share of the United States precision farming software market revenue in 2025, anchored by large corn and soybean enterprises that historically adopt guidance and rate-control tools first. Ample dealer networks and manufacturer partnerships accelerate product support, while EQIP grants funnel significant climate-smart funds into conservation-oriented digital upgrades. Although the regional CAGR moderates compared with emerging areas, ongoing consolidation and generational turnover sustain steady license renewals and platform expansions.
The West is experiencing remarkable growth in the precision farming software market, driven by the unique demands of high-value specialty crops. These crops require meticulous management of resources such as water, nutrients, and labor, prompting farmers to adopt advanced monitoring and control technologies. The region's ongoing challenges with water scarcity have further accelerated the adoption of solutions that track evapotranspiration and automate irrigation processes. Additionally, infrastructure projects under USDA ReConnect are addressing long-standing connectivity issues in states like North Dakota, South Dakota, and Alaska by expanding fiber networks. This improved broadband access is enabling real-time decision-making capabilities, which were previously limited due to connectivity gaps. As more counties gain access to reliable internet, software providers are prioritizing the West for pilot programs featuring AI-driven irrigation advisory tools. This approach strengthens the connection between technological advancements and the evolving needs of farmers, fostering greater adoption of precision farming solutions.
Southern and Northeastern states show more measured expansion but benefit from crop diversity and proximity to ag-tech research clusters. Cotton and rice growers in the South increasingly adopt variable-rate nitrogen modules to comply with water-quality standards, while Northeast dairy producers combine herd-management data with agronomic records to benchmark environmental footprints.
Regulatory Landscape
The United States policy environment for precision farming software is being shaped by federal actions focused on climate-smart agriculture, connectivity, and fit-for-purpose validation of agricultural technologies. In April 2026, USDA announced the creation of the USDA National Proving Grounds Network (NPG-Ag) to evaluate agricultural technologies under real-world U.S. farm and ranch conditions. This move reinforces demand for software workflows that can document performance, data lineage, and outcomes in standardized field settings. In June 2026, a White House presidential action on advancing regenerative agriculture and strengthening farm resilience further elevated attention to measurement and reporting, supporting continued adoption of digital recordkeeping and decision-support software aligned with conservation outcomes.
On standards and infrastructure, Congress and federal agencies are addressing interoperability and connectivity bottlenecks that directly affect cloud deployments and mixed-fleet operations. S. 507 directs USDA, in consultation with NIST and the FCC, to develop voluntary, consensus-based, private sector-led interconnectivity standards for precision agriculture, which favors API-first platforms and data portability features across vendors. Separately, H.R. 1618 (Precision Agriculture Satellite Connectivity Act), introduced in February 2025, requires the FCC to review relevant satellite service rules to promote precision agriculture connectivity. It complements USDA broadband programs that support real-time telemetry and analytics in underserved rural areas.
Competitive Landscape
Competitive intensity is moderately concentrated because no single vendor controls even one-fifth of total revenue, creating room for both conglomerates and start-ups to expand. John Deere leverages strong hardware entrenchment by embedding the Operations Center into every new machine and augmenting it with Sentera’s aerial imaging after the 2025 acquisition. The firm’s USD 20 billion domestic investment pledge underscores a long-range commitment to integrated autonomy and cloud ecosystems.
AGCO formed a USD 2 billion joint venture with Trimble Ag that marries retrofit autonomy kits with mixed-fleet compatibility, positioning the alliance to capture customers who operate equipment from multiple brands. Bayer’s E.L.Y. model showcases how input suppliers extend beyond agronomy services into full-stack decision engines, backed by partnerships such as Azure Data Manager for Agriculture that streamline data interoperability with Microsoft[3]Source: Bayer, “E.L.Y. Generative AI Model Announcement,” bayer.com. New entrants focus on micro-niches, like SWAT VEXA for watershed modeling, before expanding horizontally across modules, using lower customer acquisition costs driven by SaaS delivery.
Data privacy remains a differentiation lever; several providers now offer farmer-controlled encryption keys and explicit data-use clauses to gain the trust of hesitant prospects. Training programs and simplified mobile interfaces tackle the skills gap, an area where only 25% of producers report full digital confidence. As acquisitions concentrate technology under fewer corporate umbrellas, the United States precision farming software market still rewards nimble innovators that solve narrow pain points and then scale through API-first integration.
United States Precision Farming Software Industry Leaders
Corteva Agriscience
Deere & Company
Kubota Corporation
Bayer AG
AGCO Corporation
- *Disclaimer: Major Players sorted in no particular order


Market Opportunities and Future Outlook
A key opportunity centers on reducing workflow friction between major farm platforms and third-party agronomy, imaging, and prescription tools, particularly since crop management remains the primary software hub in the United States. In February 2026, Bayer and John Deere expanded workflow integration to support wireless transfer of FieldView prescriptions into John Deere Operations Center. In January 2026, Ceres AI renewed and enhanced its integration with Operations Center to combine high-resolution imagery with machine data. These steps create room for vendors that package interoperability, automated recordkeeping, and audit-ready reporting across mixed data sources, including financial and compliance modules that convert point tools into integrated decision-support suites.
Connectivity and AI-enabled field intelligence also support differentiated software subscriptions, especially where broadband gaps persist and specialty-crop operations need higher granularity. In May 2026, John Deere confirmed a strategic partnership with Starlink to support satellite connectivity for equipment workflows, reinforcing the practical value of cloud-native platforms that can operate beyond terrestrial coverage. Cooperative-led deployments further show demand for AI mapping outputs that feed farm execution systems: in April 2026, Five Star Cooperative partnered with TerraClear to deliver AI-powered rock and weed mapping across 110,000 acres. The case highlights paying use of software that turns imagery and sensor inputs into actionable prescriptions, task lists, and variable-rate application guidance.
Recent Industry Developments
- July 2026: Deere & Company highlighted scaled usage of precision workflows, including See and Spray deployed across 5 million acres and John Deere Operations Center reaching nearly 440,000 monthly active users. The disclosure reinforces the installed-base advantage of integrated software ecosystems and increases competitive pressure on independent platforms to match data ingestion, analytics, and in-season execution features.
- June 2026: Leaf Agriculture announced a USD 13 million Series B round co-led by Leaps by Bayer to expand its unified farm data layer. The funding supports infrastructure that normalizes and connects fragmented agricultural datasets, improving the ability of precision farming software providers to deliver interoperable analytics and cross-platform automation.
- November 2024: Bayer launched the E.L.Y. generative AI model to improve agronomic query handling, reporting a 40% lift in accuracy and saving staff four hours per week. The release accelerated the shift toward embedded AI assistance inside agronomy and farm-management software, strengthening demand for platforms that pair recommendations with traceable field and compliance records.


Research Methodology Framework and Report Scope
Market Definition and Coverage
This market is counted as revenue earned from software used by US growers and farm operators to plan, monitor, and optimize field activities using digital tools, including farm management, mapping, analytics, and decision support delivered through cloud or on-premise setups.
Scope exclusions: Hardware and field devices (such as GNSS receivers, drones, and variable-rate controllers) and non-software services are excluded from the revenue total.
Segmentation Overview
- By Application
- Crop Management
- Financial Management
- Farm Inventory Management
- Personnel Management
- Weather Tracking and Forecasting
- Other Applications
- By Deployment Type
- Local/Web-based
- Cloud-based
- By Farm Size
- Small (Less than 500 acres)
- Medium (500 to 2,000 acres)
- Large (More than 2,000 acres)
- By End-User
- Row-crop Growers
- Specialty-crop Growers
- Livestock and Mixed Operations
Data Sources, Market Sizing, and Validation
Desk Research
Desk research was used to build a clean fact base on US agriculture activity and the software adoption environment before any modeling decisions were finalized. We reviewed public sources such as USDA Census of Agriculture and NASS data series, FCC broadband availability updates, USITC trade summaries where relevant for related equipment context, and peer-reviewed agronomy and precision-ag studies that report adoption patterns and measured outcomes.
We also used company filings, investor presentations, earnings call notes, association publications, and trusted agriculture press to map the commercial picture and understand packaging practices like per-acre subscriptions, bundled offerings, and dealer-led selling. Select paid subscriptions were used for company financials and intelligence, patent lookups, and news tracking so that product scope changes and M&A were not missed. These desk sources are illustrative only, and we also checked other public and paid references for data collection, validation, and clarification.
Primary Interviews and Surveys
Primary work focused on converting broad adoption narratives into usable inputs, especially the pricing logic and the split between subscriptions, licenses, and bundled software in farm technology stacks. We spoke with software-focused providers, ag retailers and channel partners, and farm-side users across major US cropping regions so assumptions around acreage coverage, renewal behavior, and feature penetration could be stress-tested.
Distribution of primary research fieldwork respondents
| Company type | Respondent position |
|---|---|
| Top tier: 29% | CXOs: 16% |
| Mid tier: 52% | Functional/Unit leaders: 30% |
| Smaller Players: 19% | Managers: 54% |
Market-Sizing & Forecasting
Sizing starts with a top-down build where planted acreage and crop mix are translated into a realistic addressable demand pool using precision-software adoption rates and typical paid acres per customer. Those totals are then converted into revenue using observed pricing constructs like per-acre subscriptions, per-seat licenses for farm staff, and module-based pricing for analytics and compliance reporting.
To keep the outcome grounded, we corroborated totals with selective bottom-up approximations from a sampled set of supplier revenues, channel feedback on deal sizes, and common price points matched to estimated acres under management. When vendor disclosure was incomplete, gaps were handled through peer benchmarking by product category and by normalizing to active-customer indicators shared in interviews.
Forecasting used scenario analysis, supported by a light multivariate regression check, because demand tends to move with a few visible drivers. Inputs tracked include US farm acreage and crop price expectations, broadband reach in rural counties, equipment modernization rates that enable data capture, cost pressure on labor that drives automation, and the pace of integration between farm management and agronomy advisory workflows. Price progression assumptions were kept conservative and were adjusted based on expected shifts toward bundled suites versus stand-alone tools.
Data Validation & Update Cycle
Validation is done through triangulation across the model, desk signals, and primary feedback so no single source dictates the final number. We run variance checks by comparing implied revenue per managed acre against known pricing bands, and we also check whether the growth path aligns with adoption markers reported by public surveys and extension-led studies.
Before sign-off, the model is reviewed in steps, with anomalies traced back to either an input assumption or a scope interpretation and then corrected. If a large variance is found during review, respondents are re-contacted to confirm whether it reflects a real market shift or a one-off data issue. The report is refreshed annually, with interim updates when material events occur, and a final pass is completed close to delivery so clients receive the latest view.
Mordor Intelligence's United States Precision Farming Software Market Sizing Compared With Other Published Estimates
Published market values for US precision farming software can look far apart because each publisher sets its own scope and conversion steps. The biggest differences usually come from what is counted as software revenue, how bundled offerings are treated, and whether the stated value is tied to paid usage or broader digital farming activity.
In this study, the main gap driver is scope discipline, where hardware, services, and wider precision-ag systems are kept out, and revenue is counted only when software fees are identifiable through pricing logic and validation checks, a choice applied by Mordor Intelligence.
Benchmark comparison
| Source | Market Size | Gaps in Research Methodology |
|---|---|---|
| Mordor Intelligence | USD 2.89 B (2025) | |
| Industry Publisher A | USD 0.47 B (2025) | Often reflects a narrower software definition that may focus on selected farm management and crop modules, and it can exclude bundled software embedded in broader farm technology suites, which reduces the counted revenue pool. |
| Industry Publisher B | USD 63.00 B (2026) | Uses a much wider industry scope that combines systems and services around precision agriculture, so guidance equipment, integration work, and consulting-style revenue can be included alongside software, which inflates totals versus software-only counting. |
The spread in the table is largely explained by what is included in the revenue boundary and how pricing is converted into market value. By tying the model to paid software use signals like managed acres and subscription structures, and by screening out non-software spend, the final number stays traceable to repeatable inputs that can be checked year to year.


Key Questions Answered in the Report
What is the current size of the United States precision farming software market?
The United States precision farming software market is valued at USD 3.16 billion in 2026 and is projected to reach USD 4.92 billion by 2031.
Which segment holds the largest United States precision farming software market share?
Crop management applications lead with 45.35% share in 2025, reflecting their role in guiding planting, fertilization, and harvest activities.
Why are cloud platforms growing so quickly in the United States precision farming software?
Improved rural broadband under the USDA ReConnect Program enables real-time data transfer, driving an 11.02% CAGR for cloud solutions.
How are medium-sized farms influencing market growth?
Farms between 500-2,000 acres show a 11.56% CAGR as cost-share programs and mid-tier subscription models lower adoption barriers.
What role does artificial intelligence play in the United States precision farming software?
AI enhances yield prediction, input optimization, and compliance reporting, with studies estimating USD 100 billion in potential on-farm value creation.
Which United States region is expanding fastest in adopting precision farming software?
The West region records an 11.12% CAGR, driven by specialty-crop operations and new broadband infrastructure that supports cloud-based analytics.
Page last updated on:


 Your data is secure and never sold or shared.


