
Market Overview
| Study Period | 2021 - 2031 |
|---|---|
| Forecast Data Period | 2026 - 2031 |
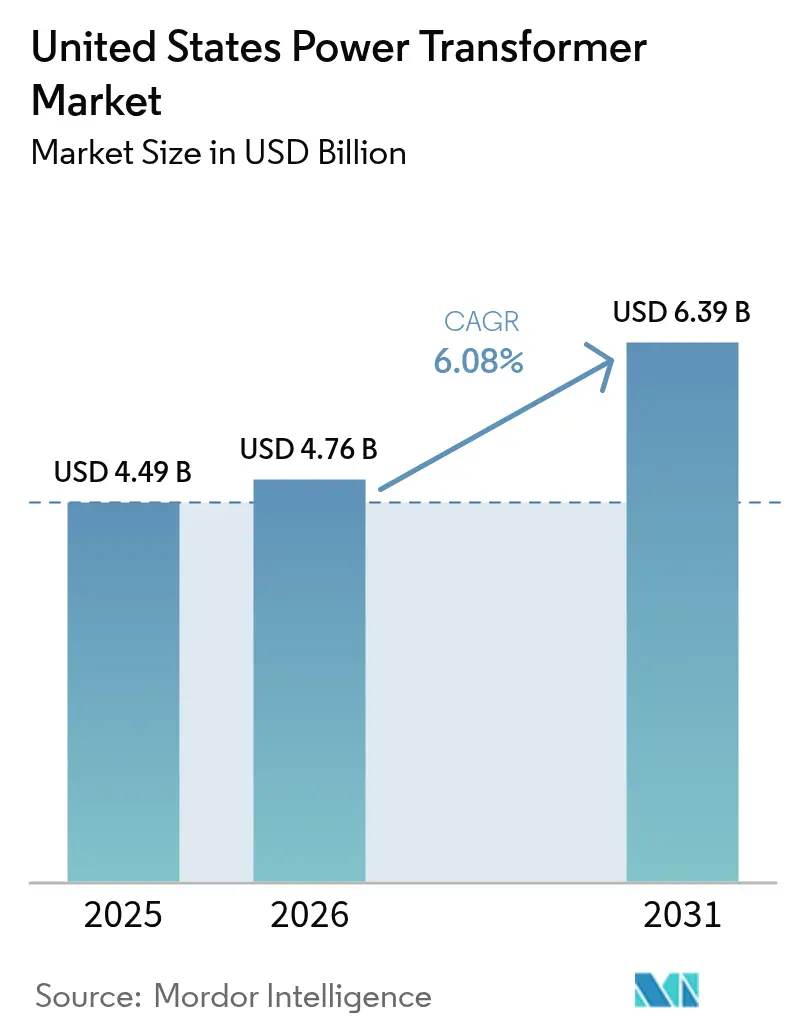
| Base Year Market Size (2025) | USD 4.49 Billion |
| Market Size (2026) | USD 4.76 Billion |
| Market Size (2031) | USD 6.39 Billion |
| Growth Rate (2026 - 2031) | 6.08 % |
| Market Concentration | Medium |
Major Players
*Disclaimer: Major Players sorted in no particular order Image © Mordor Intelligence. Reuse requires attribution under CC BY 4.0. |
|
United States Power Transformer Market Analysis by Mordor Intelligence
The United States Power Transformer Market size was valued at USD 4.49 billion in 2025 and estimated to grow from USD 4.76 billion in 2026 to reach USD 6.39 billion by 2031, at a CAGR of 6.08% during the forecast period (2026-2031).
Vigorous growth stems from the mandatory replacement of aging grid assets, the federal government’s USD 10.5 billion grid modernization outlay, and the explosive build-out of hyperscale data centers that follow the demand for artificial-intelligence computing. More than 70% of the transmission-class fleet exceeds 25 years of service, creating a non-discretionary replacement pipeline that lifts baseline demand for the United States power transformer market.{1] Federal production-tax-credit bonuses linked to domestic content tilt purchasing toward U.S. factories, unleashing over USD 2 billion in announced capacity additions and shortening delivery lead times. Simultaneously, renewable-energy interconnections, heavy-transport electrification, and tighter efficiency standards raise specification complexity, allowing manufacturers to capture higher average selling prices. Currently, domestic plants supply only 20% of large-unit requirements, and quotations indicate lead times of 115 to 130 weeks, underscoring the persistent supply gap in the United States power transformer market.[2]
Key Report Takeaways
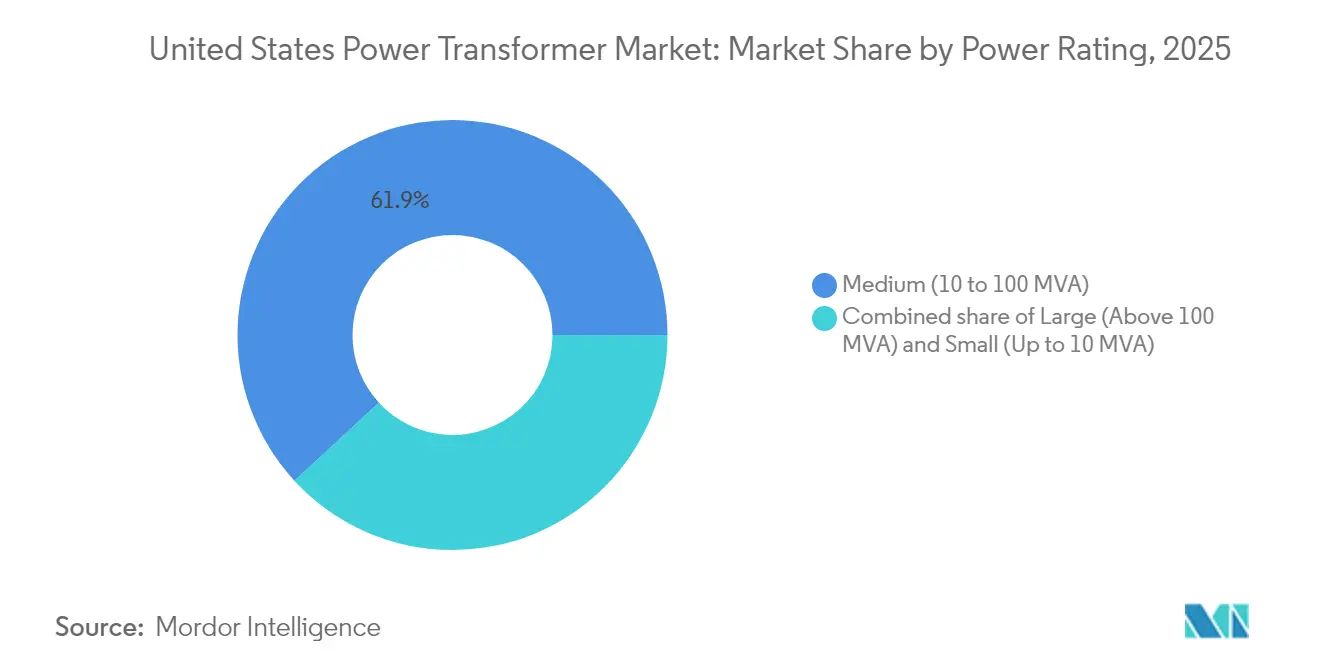
- By power rating, medium-capacity units (10-100 MVA) held 61.85% of the United States power transformer market share in 2025, while the same segment is projected to expand at a 6.95% CAGR through 2031.
- By cooling type, oil-cooled equipment dominated the United States power transformer market with a 76.55% share in 2025; air-cooled designs are expected to record the fastest growth at a 6.62% CAGR.
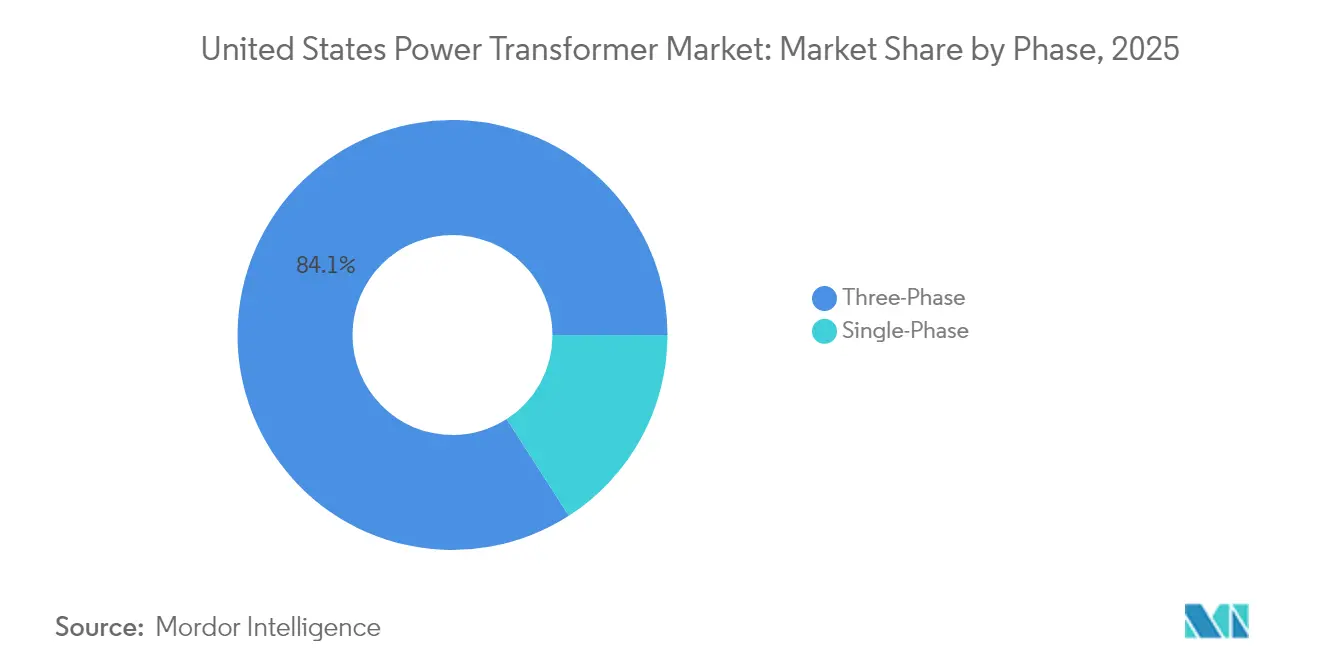
- By phase, three-phase transformers accounted for 84.10% of the United States' power transformer market size in 2025, and single-phase deployments are expected to grow at a 6.18% CAGR through 2031.
- By end user, power utilities led with a 58.35% revenue share in 2025; the segment is forecast to post a robust 6.85% CAGR as grid modernization mandates accelerate replacement cycles.
Note: Market size and forecast figures in this report are generated using Mordor Intelligence’s proprietary estimation framework, updated with the latest available data and insights as of 2026.
United States Power Transformer Market Trends and Insights
Drivers Impact Analysis*
| Driver | (~) % Impact on CAGR Forecast | Geographic Relevance | Impact Timeline |
|---|---|---|---|
| Accelerated replacement of aging grid assets | +1.7% | National, with concentration in Northeast, Midwest legacy grids | Medium term (2-4 years) |
| Surge in renewable energy interconnections | +1.4% | Texas, California, Plains states with high wind/solar capacity | Short term (≤ 2 years) |
| Federal grid-modernization funding (IIJA) | +1.2% | National, prioritizing rural and underserved regions | Medium term (2-4 years) |
| Hyperscale data-center build-out | +1.0% | Virginia, Texas, North Carolina, Oregon data center hubs | Short term (≤ 2 years) |
| Heavy-transport electrification projects | +0.8% | California, Northeast corridor, major freight routes | Long term (≥ 4 years) |
| Domestic-content incentives under IRA | +0.6% | National, with manufacturing concentration in Southeast | Medium term (2-4 years) |
| Source: Mordor Intelligence | |||
Accelerated Replacement of Aging Grid Assets
Four-decade-old transformers now dominate many regional networks, creating a reliability gap as failure rates approach 0.5% of the installed base annually. DOE data indicate that 55% of distribution-class units surpass 33 years of age, while transmission-class averages reach 40 years. New efficiency standards effective in 2027 classify many legacy designs as non-compliant, compelling utilities to adopt fleet-wide swap-out programs rather than one-off repairs. Rising electric-load intensity from AI-driven data centers and electric-vehicle charging elevates operational stress on aging machines, compressing the replacement timetable. Consequently, the United States power transformer market gains a predictable floor of baseline demand that cushions against macroeconomic swings.
Surge in Renewable-Energy Interconnections
Utility-scale wind and solar plants require collector transformers that can handle bidirectional power flow, harmonic distortion, and fluctuating load cycling. California ISO’s twenty-year transmission outlook highlights USD 30 billion of projects with advanced monitoring and tap-changing requirements. ERCOT expects 40 GW of incremental load by 2030, largely tied to renewable interconnections that rely on bespoke step-up transformers.[3] Such technical needs reshape specification sheets, allowing suppliers to embed smart-sensor packages and command premium margins inside the United States power transformer market.
Federal Grid-Modernization Funding (IIJA)
The USD 10.5 billion Grid Resilience and Innovation Partnerships program has already disbursed USD 2.2 billion to eight multi-state projects featuring climate-resilient designs. Funding criteria prioritize underserved areas and Justice40 communities, redirecting capital toward regions that have long been neglected by private investment. Awardees must adhere to domestic-content thresholds, giving manufacturers with U.S. plants a wide bidding advantage. Parallel FITT grants fund nine next-generation prototypes, seeding demand for transformers that integrate power electronics, condition-monitoring, and cyber-secure interfaces. This policy cocktail supports a structural uplift in the United States power transformer market.
Hyperscale Data-Center Build-Out
AI training clusters now require tens of megawatts per building, surpassing the loads of legacy data centers. Northern Virginia alone has seen a five-fold increase in power-delivery requests, while Texas utility Oncor has 59 GW of data center demand in its queue. Each campus often orders more than 250 MVA autotransformers, plus N+1 redundancy, thereby doubling the volume per site. Hyperscalers also demand advanced diagnostics and fire-safe cooling media, further enlarging order values in the United States power transformer market.
Restraints Impact Analysis*
| Restraint | (~) % Impact on CAGR Forecast | Geographic Relevance | Impact Timeline |
|---|---|---|---|
| Copper & electrical-steel price volatility | -0.6% | National, with higher impact on cost-sensitive segments | Short term (≤ 2 years) |
| Global core-steel supply-chain bottlenecks | -0.4% | National, affecting all capacity ratings | Medium term (2-4 years) |
| Stricter mineral-oil spill regulations | -0.3% | National, with stricter enforcement in California, Northeast | Long term (≥ 4 years) |
| Emerging solid-state transformer pilots | -0.2% | Regional pilots in smart grid demonstration areas | Long term (≥ 4 years) |
| Source: Mordor Intelligence | |||
Copper & Electrical-Steel Price Volatility
Copper price bands widened 40% year-on-year in 2024, and grain-oriented electrical steel (GOES) quotes have doubled since 2020. Cleveland-Cliffs remains the only domestic GOES smelter, creating a single-supplier pinch point. Price swings complicate bid validity and inflate inventory carrying costs, forcing utilities to pre-purchase or escrow contracts, moves that erode capital budgets earmarked for modernization.
Stricter Mineral-Oil Spill Regulations
EPA SPCC thresholds trigger containment mandates for equipment holding more than 55 gallons of oil.[4] States such as California add even tighter rules, prompting urban substations and data center campuses to favor air-cooled or natural-ester-filled units despite higher acquisition costs. While this regulatory trend spurs innovation, it also dampens demand for traditional mineral-oil models.
*Our forecasts treat driver/restraint impacts as directional, not additive. The impact forecasts reflect baseline growth, mix effects, and variable interactions.
Segment Analysis
By Power Rating: Medium-Capacity Dominance Drives Market Growth
Medium-capacity units (10-100 MVA) captured 61.85% of the United States power transformer market in 2025. Utilities prefer this range because it strikes a balance between factory throughput, shipping weight, and substation footprint. The segment also records the briskest 6.95% CAGR as transmission owners deploy modular substations that can scale capacity by adding identical bays rather than installing single large monoliths. Up-rating feeders from 138 kV to 230 kV often lands in the mid-capacity sweet spot, ensuring repeat orders. Large-capacity machines (over 100 MVA) service 765 kV corridors and hyperscale data center campuses. Demand spikes in Texas, where regulators have just green-lit the state’s inaugural 765 kV lines, stretch the domestic build queue for units exceeding 500 MVA. Small transformers (<10 MVA) hold niche relevance in distributed generation, microgrids, and EV fast-charging plazas. Although volume is high, revenue share remains modest due to lower unit pricing. The United States power transformer market size for mid-capacity equipment is forecast to rise steadily, supported by a fleet-average replacement strategy that favors uniform ratings for easier inventory management.

By Cooling Type: Oil-Cooled Leadership with Air-Cooled Innovation
Oil-cooled designs held 76.55% share of the United States power transformer market in 2025, underpinned by proven thermal performance at high nameplate ratings and comparatively low upfront cost. Mineral-oil systems remain the default for bulk-power interconnection and petrochemical complexes where land is plentiful and spill-containment basins are standard practice. Yet, city-center substations, data-center halls, and offshore wind platforms face stringent fire and environmental rules that benefit air-cooled and natural-ester variants. Air-cooled models log a 6.62% CAGR as utility planners trade off lower power density for simplified permitting. National Electrical Code updates now recognize less-flammable liquids, allowing hybrid solutions that marry forced-oil cooling with fire-inhibited esters. This design innovation bridges the performance gap while maintaining compliance, thereby widening the addressable use cases for non-mineral-oil alternatives. Over the forecast period, the United States power transformer market is expected to see a gradual shift in share toward air-cooled and ester-filled products, particularly in jurisdictions with stringent spill-prevention enforcement.
By Phase: Three-Phase Efficiency Drives Market Leadership
Three-phase equipment dominated 84.10% of the United States power transformer market in 2025. Balanced phase loading minimizes line losses and enables smaller conductor cross-sections, vital for long-haul transmission. Industrial motors, synchronous condensers, and bulk storage inverters also run on three-phase power, reinforcing segment hegemony. Single-phase units nevertheless carve out a niche for resilience, serving rooftop solar arrays, pole-mounted residential feeders, and isolated rural circuits. As EV charging proliferates, some utilities upgrade single-phase circuits to meet 400% load surges during peak home-charging windows. Distribution automation tools such as adaptive volt-var controllers now interface directly with intelligent single-phase transformers, extending asset life and justifying premium pricing. Although share shifts will be incremental, technology convergence ensures that even single-phase offerings embed digital monitors, narrowing the functionality divide within the broader United States power transformer industry.
By End-User: Power Utilities Lead Market Expansion
Power utilities absorbed 58.35% of shipments in 2025 and will expand at a 6.85% CAGR through 2031. Mandated reliability standards, public-policy renewable targets, and congestion-relief projects combine to sustain a multi-billion-dollar buying pipeline. Investor-owned utilities typically embed transformer replacement costs in rate-based filings, whereas cooperatives often utilize federal grants for resilience upgrades. Industrial customers, particularly steel mills and petrochemical complexes, install bespoke high-MVA units, which offer concentrated but lumpy demand. Commercial buyers, led by hyperscale data center developers, now compete with utilities for limited factory slots, prompting some to sign multi-year framework agreements. The residential slice grows as rooftop solar adoption requires bi-directional distribution transformers capable of safe reverse power flow. Across all categories, digital monitoring and predictive-maintenance dashboards become table stakes, further enhancing the value of hardware. Thus, the United States power transformer market continues to shift toward integrated hardware-software solutions that align with advanced grid management paradigms.
Geography Analysis
Texas ranks first in absolute demand for the United States power transformer market, underpinned by ERCOT’s 40 GW load-growth forecast and approvals for 765 kV corridors linking the Permian Basin to Gulf Coast load centers. Fast-track data-center campuses around Dallas–Fort Worth require large blocks of more than 250 MVA capacity, compressing lead-time tolerance and amplifying the pull on domestic production. California follows closely, with the California ISO mapping USD 30 billion of transformer-heavy upgrades to integrate 25 GW of solar, 5 GW of offshore wind, and 3 GW of battery storage. Environmental regulations push the state toward air-cooled or natural-ester units, reshaping vendor scorecards.
The Northeast corridor, home to aging 115 kV and 138 kV networks, focuses on replacement rather than expansion. Utilities here favor plug-and-play smart transformers that minimize outage duration during change-outs, justifying premium prices. Midwestern states combine heavy industrial loads with wind-farm build-outs, sustaining consistent medium-capacity demand. The Southeast emerges as a manufacturing hub, with Siemens Energy in North Carolina, Eaton in South Carolina, and Hitachi Energy in Virginia collectively adding more than 1.5 GW of annual transformer output by 2027, thereby slashing freight-plus-tariff costs for regional buyers.
In the Pacific Northwest, hydropower turbine uprates and the Columbia Basin’s offshore wind corridor necessitate both generator step-up and intertie autotransformers that can withstand wide reactive power swings. Alaska and islanded microgrids in Hawaii illustrate niche geographies that adopt modular, skid-mounted units with Arctic or saline protection packages. Collectively, geographic demand diversity compels suppliers to maintain a flexible product portfolio, reinforcing the structural attractiveness of the United States power transformer market.
Regulatory Landscape
Federal efficiency and security policy are increasingly shaping transformer specifications, procurement timing, and domestic sourcing. The US Department of Energy (DOE) finalized energy conservation standards for distribution transformers in April 2024, with an April 23, 2029 compliance date, pushing OEMs and buyers toward higher-efficiency designs and tighter loss guarantees. In June 2026, DOE issued a Request for Information (RFI) to collect data on how these standards interact with national security concerns, domestic manufacturing capacity, and supply-chain resilience, signaling active rule stewardship as the market balances performance mandates with availability constraints.
Supply-chain policy is also tightening around critical inputs and subassemblies. On April 20, 2026, the White House issued a Presidential determination under the Defense Production Act (DPA) classifying distribution transformers and electrical core steel as industrial resources essential to national defense, elevating federal tools available to expand capacity and address bottlenecks. Trade policy has further affected sourcing, including a 50% tariff applied in August 2025 to imported distribution transformer derivative products such as electrical cores and laminations, reinforcing incentives for US-based manufacturing and reshaping bid competitiveness for imported content.
Competitive Landscape
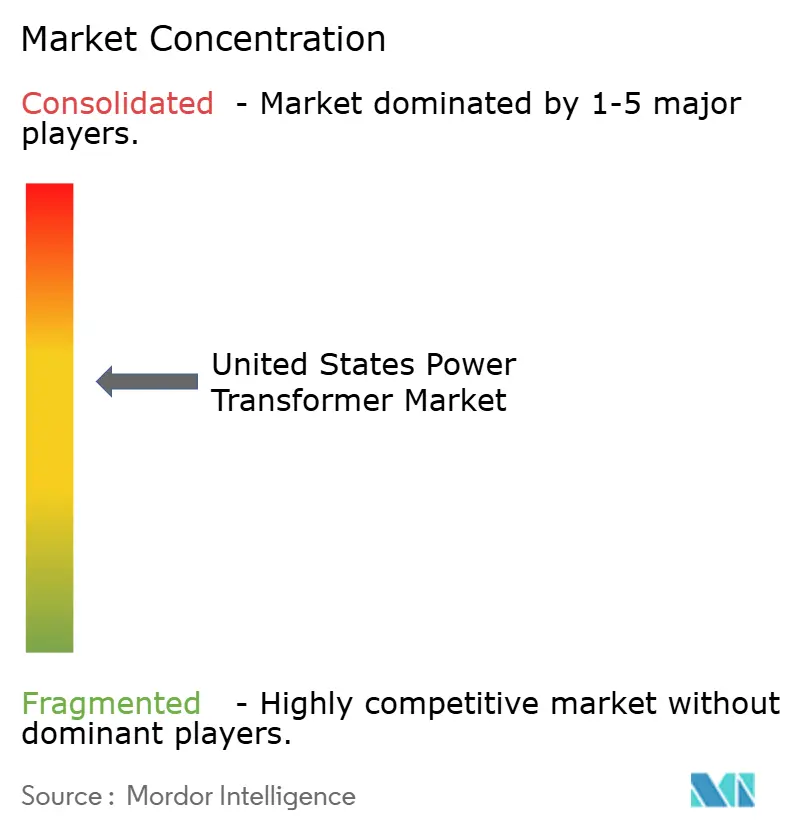
The United States power transformer market exhibits moderate concentration, with the top five manufacturers holding a roughly 55-60% combined revenue share. Hitachi Energy has announced a capital expenditure (capex) of USD 250 million for its Mississippi and Virginia sites, part of a USD 4.5 billion global build-out that aims to double North American output by 2027. Siemens Energy commits USD 150 million to expand its Charlotte, North Carolina, plant, earmarking capacity for 230 kV and 500 kV units that fulfill domestic-content criteria. Eaton’s USD 340 million South Carolina greenfield facility targets three-phase, medium-capacity models aimed at data centers and investor-owned utilities.
Strategic differentiation centers on lead-time reliability, digital-twin integration, and lifecycle service contracts. Hitachi Energy markets its TXpert platform, bundling dissolved-gas-analysis sensors, fiber-optic winding thermometry, and AI-driven asset analytics. GE Vernova pursues vertical integration via Prolec GE’s USD 645 million purchase of SPX Transformer Solutions, securing core-steel lamination capacity and adding high-voltage test bays. Cleveland-Cliffs’ USD 150 million electrical-steel plant in West Virginia offers OEMs a domestic alternative to Asian GOES, potentially easing supply bottlenecks but also elevating competitive entry barriers.
Technology-wise, solid-state transformer pilots command R&D attention. DOE’s FITT program funds Clemson University’s hybrid unit and GE Vernova’s SiC-based SST prototype, signaling a future pivot toward power-electronics-heavy architectures. In the interim, demand outstrips supply, and procurement award criteria increasingly reward guaranteed delivery over marginal cost differences. As a result, the United States power transformer market favors incumbents with deep capital pools, multi-site production footprints, and forward-integrated digital-service offerings.
United States Power Transformer Industry Leaders
-
Hitachi Energy Ltd.
-
Siemens Energy AG
-
ABB Ltd.
-
GE Vernova (GE Grid Solutions)
-
SPX Transformer Solutions Inc.
- *Disclaimer: Major Players sorted in no particular order
Market Opportunities and Future Outlook
A clear whitespace in the United States power transformer market sits between accelerating load additions and constrained delivery capacity, creating opportunities in capacity build-outs, standardization, and lifecycle services that reduce time-to-energize. DOE-led efforts to improve distribution transformer supply resilience have moved beyond diagnostics into coordination: in March 2026, DOE convened stakeholders on supply chain resilience and component interchangeability, an enabling step for higher-throughput manufacturing and faster substitution when constrained parts (such as cores and laminations) delay builds. With domestic plants supplying a limited share of large-unit requirements and multi-year lead times cited for large power transformers in 2026 reporting, utilities and commercial buyers are increasingly using early reservation of factory slots and multi-year sourcing frameworks, raising the value of manufacturers that can offer firm schedules, testing capacity, and standardized designs.
Technology and compliance-driven specification changes also create openings in non-mineral-oil solutions and digitalized fleets. EPA SPCC-driven spill containment requirements and stricter state enforcement (notably in California and parts of the Northeast) are pushing more projects toward less-flammable liquids, air-cooled designs, and enhanced monitoring packages, benefiting suppliers that can deliver compliant designs without extending lead times. On the upstream side, the federal focus on domestic core-steel availability (reinforced by the April 2026 DPA determination and the August 2025 tariff on derivative products) supports investments in US-based laminations, cores, and large-power test bays, aligning with buyers needs for supply assurance and reduced exposure to import disruptions.
Recent Industry Developments
- June 2026: Hitachi Energy broke ground on a USD 457 million expansion of its South Boston, Virginia site to build out large power transformer manufacturing at scale. The project targets a key constraint in the market, expanding domestic capability for large units that face extended lead times. It also strengthens local sourcing and testing capacity for utility and data center-driven demand.
- September 2025: Hitachi Energy announced a historic USD 1 billion manufacturing investment in the United States to expand production of critical grid infrastructure components, including transformers. The expanded footprint supports domestic-content oriented procurement and reduces exposure to imported subassemblies under tightening trade and security policies. This investment also signals a multi-site approach to shortening delivery cycles across voltage classes.
- December 2024: The US Department of Energy selected nine initiatives for USD 20 million under its FITT program to accelerate development of smart and solid-state transformers. The awards push forward architectures that incorporate power electronics and advanced monitoring, complementing near-term demand for digital condition monitoring in conventional transformers. Over time, these pilots can influence specification requirements and supplier differentiation for utility modernization programs.
Research Methodology Framework and Report Scope
Market Definition and Coverage
For this methodology, the market covers revenue earned from power transformers sold for use in the United States, across utility and non-utility installations, where the equipment is designed for high-voltage power transfer in transmission and substation-linked applications.
Scope exclusions: We exclude distribution transformers and most small pole-mounted units that are primarily used at the last-mile distribution level.
Segmentation Overview
-
By Power Rating
- Large (Above 100 MVA)
- Medium (10 to 100 MVA)
- Small (Up to 10 MVA)
-
By Insulation Type
- Air-cooled
- Oil-cooled
-
By Phase
- Single Phase
- Three Phase
-
By End-User
- Power Utilities (includes, Renewables, Non-renewables, and T&D)
- Industrial
- Commercial
- Residential
Data Sources, Market Sizing, and Validation
Desk Research
Desk work starts by mapping the demand pool and the supply footprint, since power transformers sit between generation, transmission, and end-use loads. We referenced public sources such as the U.S. Energy Information Administration for grid and electricity indicators, the U.S. Department of Energy for grid program context, and the Federal Energy Regulatory Commission for transmission planning signals that feed into substation investment decisions.
To keep the model grounded in real flows, we also checked U.S. International Trade Commission trade statistics and tariff line movements. We then reviewed standards and technical references from IEEE and NEMA that help interpret ratings, losses, and cooling configurations. Company filings, investor decks, and reputable trade press were used to cross-check capacity additions, lead times, and order backlogs, and then a paid subscription for company financials plus a shipment-level trade database were used selectively to validate directional trends. These examples are not exhaustive, and many other public documents and datasets were also reviewed to collect data, validate assumptions, and clarify open questions.
Primary Interviews and Surveys
Primary work focused on interviews and short surveys with utility procurement teams, EPC and substation engineering groups, transformer service partners, and manufacturers and distributors active in the United States. We used these inputs to confirm practical pricing behavior, typical lead times, the mix shift between oil-insulated and air-insulated units, and how replacement cycles and new interconnection activity are showing up in near-term orders.
Distribution of primary research fieldwork respondents
| Company type | Respondent position |
|---|---|
| Top tier: 25% | CXOs: 15% |
| Mid tier: 59% | Functional/Unit leaders: 36% |
| Smaller Players: 16% | Managers: 49% |
Market-Sizing & Forecasting
We built the size starting from a top-down demand reconstruction tied to U.S. grid investment signals, and then we translated that activity into transformer spending using realistic unit shares and value per installation. The model is corroborated with selective bottom-up checks, such as sampled average selling prices multiplied by implied shipment volumes, and channel checks on order pipelines, with adjustments made when the two views do not reconcile.
Inputs are chosen because they move with transformer demand in a traceable way, including transmission and substation capital spending, grid expansion and interconnection activity, replacement and refurbishment cadence of aging units, reported lead-time and backlog conditions, and pricing shifts driven by core steel and copper movements. Interviews usually show that not every planned project converts on time, so scenario analysis is used for forecasts, where project timing, replacement intensity, and pricing progression are varied within expert-agreed ranges. When shipment visibility or pricing breaks down, missing pieces are filled using bounded ranges, then narrowed through follow-up calls and consistency checks against trade and investment indicators.
Data Validation & Update Cycle
Outputs are checked against independent signals before sign-off, including trade direction, order lead times, and utility spending narratives that should move in the same direction as revenues. If a segment-level jump looks unusual, the assumptions are re-opened, outliers are reviewed, and respondents are re-contacted to confirm whether the change is a real market shift or a modeling artifact.
Each report is refreshed annually, and interim updates are triggered when there are material events such as sudden price shocks in key metals, large policy changes affecting transmission buildout, or major supply disruptions that alter lead times. Before delivery, we do a fresh pass on the latest public releases so clients receive the most current, internally consistent view.
Mordor Intelligence's United States Power Transformer Market Size Compared With Other Published Estimates
It is common to see different published market sizes for U.S. power transformers, even when the topic sounds identical at first glance. The spread usually comes from what gets counted as a power transformer versus adjacent transformer categories, the year used for pricing, and how replacement demand is separated from new build projects.
Key gap drivers here include whether distribution transformers and broader transformer revenues are mixed into the total, whether values are stated in factory-gate revenue or include installation and related services, and how pricing is updated during periods of volatile input costs. Some estimates also anchor on a different base year or apply aggressive capacity buildout assumptions without checking them against lead time, backlog, and utility procurement reality, which can widen totals quickly.
Benchmark comparison
| Source | Market Size | Gaps in Research Methodology |
|---|---|---|
| Mordor Intelligence | USD 4.76 B (2026) | |
| Industry Publisher A | USD 5.21 B (2024) | Uses a different base year and appears to rely on a broader rating-led view without clearly separating replacement timing and price-year effects, which can lift or compress the value depending on assumed ASP progression. |
| Trade Journal B | USD 12.20 B (2024) | Looks closer to an all-transformer total where multiple transformer categories are likely combined, and scope details on included products and revenue layers are not fully specified. |
The table shows that most of the gap is explained by scope and price-year alignment, rather than a disagreement on demand direction. When distribution and other transformer categories are excluded and revenues are tied back to substation-linked spending signals with interview checks on lead times and pricing, the market total settles lower, which is the treatment applied by Mordor Intelligence.
Key Questions Answered in the Report
What is the current value of the United States power transformer market?
The United States power transformer market is valued at USD 4.76 billion in 2026.
How fast is the market expected to grow?
It is projected to reach USD 6.39 billion by 2031, registering a 6.08% CAGR.
Which transformer segment holds the largest share?
Medium-capacity units (10-100 MVA) hold 61.85% of market revenue as of 2025.
Why are data centers influencing transformer demand?
Hyperscale campuses require >250 MVA capacity and duplicate units for redundancy, sharply increasing order volumes.
How are federal policies supporting domestic manufacturing?
IIJA grants and IRA bonus credits tied to domestic content have triggered more than USD 2 billion in new U.S. transformer-plant investments.
What is the main supply-chain bottleneck for manufacturers?
Grain-oriented electrical steel shortages and copper price volatility extend lead times and elevate costs.