
Market Overview
| Study Period | 2021 - 2031 |
|---|---|
| Forecast Data Period | 2026 - 2031 |
| Base Year Market Size (2025) | USD 3.93 Billion |
| Market Size (2026) | USD 4.14 Billion |
| Market Size (2031) | USD 5.34 Billion |
| Growth Rate (2026 - 2031) | 5.23 % |
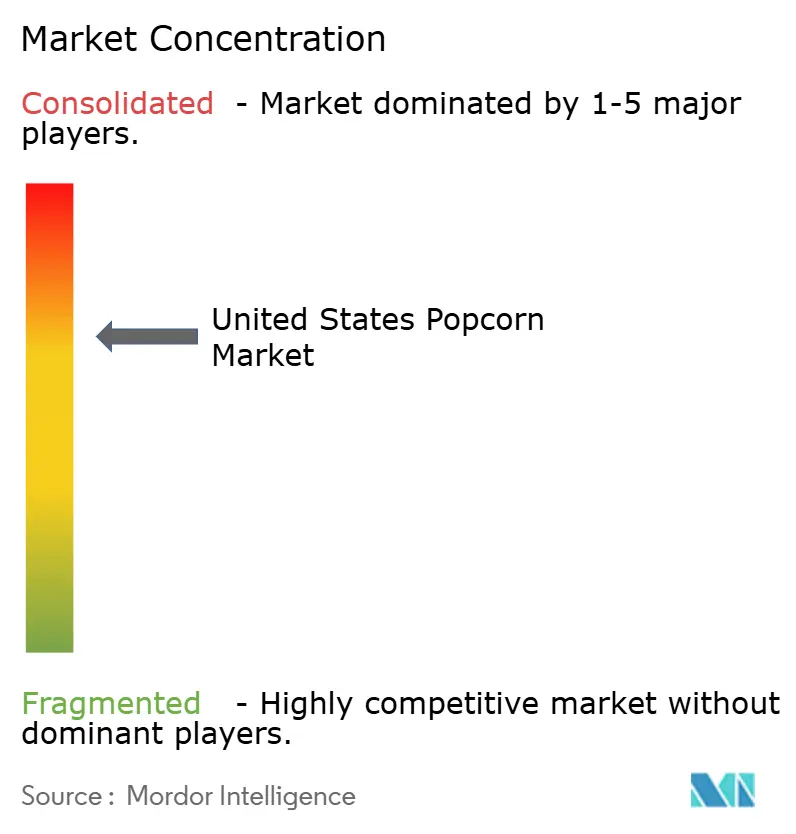
| Market Concentration | Medium |
Major Players *Disclaimer: Major Players sorted in no particular order Image © Mordor Intelligence. Reuse requires attribution under CC BY 4.0. | |
United States Popcorn Market Analysis by Mordor Intelligence
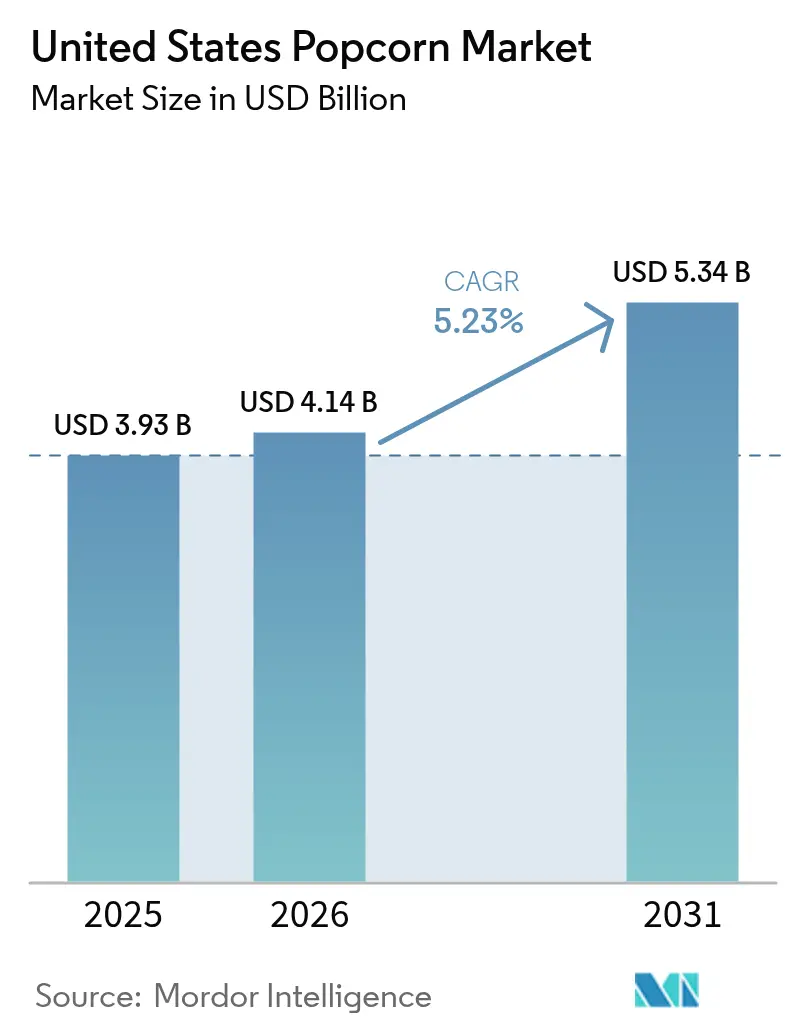
The United States popcorn market size was valued at USD 3.93 billion in 2025 and estimated to grow from USD 4.14 billion in 2026 to reach USD 5.34 billion by 2031, at a CAGR of 5.23% during the forecast period (2026-2031). This growth is driven by an increase in snacking habits, the rising popularity of home entertainment, and a growing preference for healthier snack options. Ready-to-eat popcorn is popular due to its convenience; meanwhile, microwave popcorn is the fastest-growing segment as it offers a convenient way to enjoy portion-controlled snacks at home. Consumers, particularly millennials and Gen Z, are increasingly drawn to organic and functional popcorn options that align with their preference for clean-label and health-conscious foods. Unique cheese flavors and international-inspired varieties are driving the premiumization trend in the market. Supermarkets/hypermarkets continue to be the primary distribution channels for popcorn, but e-commerce is rapidly gaining traction. The competitive landscape remains intense, with large food companies, entertainment brands, and smaller niche players competing for market share. Companies are focusing on flavor innovations, improved packaging, and expanding their presence across multiple sales channels to attract and retain customers.
Key Report Takeaways
- By product type, ready-to-eat popcorn led with 67.92% of the United States popcorn market share in 2025, while microwave popcorn is projected to expand at an 8.12% CAGR through 2031.
- By nature, conventional popcorn accounted for 84.35% of the United States popcorn market size in 2025; organic popcorn is expected to log a 8.84% CAGR between 2026-2031.
- By flavor, traditional salted variants held 58.71% share of the United States popcorn market size in 2025, whereas cheese flavors are forecast to advance at an 7.98% CAGR through 2031.
- By packaging type, multi-serve formats captured 54.66% revenue share in 2025, and single-serve packs are set to register an 8.06% CAGR to 2031.
- By distribution channel, supermarkets/hypermarkets controlled 88.62% of the United States popcorn market size in 2025; online retail is projected to post a 8.63% CAGR through 2031.
Note: Market size and forecast figures in this report are generated using Mordor Intelligence’s proprietary estimation framework, updated with the latest available data and insights as of 2026.
United States Popcorn Market Trends and Insights
Drivers Impact Analysis*
| DRIVER | (~) % IMPACT ON CAGR FORECAST | GEOGRAPHIC RELEVANCE | IMPACT TIMELINE |
|---|---|---|---|
| Increasing adoption of snacking as a meal replacement | +1.2% | National, with higher penetration in urban markets | Medium term (2-4 years) |
| Convenience and on-the-go formats | +0.9% | National, concentrated in metropolitan areas | Short term (≤ 2 years) |
| Rising demand for health-positioned salty snacks | +1.1% | National, with premium segments in coastal regions | Long term (≥ 4 years) |
| Increased streaming and in-home entertainment | +0.8% | National, accelerated in suburban markets | Short term (≤ 2 years) |
| Rapid flavour and seasoning innovation | +0.7% | National, with test markets in major cities | Medium term (2-4 years) |
| Influence of social media and trends | +0.6% | National, concentrated among younger demographics | Short term (≤ 2 years) |
| Source: Mordor Intelligence | |||
Increasing adoption of snacking as meal replacement
Busy lifestyles, hybrid office models, and remote learning are changing the way Americans eat, with many opting for snacks instead of traditional meals. According to the 2024 International Food Information Council (IFIC) Food and Health Survey, 56% of adults now replace full meals with snacks or smaller portions, showing how snacking has become a key part of daily eating habits[1]. Popcorn is gaining popularity as a convenient meal replacement option, especially when enhanced with added protein, as it offers both portability and nutritional value. Millennials and Gen Z are driving this trend by seeking snacks that are satisfying, made with clean ingredients, and easy to fit into their busy schedules. To meet this growing demand, brands are positioning popcorn as a functional snack that can compete with traditional protein bars. For instance, in 2025 when Khloé Kardashian introduced Khloud Protein Popcorn, which provides 7 grams of protein per serving, 3 times more than regular popcorn. This highlights how celebrity-driven innovation is helping popcorn solidify its role as a practical meal replacement option.
Rising demand for health-positioned salty snacks
Popcorn is becoming a popular healthy snack option because it is 100% whole grain, lower in calories compared to chips or crackers, and a good source of dietary fiber. According to the United States Department of Agriculture (USDA), 1 serving of air-popped popcorn provides about 15% of the daily recommended fiber intake for the United States population[2]. These nutritional benefits match consumer preferences for snacks that are both enjoyable and support health goals. The demand for non-genetically modified organism (Non-GMO) ingredients and transparent sourcing makes popcorn even more appealing to health-conscious buyers. Research into its potential prebiotic benefits also creates opportunities for new functional products. Brands are responding with options like low-sodium, air-popped, and avocado oil popcorn. For example, in June 2024, Be Happy Snacks launched 2 new flavors, Cotton Candy and White Cheddar, which are whole-grain, gluten-free, and low-sodium. This shows how flavors can combine with health-focused features to compete in the “better-for-you” snack aisle alongside trail mixes, dried fruit, and ancient-grain crisps.
Increased streaming and in-home entertainment
Streaming platforms have made popcorn a popular snack for at-home entertainment, moving beyond its traditional association with movie theaters. As more people spend their evenings watching shows, live sports, and online content, popcorn has become a go-to snack because it is easy to prepare and share. In 2024, World Population Review reported that Netflix had 66.7 million subscribers in the United States, showing the large audience driving this trend[3]. Entertainment companies are also tapping into this opportunity, such as Netflix’s 2024 partnership with Walmart to sell its own branded popcorn, turning viewers into buyers. This has increased demand for multipacks, while ready-to-eat options are gaining popularity for their convenience. The growing trend of binge-watching is closely tied to increased snack consumption. Consumers are now planning their snack purchases to align with their streaming schedules, leading to noticeable surges in popcorn sales during these times. This shift in behavior is prompting retailers to broaden their range of in-home snack options to cater to this demand, ensuring they meet the needs of consumers seeking convenient snacking experiences.
Rapid flavor and seasoning innovation
Flavor innovation is becoming a major factor driving growth in the U.S. popcorn market, as consumers increasingly look for unique and exciting snack options. According to the 2024 Mondelez Snacking Report, 63% of United States population prefer snacks over meals, emphasizing the importance of taste in their daily lives. Advances in seasoning technology have made it possible to evenly distribute flavors, encouraging brands to experiment with bold options. Companies are utilizing this trend through limited-edition products to attract attention. For instance, in September 2024, Smartfood teamed up with rap icon Flavor Flav to promote its flavor-focused campaign, while in May 2025, Pop Secret introduced 3 ready-to-eat flavors featuring a “Butter Meter” to offer both convenience and customization. Smaller brands are also standing out, such as Good Eat’n’s 2024 launch of Spicy Chedda’ Popcorn, which caters to the growing demand for hot-and-spicy snacks. These efforts highlight how flavor innovation is helping popcorn remain competitive with other salty snacks while also supporting premium pricing strategies.
Restraints Impact Analysis*
| RESTRAINT | (~) % IMPACT ON CAGR FORECAST | GEOGRAPHIC RELEVANCE | IMPACT TIMELINE |
|---|---|---|---|
| Strong competition from alternate snacks | -0.8% | National, intensified in urban markets | Medium term (2-4 years) |
| Price sensitivity in gourmet segments | -0.5% | National, concentrated in price-conscious regions | Short term (≤ 2 years) |
| Health concerns around flavored popcorn | -0.4% | National, amplified through social media | Long term (≥ 4 years) |
| Dependence on corn supply and price volatility | -0.7% | National, with regional supply chain variations | Medium term (2-4 years) |
| Source: Mordor Intelligence | |||
Strong competition from alternate snacks
Competition from alternative snacks is a significant challenge for the United States popcorn market, as consumers are increasingly drawn to snacks that offer higher protein content, unique ingredients, or added health benefits. Products like protein-packed nut mixes and plant-based jerky are gaining popularity, especially among health-conscious millennials and Gen Z consumers. These alternatives often provide better nutritional value or novelty, making them more appealing to this demographic. For example, in 2024, Beyond Meat launched its plant-based jerky nationwide in collaboration with PepsiCo’s Frito-Lay. This product is marketed as a high-protein, clean-label snack that caters to flexitarian consumers looking for healthier options. Such innovative launches attract significant attention from retailers, as they typically have higher price points and deliver better profit margins compared to traditional popcorn products. Popcorn manufacturers are responding to these challenges by introducing new and exciting flavors, adding nutritional benefits like protein or fiber, and improving packaging to make their products more convenient for consumers.
Dependence on corn supply and price volatility
Popcorn’s heavy reliance on corn as its primary ingredient makes the United States market vulnerable to supply issues and price fluctuations. Even though processors use hedging strategies to manage risks, the United States Department of Agriculture (USDA) data shows that corn prices are expected to vary between USD 4.20 and 4.35 per bushel through the 2025/26 crop year[4]. Extreme weather conditions, such as droughts or floods in key corn-producing states in the Midwest, can significantly impact the quality and quantity of the crop. This, in turn, raises production costs and reduces profit margins for popcorn manufacturers. Changes in trade policies or shifts in export demand can further disrupt the domestic supply of corn, adding to the uncertainty. Unlike other snack categories, popcorn manufacturers have limited options due to their dependence on corn. This lack of flexibility makes it challenging to manage rising costs without increasing prices for consumers. These challenges pose significant risks to the profitability of popcorn producers, especially smaller or premium brands that operate with tighter margins.
*Our forecasts treat driver/restraint impacts as directional, not additive. The impact forecasts reflect baseline growth, mix effects, and variable interactions.
Segment Analysis
By Product Type: Ready-to-Eat Dominance Drives Convenience
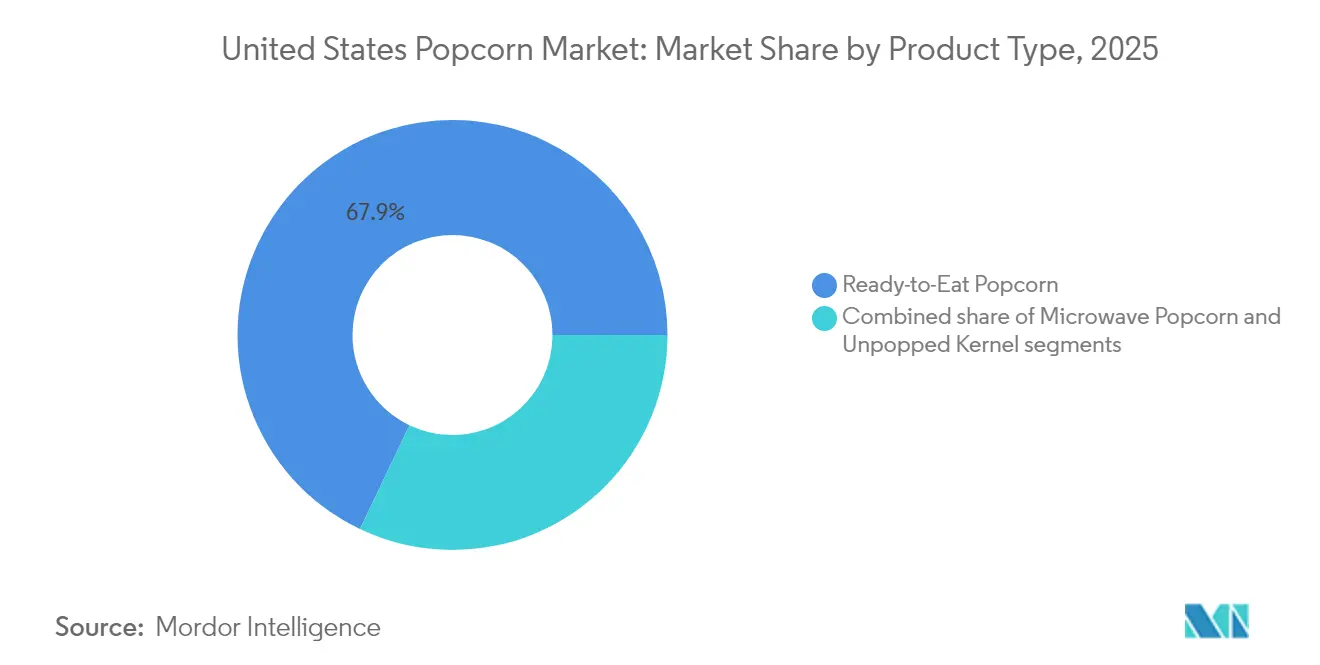
Ready-to-eat popcorn led the United States market in 2025, making up 67.92% of total sales. This reflects the growing demand for convenient snacks that are ready to consume without any preparation. Products like multipacks, single-serve pouches, and family-size tubs cater to various needs, whether for individual snacking, sharing with family, or enjoying on the go. The popularity of ready-to-eat popcorn has been further boosted by innovations in flavors, healthier ingredients, and attractive packaging, which allow brands to charge premium prices. Social media trends and limited-edition flavors also play a significant role in attracting younger consumers who are eager to try new and exciting options, driving repeat purchases.
Microwave popcorn is another key segment, expected to be the fastest growing segment at a strong CAGR of 8.12% between 2026 and 2031. Its popularity is tied to its convenience and ability to recreate a theater-like experience at home, making it a favorite for families and older consumers. The segment is also expanding its appeal with health-focused options, such as low-sodium, light butter, and protein-enriched varieties. Microwave popcorn is particularly suited for portion-controlled snacking and aligns well with the increasing time people spend streaming content at home. Together with ready-to-eat popcorn, this segment supports the overall growth of the United States popcorn market by catering to diverse consumer preferences and snacking occasions.

By Nature: Organic Growth Accelerates Premium Positioning
Conventional popcorn led the United States market in 2025, contributing to 84.35% of total sales. Its dominance is largely due to its affordability and widespread availability, making it a go-to choice for everyday snacking. With well-established supply chains, manufacturers can offer competitive pricing, ensuring these products remain accessible to a broad consumer base. Conventional popcorn is a staple in supermarkets, convenience stores, and online platforms, supported by strong brand recognition and consistent quality. This segment caters to value-conscious shoppers who prefer familiar flavors and reliable options for their snacking needs.
On the other hand, organic popcorn is gaining traction as a fast-growing segment, with a projected CAGR of 8.84% from 2026 to 2031. This growth is fueled by increasing demand from millennials and Gen Z consumers who prioritize health, sustainability, and clean-label products. Organic popcorn brands are meeting this demand by offering certified organic options and emphasizing natural, responsibly sourced ingredients. Premium and limited-edition flavors are helping to attract health-conscious and ethically driven buyers. As a result, organic popcorn is carving out a niche in the better-for-you snack category, appealing to those seeking healthier and more sustainable snacking alternatives.
By Flavor Profile: Innovation Beyond Traditional Boundaries
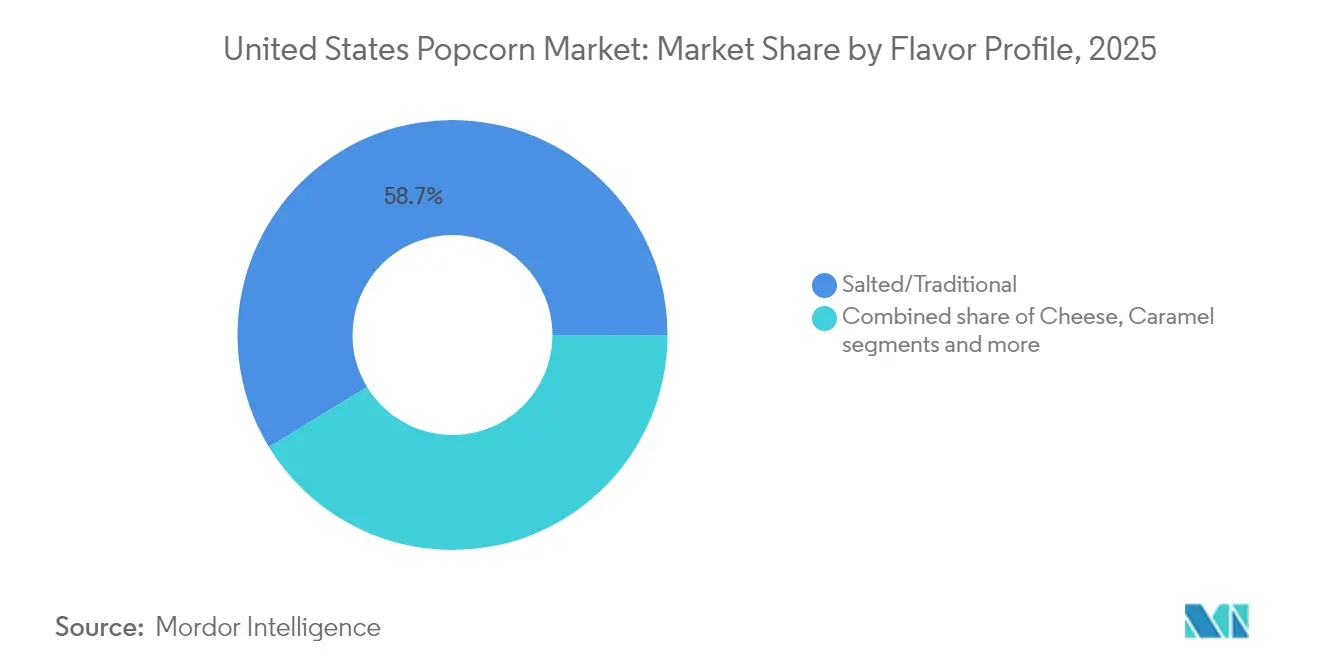
Salted/traditional popcorn held 58.71% of the United States market share in 2025, showcasing its strong appeal as a simple and versatile snack option. This classic flavor remains popular due to its affordability, widespread availability, and suitability for various snacking occasions. Consumers continue to choose salted popcorn for its familiarity and consistent quality, making it a staple in households across the country. Its dominance is further supported by established brands and efficient distribution networks, ensuring it remains a go-to choice for everyday snacking needs.
Cheese-flavored popcorn is rapidly gaining popularity and is expected to grow at an 7.98% CAGR through 2031, driven by increasing demand for bold and indulgent snack options. Advances in seasoning technology have improved flavor consistency, making these products more appealing to consumers. Younger audiences, in particular, are drawn to the rich and adventurous taste profiles offered by cheese-flavored popcorn. The introduction of specialty and limited-edition cheese varieties has encouraged trial purchases and repeat consumption, contributing to the segment's steady growth and expanding its presence in the United States popcorn market.
By Packaging Type: Single-Serve Growth Reflects Lifestyle Shifts
Multi-serve bags made up 54.66% of the United States popcorn market in 2025, highlighting their popularity among families and groups. These larger packaging options are cost-effective and convenient for sharing during movie nights, parties, or other social gatherings. They allow consumers to enjoy popcorn in bulk without the need for frequent purchases. Multi-serve formats are widely available in supermarkets, wholesale clubs, and online platforms, making them a go-to choice for households looking for value and convenience. Established brands use these formats to maintain visibility and strengthen customer loyalty in the competitive market.
On the other hand, single-serve popcorn packs are gaining traction and are expected to grow at a robust 8.06% CAGR between 2026 and 2031. These smaller, portable packs cater to busy lifestyles, offering convenience for on-the-go snacking. They are particularly appealing to commuters, students, and health-conscious consumers who prefer portion-controlled options. Brands are focusing on innovative packaging, such as resealable pouches and vibrant designs, to attract attention and enhance usability. As a result, single-serve formats are becoming a key growth driver in the popcorn market, meeting the evolving needs of modern consumers.
By Distribution Channel: E-commerce Acceleration Transforms Retail
Supermarkets/hypermarkets dominated the United States popcorn market in 2025, accounting for 88.62% of sales. These stores remain the go-to choice for consumers due to their convenience and wide variety of popcorn options, including traditional, flavored, and bulk packs. Shoppers often pick up popcorn during their regular grocery trips, and prominent shelf placement or end-cap displays encourage impulse purchases. Supermarkets and hypermarkets frequently run promotions, such as discounts or in-store sampling, which further boost sales and attract a broad customer base. These factors make them a critical distribution channel for popcorn brands aiming to reach a large audience.
E-commerce is rapidly gaining traction as a preferred channel for popcorn purchases, with a projected growth rate of 8.63% CAGR through 2031. Online platforms offer unmatched convenience, allowing consumers to browse and purchase a wide range of popcorn products from the comfort of their homes. Subscription services and bundle deals are particularly appealing to busy households and professionals, ensuring regular deliveries without the need for repeated orders. E-commerce platforms often feature exclusive flavors and personalized recommendations, which cater to niche preferences and enhance customer loyalty.
Geography Analysis
Coastal states, such as California and New York, are leading markets for premium and organic popcorn due to their affluent and health-conscious populations. Consumers in these regions are more inclined to spend on high-quality products and are quick to embrace globally inspired flavors. This trend has strengthened the popcorn market's foothold in these areas, making them significant contributors to overall market growth. The rising demand for innovative and unique flavors reflects the evolving preferences of these consumers, who are always on the lookout for healthier and more exciting snacking options.
The Midwest benefits from its proximity to corn-producing regions, which helps reduce logistics costs and allows for competitive pricing in supermarkets. Cities like Chicago, Minneapolis, and Kansas City experience strong sales of family-size bulk popcorn, catering to households seeking affordable and convenient snacking solutions. This regional advantage ensures widespread availability and affordability, making popcorn a staple snack in these areas. The Midwest plays a critical role in the supply chain, ensuring a steady flow of products to other parts of the country, which supports the overall market's stability and growth.
In the South and Southwest, bold and spicy popcorn flavors are particularly popular, reflecting the regional preference for strong and vibrant tastes. Retailers in states like Texas and Arizona often introduce localized flavor options, such as jalapeño cheddar, to cater to the unique preferences of consumers in these areas. Suburban regions across the country are also seeing a rise in demand for ready-to-eat tubs, as families prioritize convenience and value. Meanwhile, urban centers like New York City and San Francisco favor single-serve options due to their portability, catering to space-conscious and busy consumers who prefer on-the-go snacking solutions.
Regulatory Landscape
In the United States, popcorn processors operate under federal food safety and adulteration oversight led by the US Food and Drug Administration (FDA), including FDA Compliance Policy Guide Sec. 585.675, which sets out enforcement criteria for popcorn adulteration (including contamination and substitution issues). For supply chain and food safety programs, the FDA Food Safety Modernization Act (FSMA) framework continues to shape preventive controls and recordkeeping expectations for packaged snack producers.
On the commodity and promotion side, popcorn is covered by the Popcorn Promotion, Research, and Consumer Information Act (7 U.S.C. 7481-7491), which funds a national research and promotion program through mandatory assessments on domestic processors. In March 2026, the USDA Agricultural Marketing Service published a final rule updating the mandatory assessment rate under the Popcorn Promotion, Research, and Consumer Information Order (7 CFR Part 1215) to 6 cents per hundredweight, effective April 9, 2026 for processors above the 4 million pounds annual threshold. The change affects compliance reporting and cost pass-through decisions for larger processors.
Competitive Landscape
The United States popcorn market is moderately concentrated, with a mix of large multinational companies and smaller niche players. Major brands like Conagra’s Orville Redenbacher, PepsiCo’s Smartfood, and Hershey-owned SkinnyPop dominate the market by utilizing their strong supply chains, wide distribution networks, and extensive advertising strategies. Hershey’s acquisition of 2 Weaver Popcorn plants in 2024 enhanced its vertical integration, allowing faster delivery of products to shelves. Conagra is also focusing on innovation by improving microwave bag technology, aiming to eliminate Per- and Polyfluoroalkyl Substances (PFAS) linings, while PepsiCo promotes Smartfood alongside its beverages to encourage larger purchases.
New competitors from the entertainment industry are adding fresh dynamics to the market. AMC Entertainment launched its retail popcorn brand, “AMC Theatres Perfectly Popcorn,” in 2023, utilizing its reputation in the movie industry to enter grocery stores. Similarly, Netflix partnered with Popcorn Indiana in 2024 to introduce its own popcorn line, which quickly gained nationwide distribution through Walmart. These new entrants are pushing traditional brands to enhance their marketing strategies, improve packaging designs, and create stronger brand stories to maintain their market presence.
Smaller start-ups are finding success by targeting niche markets with innovative products, such as protein-enriched, adaptogen-infused, or keto-friendly popcorn. Many of these companies use crowdfunding platforms to launch their ideas before scaling up through online retailers like Amazon. Private-label popcorn is gaining popularity as retailers like Costco and Trader Joe’s establish direct contracts with suppliers, offering consumers more affordable options. As a result, controlling the value chain, developing unique flavor profiles, and ensuring quick delivery to shelves have become critical factors for success in the United States popcorn market.
United States Popcorn Industry Leaders
-
PepsiCo Inc.
-
Grupo Bimbo, S.A.B. de C.V.
-
Conagra Foods Inc.
-
Our Home
-
The Hershey Company
- *Disclaimer: Major Players sorted in no particular order
Market Opportunities and Future Outlook
Product differentiation is increasingly extending beyond classic salted formats into functional and premium options that compete with other better-for-you salty snacks, particularly as some consumers substitute snacks for meals. This is visible in protein-positioned launches such as Khloud Protein Popcorn (introduced in 2025 with 7 grams of protein per serving) and PepsiCo Foods launching PopCorners Protein in May 2026 (9 grams of protein per serving). Together, these launches reinforce a viable whitespace for higher-protein, clean-label, and portion-controlled popcorn across both ready-to-eat and microwave formats.
Operational scale-up and automation are also gaining attention for brands looking to support wholesale, club, and omnichannel distribution, where corn price volatility and margin pressure increase the value of tighter execution. In April 2026, Carrolls Corn invested USD 3.5 million to acquire and convert a 12,000-square-foot facility in Rochester, Minnesota into a dedicated production warehouse to expand wholesale capacity and automation, and in June 2026 Belle's Popcorn commissioned a fully automated production line from TGMachine focused on high-expansion popping and precision seasoning. Alongside these moves, the USDA-led Popcorn Promotion, Research, and Consumer Information Order provides an established platform for industry-wide promotion and research funding (assessment rate updated effective April 2026), which brands can use to support category marketing activities that can be paired with e-commerce bundles, retail multipacks, and in-home entertainment-led merchandising.
Recent Industry Developments
- May 2026: PepsiCo Foods launched PopCorners Protein with 9 grams of protein per serving across three flavors, starting in select retailers toward the end of May and scaling distribution nationally by July 2026. The product extends popcorn-adjacent popped snacks into functional positioning, increasing pressure on incumbent popcorn brands to innovate around protein and other better-for-you claims.
- August 2025: Pop Secret, part of the Our Home portfolio, introduced its first ready-to-eat popcorn line in Movie Theater Butter, Homestyle Sea Salt, and Double Cheddar and rolled it out to around 2,300 US locations. The launch broadened Pop Secret's presence beyond microwave into grab-and-go snacking, strengthening its ability to defend shelf space in mainstream grocery and mass retail.
- August 2024: Our Home completed the acquisition of the Pop Secret popcorn business from The Campbell Soup Company. The ownership change consolidated a major popcorn brand under a snack-focused platform, supporting sharper portfolio management and investment emphasis within popcorn and adjacent salty snacks.
Research Methodology Framework and Report Scope
Market Definition and Coverage
For this report, the market is defined as the value of popcorn sold in the United States across key retail and online channels, covering ready-to-eat, microwave popcorn, and popcorn kernels that are purchased for at-home or out-of-home consumption.
Scope exclusions: We exclude unpopped corn sold for non-popcorn uses, and we also exclude cinema concession services and restaurant margin that is not directly tied to popcorn product sales.
Segmentation Overview
- By Product Type
- Microwave Popcorn
- Ready-to-Eat Popcorn
- Unpopped Kernel
- By Nature
- Organic
- Conventional
- By Flavor Profile
- Salted/Traditional
- Caramel
- Barbecue
- Cheese
- Butter
- Others
- By Packaging Type
- Single-Serve
- Multi-Serve
- Family/Bulk Packs
- By Distribution Channel
- Supermarkets/Hypermarkets
- Convenience Stores
- Online Retail Channels
- Other Distribution Channels
Data Sources, Market Sizing, and Validation
Desk Research
Desk work starts with building a clean fact base on supply, demand, and pricing signals that can be checked year over year. We used public sources such as USDA agricultural statistics for corn context, US Census Bureau series for retail and trade context, Bureau of Labor Statistics price data for snack inflation direction, and FDA recall and labeling information to understand compliance and product changes.
To keep the model grounded, we also reviewed sources such as SEC filings and investor presentations from relevant packaged food companies, reputable trade association materials, and credible business press for channel shifts and product mix. In a few places, we used paid subscriptions for company financials and intelligence, and for patent databases, mainly to confirm innovation activity and approximate category exposure when public disclosures were limited. The sources named above are illustrative and not exhaustive, and many other public references were used for collection, cross-checks, and clarification.
Primary Interviews and Surveys
Primary work was used to pressure test our assumptions on what sells, where it sells, and how pricing is moving in the United States. We spoke with a mix of brand and channel-side respondents, along with packaging and ingredient ecosystem contacts, so gaps from desk research could be closed, and the final model could be sanity-checked across different viewpoints.
Distribution of primary research fieldwork respondents
| Company type | Respondent position |
|---|---|
| Top tier: 35% | CXOs: 17% |
| Mid tier: 47% | Functional/Unit leaders: 25% |
| Smaller Players: 18% | Managers: 58% |
Market-Sizing & Forecasting
We sized the market mainly using a top-down demand reconstruction that starts from the in-scope popcorn consumption pool in the United States and then applies channel splits and average selling price logic for ready-to-eat, microwave, and kernels. To keep the totals realistic, the outputs are then corroborated with selective bottom-up checks, including sampled shelf pricing across major store formats, observed pack-size mix, and channel checks. Where gaps appeared, we handled them through conservative assumptions that were re-validated in interviews.
Key inputs that guided the model (illustrative) included snack category growth signals, ready-to-eat versus microwave purchase mix, pack-size and multipack patterns, discounting intensity in mass and grocery channels, and commodity-driven cost pressure that can influence shelf pricing. Forecasts were built using scenario analysis supported by expert views on price progression, promotion normalization, and channel mix shifts, then reconciled with historical trend consistency so the growth path is not driven by one indicator alone.
Data Validation & Update Cycle
Outputs are validated through multiple checks, including cross-verifying implied consumption movement against known snack demand patterns and reviewing price and mix changes for reasonableness. When a variance looks too large, we revisit the assumptions, re-check the source trail, and re-contact relevant experts to confirm whether the change is real or just a modeling artifact.
Before sign-off, the work is reviewed in steps so calculation errors, inconsistent definitions, and timing mismatches are removed. Reports are refreshed annually, and interim updates are made when material events affect demand, supply, or pricing, followed by a final pre-delivery pass so clients receive the latest updated view.
Mordor Intelligence's United States Popcorn Market Size Versus Other Published Estimates
Published market values for US popcorn are often not the same because teams do not always count the same revenue pool, and the timing of pricing assumptions can also differ. The biggest differences usually come from whether estimates follow consumer sales value versus manufacturing output, and whether foodservice-related popcorn product sales are counted as product revenue or treated as a service line.
Retail shelf price checks, pack-size mix shifts, and channel share signals are the evidence that ties Mordor Intelligence's estimate to in-scope popcorn product sales across ready-to-eat, microwave, and kernels in the United States.
Benchmark comparison
| Source | Market Size | Gaps in Research Methodology |
|---|---|---|
| Mordor Intelligence | USD 3.93 B (2025) | |
| Industry Research Desk A | USD 3.54 B (2025) | Applies a narrower view of sales value by relying more heavily on type-level splits with less explicit channel value mapping, which can undercount portions of online and club-driven consumer sales. |
| Industry Statistics Publisher B | USD 2.60 B (2026) | Measures the popcorn manufacturing industry, which excludes downstream retail and online value capture, and it also uses a different year that can shift totals due to price and volume changes. |
Across the two outside figures, the main gap is explained by scope alignment and year alignment, rather than a different read on demand direction. By keeping product forms, sales channels, and price timing explicit, our market value stays traceable to repeatable inputs that can be refreshed as conditions change.
Key Questions Answered in the Report
What is the current value of the United States popcorn market?
The market is valued at USD 4.14 billion in 2026 and is on track to reach USD 5.34 billion by 2031 at a 5.23% CAGR.
Which popcorn format holds the largest share in United States grocery sales?
Ready-to-eat popcorn leads with 67.92% share of 2025 sales thanks to grab-and-go convenience.
How fast is the organic popcorn segment growing in the United States?
Organic popcorn is advancing at a 8.84% CAGR between 2026-2031 as health-oriented shoppers trade up.
Which distribution channel is expanding quickest for popcorn purchases?
Online retail is growing at 8.63% CAGR due to subscription services and specialty flavor availability.