
Market Overview
| Study Period | 2020 - 2031 |
|---|---|
| Forecast Data Period | 2026 - 2031 |
| Base Year Market Size (2025) | USD 12.09 Billion |
| Market Size (2026) | USD 12.42 Billion |
| Market Size (2031) | USD 14.04 Billion |
| Growth Rate (2026 - 2031) | 2.48 % |
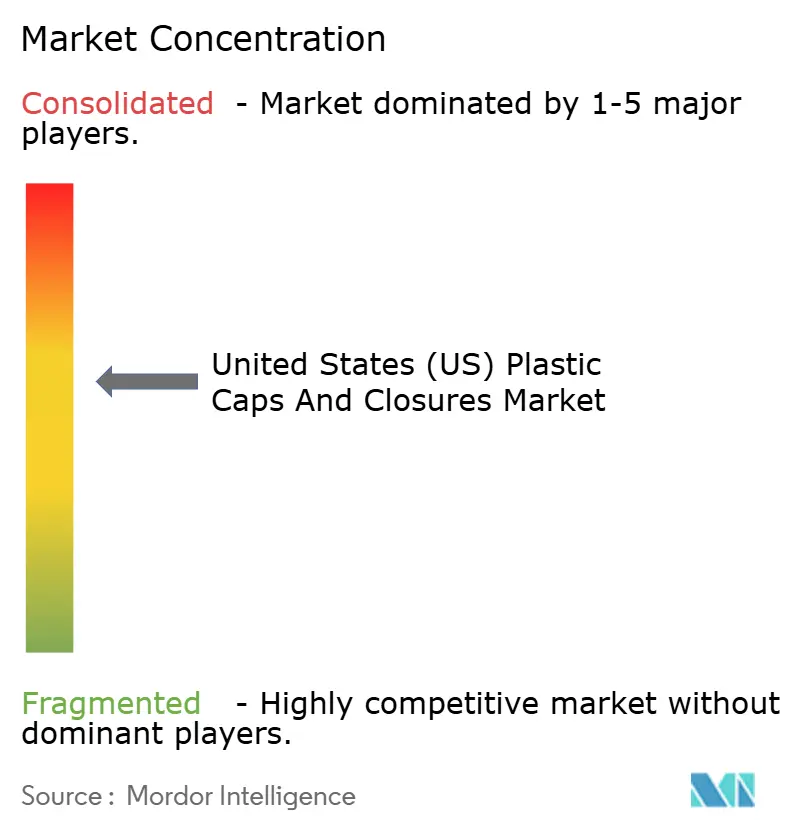
| Market Concentration | Medium |
Major Players *Disclaimer: Major Players sorted in no particular order Image © Mordor Intelligence. Reuse requires attribution under CC BY 4.0. | |
United States (US) Plastic Caps and Closures Market Analysis by Mordor Intelligence
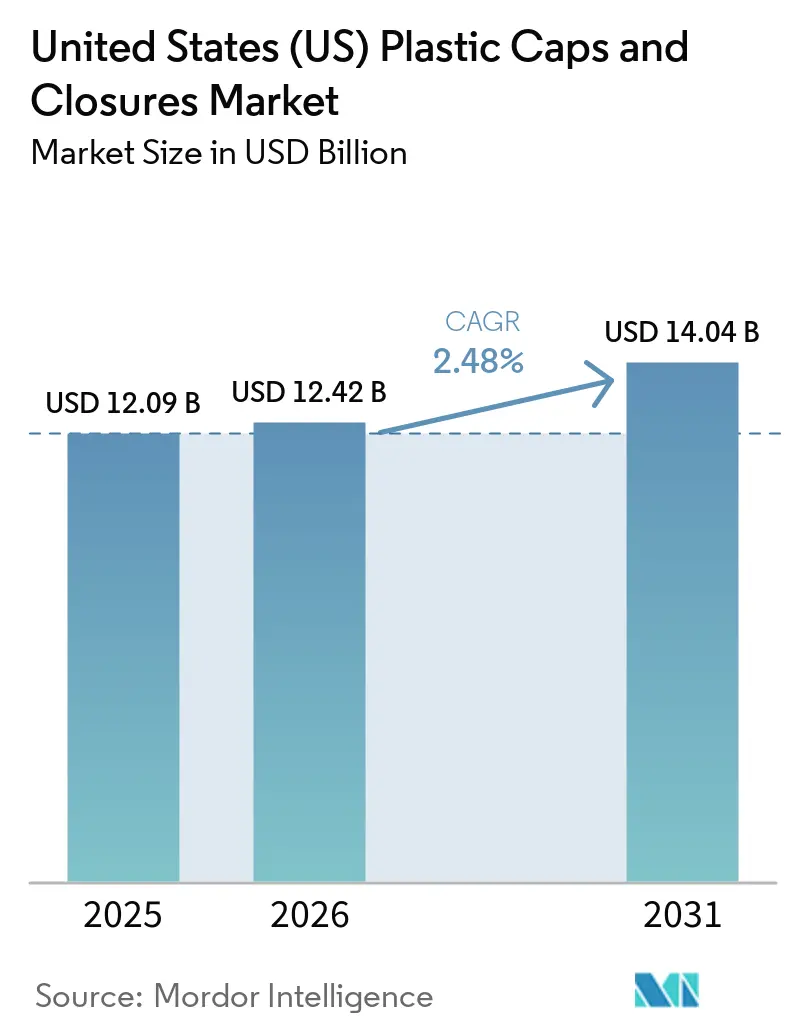
The United States Plastic Caps And Closures Market size is projected to expand from USD 12.09 billion in 2025 and USD 12.42 billion in 2026 to USD 14.04 billion by 2031, registering a CAGR of 2.48% between 2026 to 2031.
A mature demand base, rising functional-safety expectations, and tightening sustainability mandates shape growth. Beverage fillers and pharmaceutical packers continue to specify tamper-evident, child-resistant, and oxygen-barrier features, while California’s tethered-cap rule and federal discussion over single-use plastics force design changes that add tooling and resin complexity. Material substitution is underway as brand owners chase scope-3 emission reductions and look beyond legacy polypropylene toward biobased polyethylene terephthalate and polyhydroxyalkanoates. At the same time, private-label molders undercut headline suppliers by up to 20% on commodity screw caps, intensifying price competition. Domestic reshoring of high-speed compression-molding capacity counters supply-chain shocks, but volatility in polypropylene prices still squeezes converter margins.
Key Report Takeaways
- By material, polypropylene held 43.21% share in 2025, while biobased polyethylene terephthalate is forecast to grow at a 3.56% CAGR through 2031.
- By end-user industry, beverages led with 57.21% volume share in 2025; cosmetics and toiletries are projected to advance at a 3.71% CAGR to 2031.
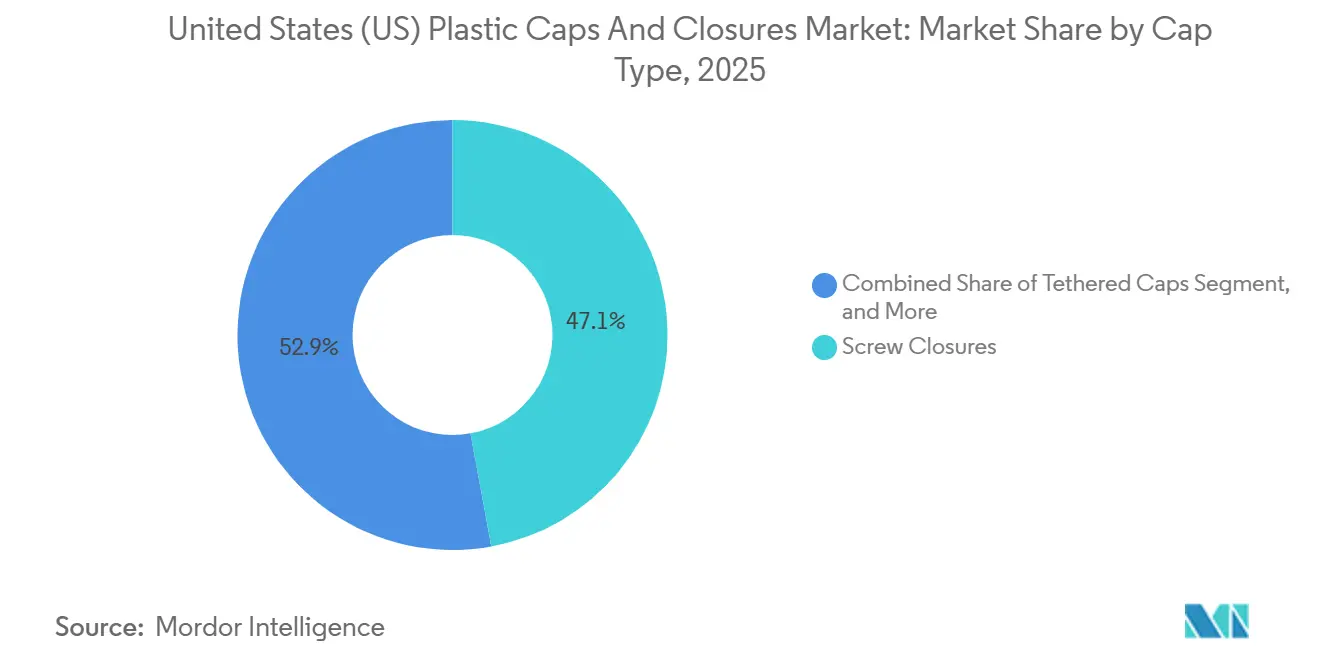
- By cap type, screw closures captured 47.12% of unit shipments in 2025; tethered caps are on track for a 3.67% CAGR through 2031.
- By manufacturing technology, compression molding accounted for 51.21% revenue share in 2025, whereas digitally printed smart closures will post a 3.06% CAGR to 2031.
Note: Market size and forecast figures in this report are generated using Mordor Intelligence’s proprietary estimation framework, updated with the latest available data and insights as of 2026.
United States (US) Plastic Caps and Closures Market Trends and Insights
Drivers Impact Analysis*
| Driver | (~) % Impact on CAGR Forecast | Geographic Relevance | Impact Timeline |
|---|---|---|---|
| Surge in Demand for Convenient Packaged Beverages | +0.8% | National, Sun Belt concentration | Short term (≤2 years) |
| Growth of E-Commerce Requiring Tamper-Evident Designs | +0.6% | National, urban fulfillment hubs | Medium term (2-4 years) |
| Adoption of Tethered Cap Legislation | +0.5% | California, potential Northeast spillover | Medium term (2-4 years) |
| Expanding Pharmaceutical Packaging Requirements | +0.4% | National clusters in New Jersey, North Carolina | Long term (≥4 years) |
| Shift Toward Lightweight Plastic Over Metal Closures | +0.3% | National beverage and food sectors | Medium term (2-4 years) |
| Reshoring via High-Speed Compression-Molding Capacity | +0.2% | Midwest and Southeast corridors | Long term (≥4 years) |
| Source: Mordor Intelligence | |||
Surge in Demand for Convenient Packaged Beverages
Single-serve coffee, functional waters, and protein shakes lifted 2025 unit volumes for ready-to-drink beverages by 7.2%, expanding shelf space for flip-top and snap-on sports caps in convenience stores that account for 34% of national beverage transactions.[1] Keurig Dr Pepper reported that resealability influenced 62% of consumer purchase decisions in 2025, up eight percentage points in two years, highlighting closure functionality as a brand lever.[2] Closure suppliers responded with polypropylene flip-tops integrating silicone valves to avoid leaks during e-commerce parcel drops. As beverage brands accelerate limited-edition flavors tied to social-media trends, early co-development of closure specifications with molders trims commercialization timelines. These factors collectively reinforce demand for high-throughput molding cells and precise gating that maintain carbonation integrity.
Growth of E-Commerce Requiring Tamper-Evident Designs
Online grocery penetration reached 12.3% of total U.S. food and beverage sales in 2025, adding extra handling touchpoints that elevate tampering risk. Federal rules already oblige over-the-counter drugs to display visible evidence of entry, and large e-tailers now extend the same expectation to premium food oils and nutritional powders. AptarGroup’s SimpliSqueeze valve, launched in March 2025, integrates a breakaway ring, eliminates induction seals, and cuts assembly-line complexity by 20%. Fulfillment centers also specify closures that survive 1.2-meter drop tests, twice the height of conventional store shelving, prompting molders to thicken walls by 0.15 millimeters and adopt impact-modified polypropylene grades that remain ductile at sub-zero temperatures. These performance upgrades enlarge the average resin requirement per closure, partially offsetting lightweighting gains elsewhere in the package.
Adoption of Tethered Cap Legislation
California Senate Bill 459 mandates that beverage closures sold after January 2028 stay attached after opening, echoing the European Union’s directive enacted in 2024. Compliance accelerates tethered designs at a 3.67% CAGR through 2031 as national beverage brands pre-empt patchwork rules. Injection-molding tools require hinge-gate retrofits costing USD 80,000-120,000 per cavity, a capital burden manageable only with long-run contracts.[3] Closure Systems International’s 2024 pilot showed that hinge thickness above 0.6 millimeters hindered one-handed opening, whereas under 0.4 millimeters invited tearing. Advocacy group Beyond Plastics forecasts that 15 additional states will float similar bills by 2027, nudging converters toward a single nationwide spec.
Expanding Pharmaceutical Packaging Requirements
United States Pharmacopeia Chapter 661 revisions effective January 2025 raised helium-leak integrity thresholds for sterile injectables to 1×10⁻⁶ cc/s, favoring compression-molded closures with laminated elastomer liners. Pharmaceutical users held only 10% of closure volume in 2025 but generated one-fifth of revenue owing to stringent validation records and ISO 15378 cleanroom demands. Child-resistant closures compliant with Consumer Product Safety Commission protocol 16 CFR 1700.20 advanced 4.1% in 2025 unit sales as opioid prescriptions shifted toward abuse-deterrent formats guidance issued June 2024 doubled extractables-and-leachables monitoring to 24 months, lengthening commercialization timelines and rewarding incumbents with data packages. Together, the new rules elevate barriers to entry and sustain premium pricing on pharmaceutical caps.
Restraints Impact Analysis*
| Restraint | (~) % Impact on CAGR Forecast | Geographic Relevance | Impact Timeline |
|---|---|---|---|
| Volatility in Resin Prices | -0.6% | Gulf Coast integrated producers | Short term (≤2 years) |
| Competition From Sustainable Alternative Materials | -0.4% | Coastal markets with EPR mandates | Medium term (2-4 years) |
| Prospective Federal Single-Use Plastic Restrictions | -0.3% | National | Long term (≥4 years) |
| Microplastic Scrutiny Driving Liner-Less Closures | -0.2% | Food and beverage sectors | Medium term (2-4 years) |
| Source: Mordor Intelligence | |||
Volatility in Resin Prices
Polypropylene spot quotes swung from USD 0.62 to 0.81 per pound during 2025, tracking crude volatility and unplanned cracker outages along the Gulf Coast, a shift that shaved 200-300 basis points off converter EBITDA unless price escalators kicked in ICIS.COM. Small molders lacking scale to hedge resin exposure faced working-capital strain, motivating consolidation such as Berry Global’s 2024 purchase of three regional plants. Forward-buying locks in margins yet ties up warehouse capacity, limiting flexibility to trial biobased resins that trade at 20-30% premiums. HDPE displayed similar turbulence before new ethane-cracker capacity eased supply in late 2025. Persistent resin swings complicate long-term budgeting for tethered-cap tooling and NFC-enabled smart closures that already demand higher-grade compounds.
Competition From Sustainable Alternative Materials
Aluminum screw caps migrated beyond wine to premium juices and cold-brew coffee in 2025, winning 2-3% beverage-closure share on infinite recyclability claims. Fiber-based closures molded from wood pulp advanced in pilot runs for organic brands, though water sensitivity still triples oxygen ingress versus polypropylene. Four U.S. states now charge higher EPR fees on less recyclable plastics, nudging brands toward metal. The Sustainable Packaging Coalition found 41% of CPG companies plan to evaluate non-plastic closures by 2027, up from 28% in 2023.[4] Plastic-closure suppliers counter by increasing PCR content and trialing carbon-negative PET from Origin Materials, but adoption lags when retail price points cannot absorb material premiums.
*Our forecasts treat driver/restraint impacts as directional, not additive. The impact forecasts reflect baseline growth, mix effects, and variable interactions.
Segment Analysis
By Material: Biobased PET Gains Traction as Carbon Accounting Intensifies
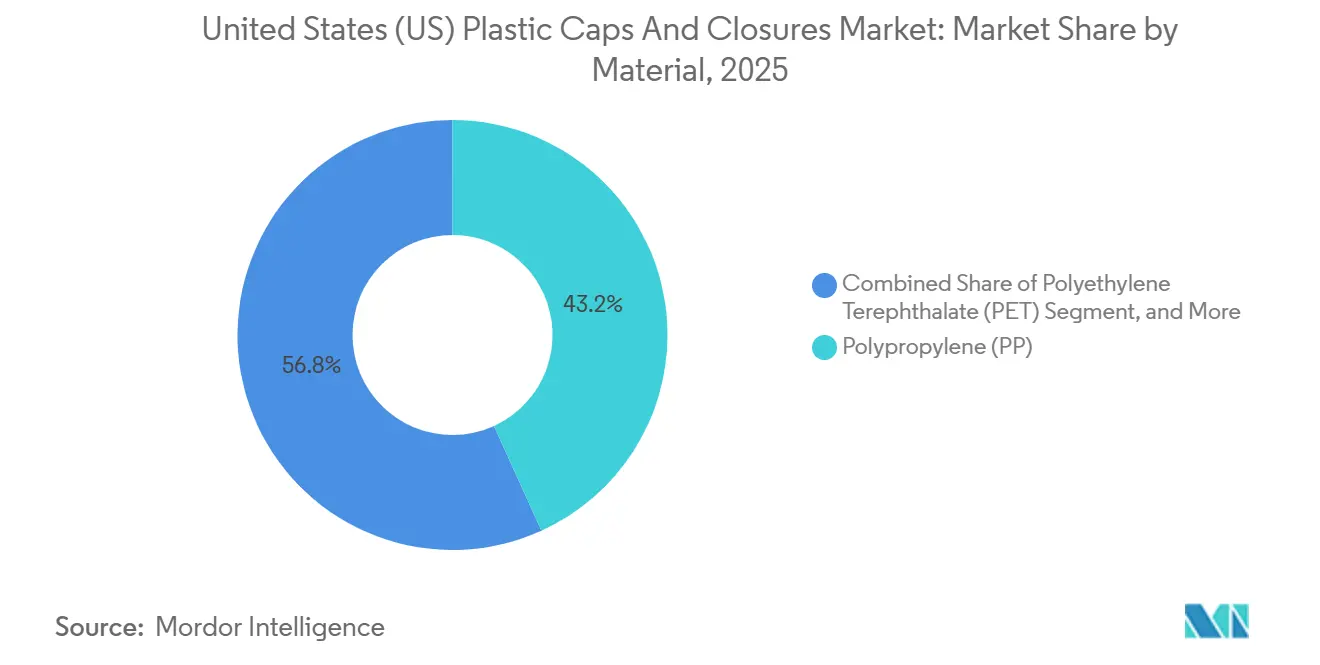
Polypropylene captured 43.21% of 2025 shipments, underpinned by melt-flow rates that suit high-cavitation injection molds. Biobased PET, however, is positioned for the fastest climb at 3.56% CAGR, as CPG firms pursue verifiable scope-3 cuts. Danimer Scientific’s PHA closures launched with a West Coast kombucha label in April 2025, commanding a 25% shelf premium and validating marine-biodegradation claims. The United States plastic caps and closures market size for biobased PET is projected to expand alongside secure feedstock contracts that shield against fossil-feedstock price spikes. Feedstock and material innovation are influencing the wider United States caps and closures market. The Association of Plastic Recyclers reported 92% sortation accuracy for natural HDPE caps in 2025, reinforcing HDPE’s role in dairy and household-chemical supply chains. Origin Materials’ carbon-negative PET secured a USD 150 million beverage offtake in September 2025, signaling mainstream scaling by 2027 and lifting the United States plastic caps and closures market share for bio-resins once volume pricing narrows the gap with conventional polymers.
California Assembly Bill 1200 requires 15% PCR in beverage closures by 2030, indirectly encouraging closed-loop polypropylene streams. Molders report tensile-strength losses of 6-8% when running 25% PCR PP, requiring thicker walls that partially offset weight-reduction gains. Avantium’s polyethylene furanoate remains in pilot scale, but its superior gas barrier may create a niche for carbonated drinks by 2028. As resin options proliferate, tool-steel selection and gate design will dictate whether converters can switch between conventional and bio-grades without costly hot-runner rebuilds.

By End-User Industry: Airless Dispensing Accelerates Cosmetics Growth
Beverages remained the anchor, controlling 57.21% of 2025 volume; yet airless pump demand from prestige skincare pushes cosmetics and toiletries closures toward a 3.71% CAGR through 2031. The United States plastic caps and closures market size for cosmetics is expanding as airless systems extend shelf life and reduce preservatives, a marketing claim resonating with ingredient-conscious consumers. Meal-kit adoption lifted flip-top food closures 9.3% in 2025, while Henkel’s twist-and-measure cap cut detergent waste 12%, underscoring functional value. Pharmaceutical caps generated only 10% of units yet carried pricing power due to ISO-validated documentation. Luxury brands partnered with Loop to trial magnetic screw closures returned for refill, reducing single-use plastic by 70% over a product's life. Collectively, these shifts diversify demand beyond high-volume soda and water lines, buffering the United States plastic caps and closures market against flat per-capita soft-drink consumption.
Refill systems challenge volume growth but unlock higher unit margins through complex mechanisms and metallic overcaps. Child-resistant pharmaceutical closures added a revenue uplift of USD 0.08-0.12 per piece, reinforcing segmentation between commodity and specialty applications. The United States plastic caps and closures industry therefore navigates a dual-track future: one path dominated by ultra-high-speed screw caps where pennies matter, and another where premium cosmetics and drug closures command double-digit margins.
By Cap Type: Tethered Designs Reshape Investment Priorities
Screw caps accounted for 47.12% of 2025 shipments, supported by carbonation retention needs in soft drinks and resealability in bottled water. The United States plastic caps and closures market share for tethered designs is forecast to climb rapidly once California’s 2028 deadline triggers national harmonization. Early prototypes increased the opening force 30%, but hinge refinement to 0.52 millimeters restored ergonomics without raising resin usage. Child-resistant caps advanced 4.1% in 2025, driven by abuse-deterrent opioid packaging. Luxury overcaps with metallized finishes captured 6-8% value share, skewing toward spirits and prestige fragrance. Dispensing closures, including pumps and dosing chambers, benefited from e-commerce leakage tests and now account for nearly 12% of units.
Tethered-cap tooling costs magnify the gap between large beverage contracts and short-run specialty orders. Yet the United States plastic caps and closures market size for smart closures embedding NFC tags is poised to grow alongside spirits serialization mandates from the Alcohol and Tobacco Tax and Trade Bureau pilot slated for 2027. These segments together push converters to juggle high-speed commodity lines with value-added microbatch runs on flexible presses.
By Manufacturing Technology: Digital Printing Unlocks Smart Features
Compression molding led with 51.21% revenue in 2025, prized for tight tolerances and co-molded liners that meet USP Chapter 661 helium-leak limits. Injection molding maintained 35-38% share, benefiting from servo-electric presses that trim cycle times to five seconds and cut energy draw 30-40%. The United States plastic caps and closures market size for digital printing remains small, yet a 3.06% CAGR through 2031 reflects spirits brands embracing QR or NFC codes for authentication. Avery Dennison’s Janela platform logged 1.2 million taps within six months of a premium-tequila launch in late 2024, proving consumer appetite for interactive packaging.
Three-piece and in-line assemblies accounted for roughly 9% of output, serving pharmaceutical and nutraceutical closures where hermetic seals trump line speed. Additive-manufactured conformal cooling channels now reduce injection-mold cycle times up to 22%, freeing capacity for low-volume smart closures. In aggregate, process choice aligns with end-market requirements, forcing converters to balance capital investment between ultra-fast rotary compression systems and flexible hybrid cells capable of rapid color or material changeovers.
Geography Analysis
Production capacity clusters in the Southeast and Midwest, regions that host 45% of beverage bottling and 50% of pharmaceutical contract filling plants. The United States plastic caps and closures market size in the Southeast benefits from proximity to Gulf Coast resin complexes, lowering freight costs and ensuring resin availability during hurricane season disruptions. California stands as a policy trendsetter, with its extended producer responsibility and tethered-cap statutes raising compliance costs but also guiding nationwide design baselines. Reshoring momentum accelerated after supply-chain disruptions in 2021-2022; Silgan’s Georgia acquisition cut lead times to three weeks versus 12 weeks for Asian imports, illustrating the business case for domestic capacity.
Infrastructure Investment and Jobs Act funds have improved rail and port throughput, reducing resin drayage times 15-20% and slightly offsetting higher U.S. labor costs. E-commerce fulfillment hubs in Texas, Pennsylvania, and Illinois demand drop-resistant closures for cold-chain parcels, encouraging regional molders to adopt impact-modified polypropylene grades. Maine and Colorado now levy tiered EPR fees on closures with low recyclability, nudging brand owners toward natural HDPE and PCR polypropylene formulations in those states.
Prestige cosmetics headquarters in New York and New Jersey pull decorative-closure demand into the Northeast, while child-resistant pharmaceutical closures concentrate around New Jersey’s biopharma corridor and North Carolina’s Research Triangle. The Gulf Coast remains a resin pipeline, but storm exposure keeps contingency plans active, including inventory buffers in inland warehouses. Overall, geographic fragmentation based on regulatory, logistics, and end-market factors creates opportunities for localized niche molders within the broader United States plastic caps and closures market.
Regulatory Landscape
US caps and closures compliance is increasingly shaped by state-led packaging policy. As of July 2026, seven states have enacted packaging Extended Producer Responsibility (EPR) laws, including Maine, Oregon, Colorado, California, Minnesota, Maryland, and Washington, raising reporting, fee, and recyclability requirements for packaging components such as caps and lids across multi-state brand portfolios.
Food-contact and environmental compliance are also tightening in ways that affect material and additive choices for closures. A January 6, 2025 Federal Register action ended authorization for certain PFAS-based grease-proofing agents in food-contact applications, reinforcing a shift toward alternative barrier and processing aids. Federal scrutiny of environmental marketing claims is also active, with H.R. 6832 (119th Congress) proposing updates tied to standardized resin identification and recyclability terminology (referencing ASTM D7611/D7611M-19). This raises the need for substantiation for recyclability and recycled-content claims used on closure and label copy.
Value Chain Analysis
The value chain starts with resin and additive supply (PP, HDPE, PET, and emerging bio-based or recycled grades), then moves into toolmaking and molding (high-cavitation injection molding, compression molding, and specialty dispensing assemblies), and finally reaches filling lines for beverages, food, pharma, and personal care. For food-contact applications, an additional gatekeeping step is FDA food-contact substance compliance, which can extend qualification cycles for new recycled or bio-based formulations and increases demand for consistent certification and traceability across resin, colorant, and masterbatch inputs.
Downstream, brand-owner specifications and state EPR programs are pulling more players into circularity partnerships that secure higher-quality PCR and improve recovery of small-format items that are often lost in sorting. In 2026, Reliable Caps partnered with PureCycle Technologies to offer closures for contact-sensitive applications using up to 75% certified PCR via PureFive recycled polypropylene, while PureCycle and StackTeck demonstrated a living-hinge cap made with up to 100% recycled PureFive resin. Together, these efforts underline the tooling and process tuning needed to run recycled PP in performance-critical geometries. Collection and recovery remain bottlenecks for caps and lids, and California-focused field testing to improve recovery of small-format plastics is being used to prepare for state recycling reform and EPR implementation, linking on-pack design choices to material access and fee outcomes.
Competitive Landscape
The U.S. plastic caps and closures market is moderately concentrated, with the top five suppliers projected to command 60% of the 2025 revenue. However, these industry leaders face stiff competition from low-cost regional challengers. In a strategic move, Silgan bolstered its position by acquiring a Georgia facility in 2024, adding a capacity of 2 billion units, and setting the stage for a lead in the upcoming biosimilar launches through 2028. Meanwhile, AptarGroup is carving out its niche with its innovative SimpliSqueeze valves, which eliminate foil seals and streamline production lines. This feature has seen rapid adoption among brands in the condiment and functional beverage sectors. As California's 2028 deadline approaches, Closure Systems International and Berry Global are making strategic investments in tethered-cap hinge patents. Crown Holdings, on the other hand, is leveraging its metallurgy expertise to introduce aluminum screw caps to the premium juice market.
Regional players like Phoenix Closures are harnessing additive-manufactured tools, drastically reducing prototype lead times to just six weeks. This agility allows them to undertake specialty runs of fewer than 100,000 units, a segment often overlooked by larger multinationals. In the realm of smart closures, strategies diverge: established players are collaborating with Avery Dennison for NFC integrations, while mid-tier companies are honing in on PCR polypropylene differentiation. This focus aims to mitigate Extended Producer Responsibility (EPR) fees, particularly in states like Maine and Colorado. Patent activity in 2025 saw a concentration on hinge geometries and child-resistant torque reductions, catering to the senior demographic, which U.S. Census data highlights at a notable 58 million in the 65-plus age bracket. This underscores a growing demand for ergonomic solutions.
Material science newcomers are venturing into the realm of closures, eyeing the commercial potential of PHA and carbon-negative PET. However, the current unit economics tether their adoption primarily to premium SKUs, with hopes that scaling will eventually drive down resin costs.
United States (US) Plastic Caps and Closures Industry Leaders
-
Silgan Holdings Inc.
-
AptarGroup, Inc.
-
Amcor plc
-
Albéa S.A.
-
TriMas Corporation
- *Disclaimer: Major Players sorted in no particular order
Market Opportunities and Future Outlook
A key whitespace is high-PCR and certified recycled polypropylene closures that meet contact-sensitive performance and compliance requirements for food, beverage, and personal care. The May 2026 Reliable Caps and PureCycle partnership, targeting closures with up to 75% certified PCR content using PureFive Ultra recycled PP, points to an addressable pathway for converters to move beyond low-PCR commodity caps into higher-value programs where documentation, odor and contaminant control, and consistent processing windows matter.
Policy-driven circularity also creates opportunity in designs that reduce EPR fees and improve recyclability outcomes across states. California SB 54 provides a concrete compliance anchor for producers by requiring outcomes by 2032 (including a 25% reduction in plastic packaging and 65% recyclability/compostability for covered plastic packaging), and ecomodulated fee structures in EPR programs increase the financial upside for tethered, mono-material, and readily sortable closure designs. Federal attention to recycling infrastructure supports participation across the chain as well; in May 2026, the House Energy and Commerce Committee advanced the Recycling Infrastructure and Accessibility Act (H.R. 2145) and the Recycling and Composting Accountability Act (H.R. 4109). Together, these steps align with industry efforts to expand collection and processing capacity, which in turn affects PCR availability for closures.
Recent Industry Developments
- July 2026: Aptar Closures expanded its e-commerce-ready closure portfolio for beauty, personal care, and home care applications. The update reflects ongoing design optimization around leakage resistance and durability in parcel shipping, strengthening supplier positioning with brands that are standardizing packaging for omnichannel distribution.
- November 2025: Silgan Holdings completed the acquisition of a North Carolina compression-molding facility, adding about 1.8 billion units of pharmaceutical-closure capacity. The addition increases domestic supply for regulated healthcare applications where validated processes and lead-time reliability influence supplier selection.
- September 2025: Origin Materials signed a USD 150 million offtake agreement with a global beverage group for carbon-negative PET feedstock used in closure resin through 2030. The agreement supports scale-up of lower-carbon material options and gives closure converters a clearer procurement route when brand owners require quantified scope-3 reductions.
Research Methodology Framework and Report Scope
Market Definition and Coverage
This market covers revenue earned in the United States from plastic caps and closures used to seal and dispense packaged products across consumer and industrial applications, counted at the point where caps and closures are sold into packaging supply chains.
Scope exclusions: Excludes non-plastic caps and closures, and it also excludes upstream polymer resin production and downstream filling, labeling, and full-container packaging services.
Segmentation Overview
- By Material
- Polyethylene Terephthalate (PET)
- Polypropylene (PP)
- Low-Density Polyethylene (LDPE)
- High-Density Polyethylene (HDPE)
- Other Materials
- By End-User Industry
- Beverage
- Food
- Pharmaceutical and Healthcare
- Cosmetics and Toiletries
- Household Chemicals
- Other End-User Industries
- By Cap Type
- Screw Closures
- Tethered Caps
- Flip-Top and Snap-On Caps
- Child-Resistant Closures
- Luxury/Premium Decorative Closures
- Dispensing Caps
- By Manufacturing Technology
- Injection Molding
- Compression Molding
- 3-Piece and In-Line Assembly
- Digitally Printed Smart Closures
Data Sources, Market Sizing, and Validation
Desk Research
To ground the model, we first compiled a clean view of packaging demand and plastics conversion activity in the United States. Public sources were used to map market context and constraints, such as US Census Bureau manufacturing and trade tables, US International Trade Commission data, US Environmental Protection Agency packaging and recycling indicators, and FDA packaging related guidance for regulated end uses. We also reviewed association publications for plastics and packaging, and peer-reviewed journal articles that discuss closure performance, tethered designs, and lightweighting trends.
After that, we filled company and channel context using items such as annual reports, investor presentations, and press releases, which helped us understand product mix and pricing logic used in different end uses. Where it supported consistency checks, we also referenced paid subscriptions that compile company financials and news, patent databases, and shipment-level import and export records for plastics articles. The sources listed here are illustrative only, since many additional public and paid references were consulted to collect data, validate assumptions, and clarify gaps.
Primary Interviews and Surveys
Primary work was used to test the desk assumptions and remove blind spots around cap types, resin mix, and pricing changes through the year. We spoke with a spread of manufacturers, converters, packaging buyers, and downstream stakeholders, and we checked views across major US demand pockets so our assumptions matched real procurement behavior. When differences appeared, we re-contacted selected experts to align on the most defensible ranges before locking the final totals.
Distribution of primary research fieldwork respondents
| Company type | Respondent position |
|---|---|
| Top tier: 35% | CXOs: 14% |
| Mid tier: 47% | Functional/Unit leaders: 28% |
| Smaller Players: 18% | Managers: 58% |
Market-Sizing & Forecasting
The sizing starts from a top-down demand pool, where packaging output and consumption signals are reconstructed and then translated into closure needs by end use, before being converted into value using average selling price ranges. Since closures are strongly tied to packaged food, beverages, home and personal care, and healthcare, we used indicators such as packaged product volumes, bottling and filling activity, closure-per-container norms, lightweighting rates, and resin price movements that influence finished-part pricing. For caps used in regulated or higher-performance packs, adjustment factors were applied to reflect higher specification designs and different pricing.
Once the top-level totals were formed, the result was checked using selective bottom-up approximations, including supplier revenue sampling, channel checks with packaging buyers, and a volume times price sanity test for a few high-usage cap families. When data was missing for smaller private participants, we used conservative proxy ranges based on capacity signals, product focus, and typical utilization, and then re-tested the impact on the total. Forecasting was run using scenario analysis supported by short trend models, with drivers such as packaged product demand, substitution to tethered formats, and resin and energy cost pass-through being reviewed with interview feedback before the final curve was set.
Data Validation & Update Cycle
Before sign-off, outputs are stress-tested against independent market signals, and then reviewed for year-to-year jumps that do not match known packaging demand patterns. We run variance checks across end-use totals, pricing ranges, and implied volumes, and any outliers trigger a second analyst review and follow-up questions to selected respondents. The report is refreshed annually, and interim updates are made when major events materially change demand, regulation, or input costs. Right before publication, a final pass is performed so the delivered view reflects the most recent public data and market developments.
Mordor Intelligence's United States Plastic Caps and Closures Market Sizing Compared With Other Published Estimates
Published market sizes can look far apart even when they are talking about the same country, because the boundary around what is counted is not always the same and because pricing and volume assumptions can be updated on different schedules. Differences also come from how each estimate treats resin-driven price movement, packaging demand softness or strength in the base year, and whether the model is cross-checked with independent indicators.
Packaging output signals, plastics conversion activity, and trade flow checks are the evidence points that keep Mordor Intelligence aligned to a plastic-only closure demand pool in the United States, with pricing tied to realistic ASP bands rather than broad packaging averages.
Benchmark comparison
| Source | Market Size | Gaps in Research Methodology |
|---|---|---|
| Mordor Intelligence | USD 12.09 B (2025) | |
| Industry Publisher A | USD 10.32 B (2025) | Often applies a tighter product scope and a more conservative ASP set, and it may also net out parts sold into industrial packaging and higher-spec healthcare uses, which lowers the value total. |
| Market Tracker B | USD 9.20 B (2024) | Uses a different base year and can embed a faster pricing roll-forward from resin cycles, and it may report a narrower plastic segment definition that is not fully reconciled to end-use container demand. |
Taken together, the spread mainly reflects scope boundary choices, base-year timing, and how price progression is handled for plastic parts. Our approach stays traceable because each step ties back to packaged product demand signals, reasonable closure usage factors, and interview-checked price bands that can be re-tested as conditions change.
Key Questions Answered in the Report
How large will demand be for biobased resins in U.S. plastic closures by 2031?
Biobased PET and PHA closures are forecast to grow at a 3.56% CAGR, moving from niche pilots toward mainstream adoption as supply scales and EPR fees favor low-carbon materials.
What regulatory factor will most affect cap-type design choices through 2031?
California’s tethered-cap mandate effective January 2028 is expected to set a de facto national standard, driving tooling investment and a 3.67% CAGR for tethered closures.
Why are compression-molded closures preferred in pharmaceutical packaging?
Compression molds can co-mold elastomer liners that pass helium-leak tests specified in USP Chapter 661, avoiding secondary gasket insertion and reducing particulate contamination.
Which manufacturing technology is gaining attention for anti-counterfeiting?
Digitally printed smart closures embedding NFC or QR codes are growing at a 3.06% CAGR as spirits brands prepare for federal serialization pilots.
How are resin price swings influencing supplier strategies?
Volatile polypropylene costs cut EBITDA margins by up to 300 basis points, encouraging forward-buying, resin hedging, and acquisitions that spread procurement risk.
What end-user segment shows the fastest growth outlook?
Cosmetics and toiletries closures are projected to rise at a 3.71% CAGR through 2031, driven by airless pump dispensers that extend product shelf life and support refill systems.