Market Overview
| Study Period | 2017 - 2030 |
|---|---|
| Base Year For Estimation | 2024 |
| Forecast Data Period | 2025 - 2030 |
| Market Size (2025) | USD 4.61 Billion |
| Market Size (2030) | USD 5.56 Billion |
| Growth Rate (2025 - 2030) | 3.79% CAGR |
| Market Concentration | Medium |
Major Players*Disclaimer: Major Players sorted in no particular order Image © Mordor Intelligence. Reuse requires attribution under CC BY 4.0. | |

United States Plant Protein Market Analysis by Mordor Intelligence
The United States Plant Protein Market size is estimated at 4.61 billion USD in 2025, and is expected to reach 5.56 billion USD by 2030, growing at a CAGR of 3.79% during the forecast period (2025-2030).
The United States plant protein industry is experiencing a fundamental shift driven by evolving consumer preferences and health consciousness. A significant transformation is evident in consumer behavior, with approximately 52% of Americans actively seeking healthier food options in 2022. This shift is particularly notable among millennials and Generation Z consumers, who are increasingly embracing plant-based protein trends across various product categories. The industry's response has been swift, with major food manufacturers reformulating their products to incorporate plant protein while maintaining taste and texture profiles that appeal to mainstream consumers. This evolution is further supported by advancements in protein extraction and processing technologies, enabling better functionality and improved organoleptic properties.
The market landscape is being reshaped by innovative product development and strategic industry collaborations. In 2023, companies like Roquette demonstrated this trend by launching novel rice protein solutions specifically designed for meat substitute applications, showcasing the industry's commitment to diversification and product innovation. The convergence of food technology and consumer demands has led to the emergence of hybrid products that combine plant and traditional proteins, offering a transitional option for flexitarian consumers. This innovation wave extends beyond product formulation to include sustainable protein sourcing practices and transparent supply chain initiatives, addressing growing consumer concerns about environmental impact and ingredient traceability.
Health and wellness considerations continue to drive market dynamics, with approximately 200 million American shoppers following specific dietary or health-related programs in 2022. The industry is responding to this trend by developing specialized plant protein products targeting specific health conditions and dietary requirements. The rising prevalence of food allergies and intolerances, with 36% of the US population being lactose-intolerant in 2022, has created substantial opportunities for growth in the plant-based protein market. Manufacturers are increasingly focusing on clean-label formulations and allergen-free options, while also fortifying their products with additional nutrients to meet comprehensive nutritional requirements.
The regulatory landscape and quality standards are evolving to keep pace with market innovations. The FDA's ongoing refinement of labeling requirements for plant-based alternatives is shaping product positioning and marketing strategies. Industry players are investing in research and development to meet these evolving standards while maintaining product quality and safety. The sector is witnessing increased collaboration between ingredient suppliers and food manufacturers to develop standardized testing protocols and quality metrics for plant protein ingredients. This focus on quality assurance is particularly evident in the supplements segment, where manufacturers are implementing rigorous testing procedures to ensure protein quality and bioavailability in their products.
United States Plant Protein Market Trends and Insights
Growth in plant protein consumption provides opportunities for key players in the ingredients market
- The per capita consumption rate of plant proteins is increasing at a considerable rate in the United States, supported by investments and innovations, resulting in a consumption rate of 40.28 grams per day, primarily due to a rising number of consumers turning vegan to promote animal welfare. This is because factory farming, where animals are maltreated, is a norm in the United States. Most Americans eat less meat and animal products, but they do not eliminate their consumption entirely. They also tend to be more flexitarian than vegan or vegetarian. Nearly 12% of consumers in the country prefer a plant-based diet, whereas 7% of consumers follow a flexitarian diet. Although consumers of all generations in the United States are interested in plant-based meals, individuals in their 20s and 30s are the keenest to adopt plant-based diets.
- There is a constant rise in the per capita consumption of pea protein due to its wide applications in different food products, like meat, poultry, and bakery products. Around 41% of consumers are interested in plant-based food derived from pea protein. Pea protein is mainly used in sports nutrition and meat alternatives. A typical serving of pea protein powder is 30 grams, with 25 grams of protein. Athletes usually use one serving per day but may take as many as three servings per day.
- Soy and whey proteins are used primarily in the food and beverage, supplement, and sports nutrition industries. In 2021, around 36% of consumers were familiar with soy protein and had consumed the same, whereas 31% of individuals consumed whey protein in the US. Similarly, the consumption of soy-based food and beverages favorably increased by 12.9% during 2014-2019, and it is likely to remain consistent throughout the forecast period.

Understand The Key Trends Shaping This Market
Download PDF
Soy, wheat, and pea production contributes majorly as raw material for plant protein ingredients manufacturers
- The graph given depicts the production data for raw materials such as dry peas, rice, wheat, and soya beans. There is an increasing scope for plant protein ingredients in the country due to the production recorded during the review period. The United States produces about one-third of the total soybeans in the world, followed closely by Brazil and Argentina. In 2021, the country produced 119.88 million MT of soybeans and accounted for 31% of the global soybean production. Wheat ranks third among the US field crops in planted acreage, production, and gross farm receipts behind corn and soybeans. In the marketing year 2023/24, the US farmers produced a total of 1.8 billion bushels of winter, durum, and other spring wheat from a harvested area of 37.3 million acres. Winter wheat production represents nearly 70% of total US production, on average.
- Hard red spring (HRS) wheat is one of the major wheat categories, accounting for almost 20% of the production. It is grown primarily in the northern plains, like North Dakota, Montana, Minnesota, and South Dakota. Hard red spring wheat is valued for its high protein level, making it suitable for specialty bread and blending with lower-protein wheat. Major restraints for the wheat protein market are the rising interest in gluten-free foods and the revived interest in low-carbohydrate diets. These may reduce the level of wheat consumption.
- Arkansas Grand Prairie, Mississippi Delta, Gulf Coast, and Sacramento Valley of California are four regions producing almost the entire US rice crop. Each of these regions normally specializes in a specific type of rice, referred to in the United States by length of grain, i.e., long, medium, and short. In general, long-grain production accounts for approximately 75% of the US rice production.

Understand The Key Trends Shaping This Market
Download PDF
OTHER KEY INDUSTRY TRENDS COVERED IN THE REPORT
- Baby food is expected to witness steady growth post-pandemic
- Innovation is expected to help maintain a steady growth rate
- Consumer preferences are shifting to premium condiments and sauces, away from packaged soups
- Dairy alternatives are expected to witness a significant growth rate
- There are great opportunities for meat alternative products
- Key players focused more on healthy ingredients post-COVID-19
- Rising US feed exports and feed prices are expected to impact production
- Soy, wheat, and pea production contributes majorly as raw material for plant protein ingredients manufacturers
- The growth of the bakery industry is led by large commercial players
- Sustainable and innovative packaging trends are expected to influence the breakfast cereal market
- Key players are expected to focus on fortification and nutritional enrichment
- The emphasis on awareness and innovation is the driving force behind the growth of the elderly nutrition market
- E-commerce is expected to emerge as one of the most preferred channels
- Sport/performance nutrition is expected to witness significant growth during the forecast period
- The US cosmetics industry is expected to be driven by the synergy of innovation and social media influence
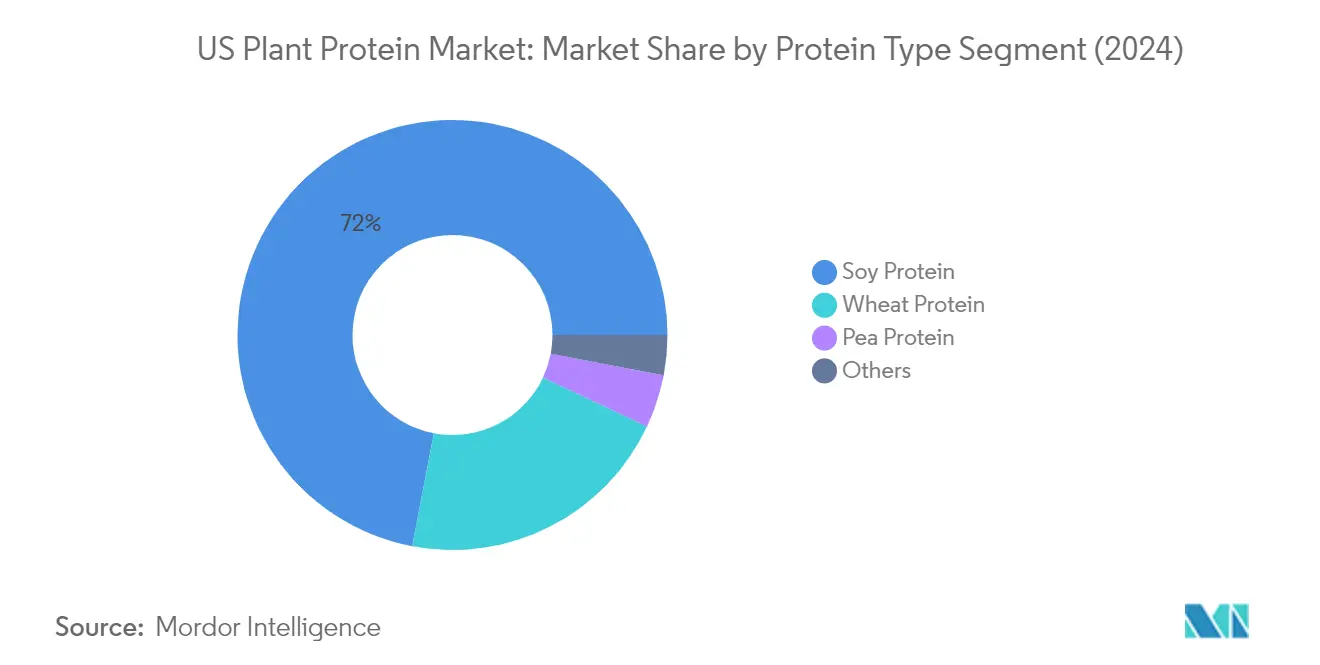
Segment Analysis: Protein Type
Soy Protein Segment in US Plant Protein Market
Soy protein dominates the US plant protein market, commanding approximately 72% market share in 2024, primarily due to its versatile applications across food and beverage industries. The segment's leadership position is attributed to soy protein's complete amino acid profile compared to other plant-based proteins, making it comparable to animal protein sources. Its widespread adoption in meat alternatives, dairy alternatives, and the animal feed industry has solidified its market position. The segment's growth is further supported by soy protein's multifunctional traits like high dispersibility, solubility, and its ability to enhance texture and flavor in various applications, particularly in meat alternatives where it effectively mimics muscle texture.
Pea Protein Segment in US Plant Protein Market
The pea protein segment is experiencing remarkable growth in the US plant protein market, projected to expand at approximately 5% CAGR during 2024-2029. This growth is primarily driven by increasing applications in meat alternatives, where pea protein serves as a hypoallergenic alternative to mainstream protein sources. The segment's expansion is further supported by pea protein's rising popularity in sports nutrition products, where it demonstrates efficiency in muscle protein synthesis and athletic performance enhancement. The increasing consumer preference for clean-label, non-GMO, and allergen-free products has also contributed to pea protein's growing adoption across various applications, including beverages, snacks, and bakery products.
Remaining Segments in Protein Type
The US plant protein market encompasses several other significant segments including wheat protein, rice protein, hemp protein, potato protein, and other specialized plant proteins. Wheat protein has established itself as a crucial ingredient in bakery applications and meat alternatives due to its unique functional properties. Rice protein has gained traction as a hypoallergenic option, particularly appealing to consumers with food sensitivities. Hemp protein has carved out a niche in the health food sector due to its nutritional profile and sustainability credentials. Potato protein, while smaller in market share, serves specific applications in food processing and animal nutrition. These diverse protein sources collectively contribute to the market's depth and ability to meet varied consumer preferences and application requirements.
Segment Analysis: End User
Food & Beverages Segment in US Plant Protein Market
The Food & Beverages segment dominates the US plant protein market, commanding approximately 60% of the total market share in 2024. This substantial market position is primarily driven by the increasing preference for plant-based foods as sustainable alternatives across various applications. The meat alternative products sub-segment leads the F&B applications with a significant share of 38% by volume, followed closely by dairy alternative products. The rapid expansion of plant-based meats, which are now widely available in grocery stores and offered in fast-food restaurants, has made these diets more convenient and easier to maintain. The segment's growth is further supported by the rising utilization of plant proteins in dairy alternatives, bakery products, and beverages, as consumers increasingly seek healthier and more sustainable food options.
Supplements Segment in US Plant Protein Market
The plant-based protein supplements market is experiencing remarkable growth in the US plant protein market, projected to expand at a rate of approximately 6% during 2024-2029. This accelerated growth is attributed to the segment's immense health benefits and increasing consumer awareness. Plant protein powder's rich fiber content and nutrient density make it a superior alternative to dairy protein powder, particularly appealing to health-conscious consumers. The segment's growth is particularly driven by sports nutrition applications, where plant proteins like rice and peas are gaining popularity for being hypoallergenic and providing a nutritious alternative for people with lactose intolerance. The rising number of fitness enthusiasts and their growing reliance on protein ingredients continues to fuel the demand for plant-based supplements in the United States.
Remaining Segments in End User Segmentation
The Animal Feed and Personal Care & Cosmetics segments complete the end-user landscape of the US plant protein market. The Animal Feed segment maintains a significant presence, driven by the increasing demand for sustainable and protein-rich animal nutrition solutions, particularly in poultry and livestock applications. The Personal Care & Cosmetics segment, while smaller in market share, is gaining traction due to the rising demand for natural and plant-based ingredients in beauty and personal care products. Both segments benefit from ongoing innovations in plant protein applications and increasing consumer preference for sustainable and natural ingredients across all end-use categories.
Competitive Landscape
Top Companies in United States Plant Protein Market
The US plant protein market is characterized by companies actively pursuing product innovation through extensive R&D investments to develop novel protein ingredients and applications. Major plant protein suppliers are demonstrating operational agility by modernizing their manufacturing facilities, implementing advanced processing technologies, and strengthening their supply chain networks to ensure consistent raw material availability. Strategic partnerships with food manufacturers, agricultural producers, and research institutions have become increasingly common to enhance technical capabilities and market reach. Companies are expanding their geographical presence through facility acquisitions and new plant constructions, particularly in protein-rich agricultural regions, while also broadening their product portfolios to include diverse protein sources beyond traditional soy and wheat proteins.
Consolidated Market Led By Global Players
The US plant protein market exhibits a consolidated structure dominated by large multinational corporations with diverse product portfolios spanning multiple protein sources and applications. These established players leverage their extensive distribution networks, technical expertise, and significant R&D capabilities to maintain their market positions. The presence of global agricultural processors and ingredient specialists creates a competitive environment where vertical integration and economies of scale play crucial roles in determining market success.
Merger and acquisition activities have been instrumental in shaping the competitive landscape, with larger companies acquiring specialized plant protein producers and technology providers to enhance their capabilities and market presence. Companies are increasingly focusing on securing their supply chains through strategic partnerships with farmers and agricultural cooperatives, while also investing in sustainable and traceable sourcing practices to meet growing consumer demands for transparency and environmental responsibility.
Innovation and Sustainability Drive Future Success
For incumbent players to maintain and expand their market share, focusing on sustainable sourcing practices, clean-label solutions, and enhanced functionality of protein ingredients will be crucial. Companies must invest in next-generation processing technologies to improve protein quality and functionality while reducing environmental impact. Building strong relationships with end-users through collaborative product development and customized solutions will become increasingly important, as will the ability to provide comprehensive technical support and application expertise.
New entrants and challenger brands can gain ground by focusing on specialized market segments, novel protein sources, or unique processing technologies that address specific consumer needs or application challenges. Success will depend on developing differentiated value propositions, whether through superior sustainability credentials, enhanced nutritional profiles, or improved functionality. Companies must also navigate potential regulatory changes regarding protein content claims, labeling requirements, and environmental standards, while building resilience against substitution risks through continuous innovation and strong customer relationships. The role of plant-based protein companies in driving innovation cannot be overstated, as they continue to explore new avenues for growth and sustainability.
United States Plant Protein Industry Leaders
Archer Daniels Midland Company
Bunge Limited
CHS Inc.
International Flavors & Fragrances, Inc.
Kerry Group PLC
- *Disclaimer: Major Players sorted in no particular order

Need More Details on Market Players and Competitors?
Download PDF
Recent Industry Developments
- June 2022: Roquette, a plant-based protein manufacturer, released two novel rice proteins to address the market demand for meat substitute applications. The new Nutralys rice protein line includes a rice protein isolate and a rice protein concentrate.
- May 2022: BENEO, a subsidiary of Südzucker, entered a purchase agreement to acquire Meatless BV, a producer of functional ingredients. BENEO is expanding its existing product offering with the acquisition to offer an even broader range of texturizing solutions for meat and fish alternatives.
- February 2022: MGP Ingredients announced the construction of a new extrusion plant in Kansas to manufacture its ProTerra line of texturized proteins. The USD 16.7 million facility will be located next to the company's Atchison site and will initially produce up to 10 million pounds of ProTerra annually. The new plant will assist MGP in meeting the rising demand for its ProTerra product line, which comprises pea and wheat protein ingredients used in applications such as plant-based meat substitutes.
United States Plant Protein Market Report Scope
Hemp Protein, Pea Protein, Potato Protein, Rice Protein, Soy Protein, Wheat Protein are covered as segments by Protein Type. Animal Feed, Food and Beverages, Personal Care and Cosmetics, Supplements are covered as segments by End User.Protein Type
| Hemp Protein |
| Pea Protein |
| Potato Protein |
| Rice Protein |
| Soy Protein |
| Wheat Protein |
| Other Plant Protein |
End User
| Animal Feed | ||
| Food and Beverages | By Sub End User | Bakery |
| Beverages | ||
| Breakfast Cereals | ||
| Condiments/Sauces | ||
| Confectionery | ||
| Dairy and Dairy Alternative Products | ||
| Meat/Poultry/Seafood and Meat Alternative Products | ||
| RTE/RTC Food Products | ||
| Snacks | ||
| Personal Care and Cosmetics | ||
| Supplements | By Sub End User | Baby Food and Infant Formula |
| Elderly Nutrition and Medical Nutrition | ||
| Sport/Performance Nutrition | ||
| Protein Type | Hemp Protein | ||
| Pea Protein | |||
| Potato Protein | |||
| Rice Protein | |||
| Soy Protein | |||
| Wheat Protein | |||
| Other Plant Protein | |||
| End User | Animal Feed | ||
| Food and Beverages | By Sub End User | Bakery | |
| Beverages | |||
| Breakfast Cereals | |||
| Condiments/Sauces | |||
| Confectionery | |||
| Dairy and Dairy Alternative Products | |||
| Meat/Poultry/Seafood and Meat Alternative Products | |||
| RTE/RTC Food Products | |||
| Snacks | |||
| Personal Care and Cosmetics | |||
| Supplements | By Sub End User | Baby Food and Infant Formula | |
| Elderly Nutrition and Medical Nutrition | |||
| Sport/Performance Nutrition | |||
Need A Different Region or Segment?
Customize Now
Market Definition
- End User - The Protein Ingredients Market operates on a B2B basis. Food, Beverages, Supplements, Animal Feed, and Personal Care & Cosmetic manufacturers are considered to be end-consumers in the market studied. The scope excludes manufacturers buying liquid/dry whey to be used for application as a binding agent or thickener or other non-protein applications.
- Penetration Rate - Penetration Rate is defined as the percentage of Protein-Fortified End User Market Volume in the Overall End User Market Volume.
- Average Protein Content - Average protein content is the average protein content present per 100 g of product manufactured by all end-user companies considered under the scope of this report.
- End User Market Volume - End-user market volume is the consolidated volume of all types and forms of end-user products in the country or region.
| Keyword | Definition |
|---|---|
| Alpha-lactalbumin (α-Lactalbumin) | It is a protein that regulates the production of lactose in the milk of almost all mammalian species. |
| Amino acid | It is an organic compound that contains both amino and carboxylic acid functional groups, which are required for the synthesis of body protein and other important nitrogen-containing compounds, such as creatine, peptide hormones, and some neurotransmitters. |
| Blanching | It is the process of briefly heating vegetables with steam or boiling water. |
| BRC | British Retail Consortium |
| Bread improver | It is a flour-based blend of several components with specific functional properties designed to modify dough characteristics and give quality attributes to bread. |
| BSF | Black Soldier Fly |
| Caseinate | It is a substance produced by adding an alkali to acid casein, a derivative of casein. |
| Celiac disease | Celiac disease is an immune reaction to eating gluten, a protein found in wheat, barley, and rye. |
| Colostrum | It is a milky fluid that’s released by mammals that have recently given birth before breast milk production begins. |
| Concentrate | It is the least processed form of protein and has a protein content ranging from 40-90% by weight. |
| Dry protein basis | It refers to the percentage of "pure protein" present in a supplement after the water in it is completely removed through heat. |
| Dry whey | It is the product resulting from drying fresh whey which has been pasteurized and to which nothing has been added as a preservative. |
| Egg protein | It is a mixture of individual proteins, including ovalbumin, ovomucoid, ovoglobulin, conalbumin, vitellin, and vitellenin. |
| Emulsifier | It is a food additive that facilitates the blending of foods that are immiscible with one another, such as oil and water. |
| Enrichment | It is the process of addition of micronutrients that are lost during the processing of the product. |
| ERS | Economic Research Service of the USDA |
| Extrusion | It is the process of forcing soft mixed ingredients through an opening in a perforated plate or die designed to produce the required shape. The extruded food is then cut to a specific size by blades. |
| Fava | Also known as Faba, it is another word for yellow split beans. |
| FDA | Food and Drug Administration |
| Flaking | It is a process in which typically a cereal grain (like corn, wheat, or rice) is broken down into grits, cooked with flavors and syrups, and then pressed into flakes between cooled rollers. |
| Foaming agent | It is a food ingredient that makes it possible to form or maintain a uniform dispersion of a gaseous phase in a liquid or solid food. |
| Foodservice | It refers to the part of the food industry which includes businesses, institutions, and companies which prepare meals outside the home. It includes restaurants, school and hospital cafeterias, catering operations, and many other formats. |
| Fortification | It is the deliberate addition of micronutrients that are not found in them naturally or which are lost during processing, to improve a food product's nutritional value. |
| FSANZ | Food Standards Australia New Zealand |
| FSIS | Food Safety and Inspection Service |
| FSSAI | Food Safety and Standards Authority of India |
| Gelling agent | It is an ingredient that functions as a stabilizer and thickener to provide thickening without stiffness through the formation of gel. |
| GHG | Greenhouse Gas |
| Gluten | It is a family of proteins found in grains, including wheat, rye, spelt, and barley. |
| Hemp | It is a botanical class of Cannabis sativa cultivars grown specifically for industrial or medicinal use. |
| Hydrolysate | It is a form of protein manufactured by exposing the protein to enzymes that can partially break the bonds between the protein's amino acids and break down large, complicated proteins into smaller pieces. Its processing makes it easier and quicker to digest. |
| Hypoallergenic | It refers to a substance that causes fewer allergic reactions. |
| Isolate | It is the purest and most processed form of protein which has undergone separation to obtain a pure protein fraction. It typically contains ≥ 90% of protein by weight. |
| Keratin | It is a protein that helps form hair, nails, and the outer layer of skin. |
| Lactalbumin | It is the albumin contained in milk and obtained from whey. |
| Lactoferrin | It is an iron‑binding glycoprotein that is present in the milk of most mammals. |
| Lupin | It is the yellow legume seeds of the genus Lupinus. |
| Millenial | Also known as Generation Y or Gen Y, it refers to the people born from 1981 to 1996. |
| Monogastric | It refers to an animal with a single-compartmented stomach. Examples of monogastric include humans, poultry, pigs, horses, rabbits, dogs, and cats. Most monogastric are generally unable to digest much cellulose food materials such as grasses. |
| MPC | Milk protein concentrate |
| MPI | Milk protein isolate |
| MSPI | Methylated soy protein isolate |
| Mycoprotein | Mycoprotein is a form of single-cell protein, also known as fungal protein, derived from fungi for human consumption. |
| Nutricosmetics | It is a category of products and ingredients that act as nutritional supplements to care for skin, nails, and hair natural beauty. |
| Osteoporosis | It is a medical condition in which the bones become brittle and fragile from loss of tissue, typically as a result of hormonal changes, or deficiency of calcium or vitamin D. |
| PDCAAS | Protein digestibility-corrected amino acid score (PDCAAS) is a method of evaluating the quality of a protein based on both the amino acid requirements of humans and their ability to digest it. |
| Per-capita consumption of animal protein | It is the average amount of animal protein (such as milk, whey, gelatin, collagen, and egg proteins) that is readily available for consumption by each person in an actual population. |
| Per-capita consumption of plant protein | It is the average amount of plant protein (such as soy, wheat, pea, oat, and hemp proteins) that is readily available for consumption by each person in an actual population. |
| Quorn | It is a microbial protein manufactured using mycoprotein as an ingredient, in which the fungus culture is dried and mixed with egg albumen or potato protein, which acts as a binder, and then is adjusted in texture and pressed into various forms. |
| Ready-to-Cook (RTC) | It refers to food products that include all of the ingredients, where some preparation or cooking is required through a process that is given on the package. |
| Ready-to-Eat (RTE) | It refers to a food product prepared or cooked in advance, with no further cooking or preparation required before being eaten. |
| RTD | Ready-to-Drink |
| RTS | Ready-to-Serve |
| Saturated fat | It is a type of fat in which the fatty acid chains have all single bonds. It is generally considered unhealthy. |
| Sausage | It is a meat product made of finely chopped and seasoned meat, which may be fresh, smoked, or pickled and which is then usually stuffed into a casing. |
| Seitan | It is a plant-based meat substitute made out of wheat gluten. |
| Softgel | It is a gelatin-based capsule with a liquid fill. |
| SPC | Soy protein concentrate |
| SPI | Soy protein isolate |
| Spirulina | It is a biomass of cyanobacteria that can be consumed by humans and animals. |
| Stabilizer | It is an ingredient added to food products to help maintain or enhance their original texture, and physical and chemical characteristics. |
| Supplementation | It is the consumption or provision of concentrated sources of nutrients or other substances that are intended to supplement nutrients in the diet and is intended to correct nutritional deficiencies. |
| Texturant | It is a specific type of food ingredient that is used to control and alter the mouthfeel and texture of food and beverage products. |
| Thickener | It is an ingredient that is used to increase the viscosity of a liquid or dough and make it thicker, without substantially changing its other properties. |
| Trans fat | Also called trans-unsaturated fatty acids or trans fatty acids, it is a type of unsaturated fat that naturally occurs in small amounts in meat. |
| TSP | Textured soy protein |
| TVP | Textured vegetable protein |
| WPC | Whey protein concentrate |
| WPI | Whey protein isolate |
Need More Details on Market Definition?
Ask a Question
Research Methodology
Mordor Intelligence follows a four-step methodology in all our reports.
- Step-1: Identify Key Variables: The quantifiable key variables (industry and extraneous) pertaining to the specific product segment and country are selected from a group of relevant variables & factors based on desk research & literature review; along with primary expert inputs. These variables are further confirmed through regression modeling (wherever required).
- Step-2: Build a Market Model: In order to build a robust forecasting methodology, the variables and factors identified in Step-1 are tested against available historical market numbers. Through an iterative process, the variables required for market forecast are set and the model is built on the basis of these variables.
- Step-3: Validate and Finalize: In this important step, all market numbers, variables and analyst calls are validated through an extensive network of primary research experts from the market studied. The respondents are selected across levels and functions to generate a holistic picture of the market studied.
- Step-4: Research Outputs: Syndicated Reports, Custom Consulting Assignments, Databases & Subscription Platforms

Get More Details On Research Methodology
Download PDF


