
US Personal Protective Equipment (PPE) Market Size and Share
Market Overview
| Study Period | 2020 - 2031 |
|---|---|
| Forecast Data Period | 2026 - 2031 |
| Base Year Market Size (2025) | USD 15.6 Billion |
| Market Size (2026) | USD 17.36 Billion |
| Market Size (2031) | USD 29.61 Billion |
| Growth Rate (2026 - 2031) | 11.28 % |
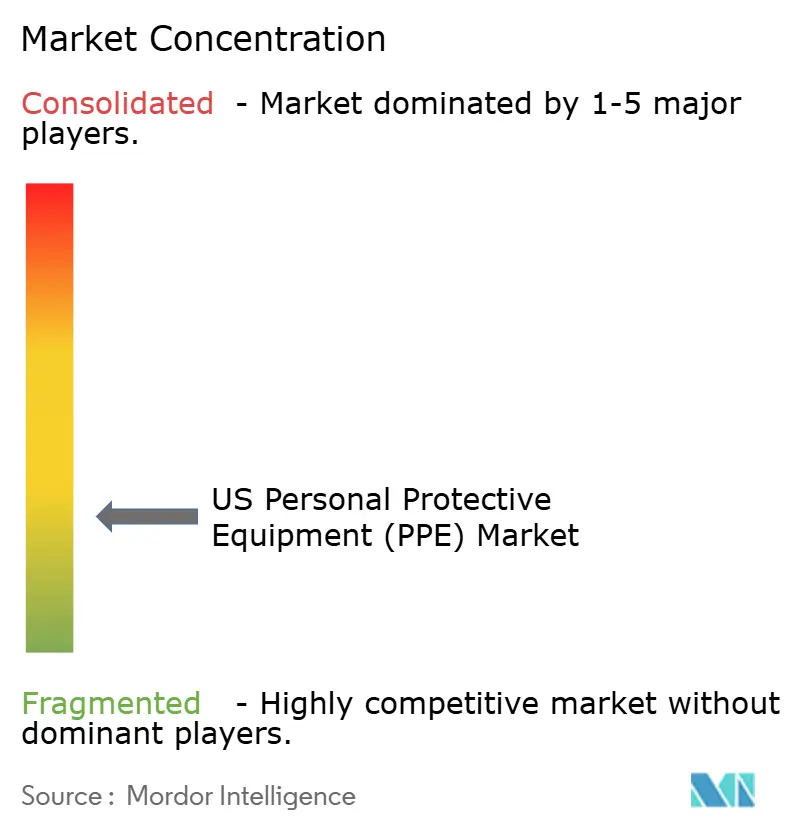
| Market Concentration | Low |
Major Players *Disclaimer: Major Players sorted in no particular order Image © Mordor Intelligence. Reuse requires attribution under CC BY 4.0. | |
US Personal Protective Equipment (PPE) Market Analysis by Mordor Intelligence
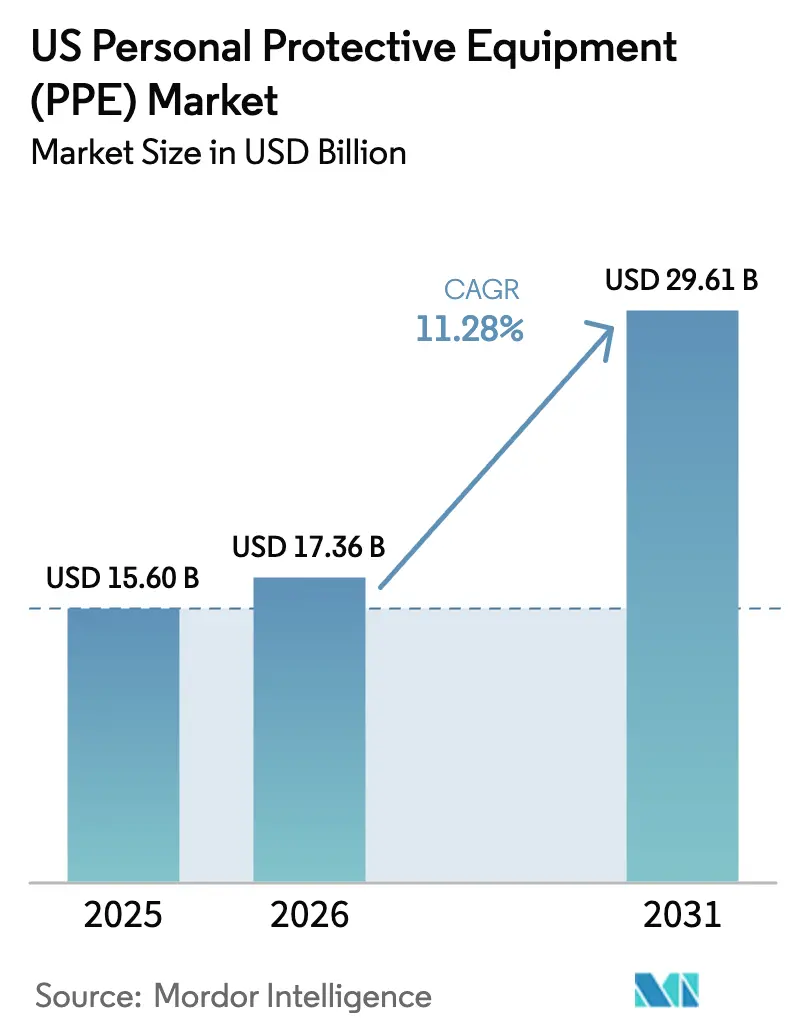
The United States personal protective equipment market size was valued at USD 15.6 billion in 2025 and estimated to grow from USD 17.36 billion in 2026 to reach USD 29.61 billion by 2031, at a CAGR of 11.28% during the forecast period (2026-2031). Heightened OSHA enforcement, large-scale manufacturing reshoring, and rapid adoption of connected safety technologies underpin this trajectory. Stricter compliance oversight keeps replacement cycles brisk, while federal “Make PPE in America” incentives steer procurement budgets toward domestically manufactured personal protective equipment (PPE).[1] At the same time, climate-driven wildfire events and the expansion of battery gigafactories are expanding the use cases for advanced respiratory and chemical-splash protection. Counterfeit import crackdowns and volatile petrochemical inputs complicate the cost picture but also encourage investment in quality-focused supply chains. Collectively, these forces position the United States personal protective equipment market to deliver steady double-digit value growth through 2030.
Key Report Takeaways
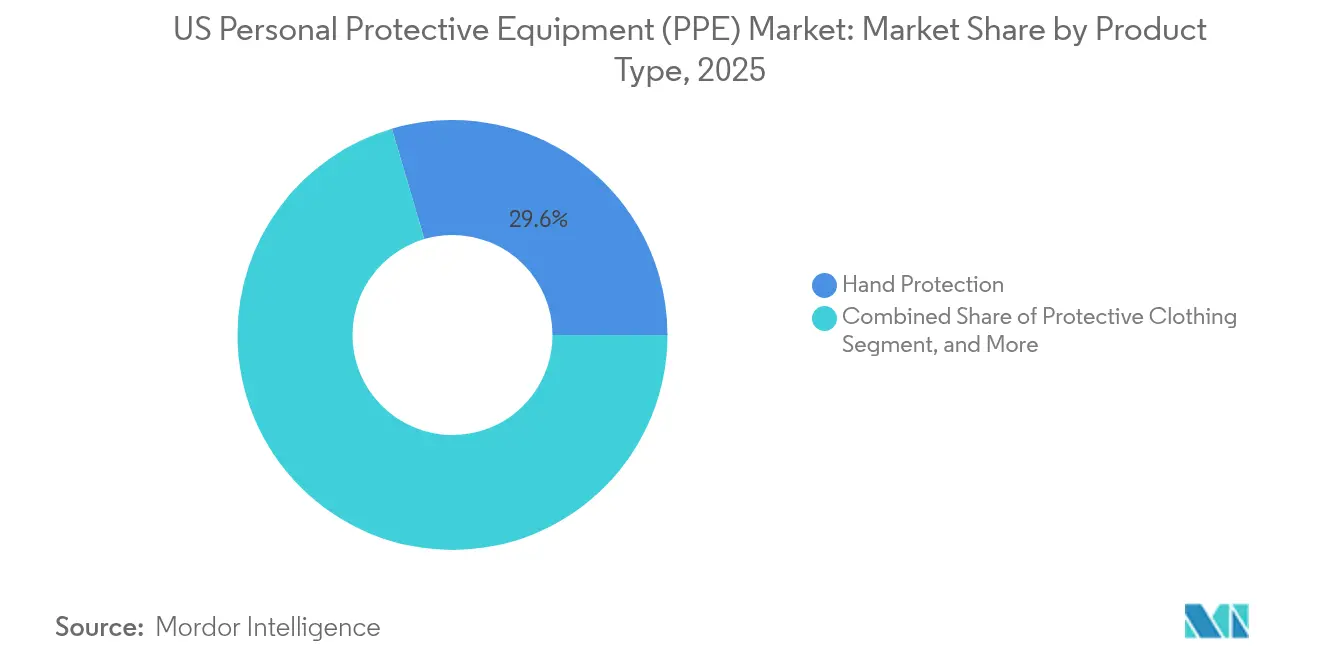
- By product type, hand protection captured 29.55% of the United States personal protective equipment market share in 2025, and respiratory protection is poised for the fastest expansion at a 13.38% CAGR through 2031.
- By end user, the healthcare and life sciences sector led with a 35.05% revenue share in 2025, and manufacturing is forecast to advance at a 12.74% CAGR between 2026 and 2031 as reshoring accelerates.
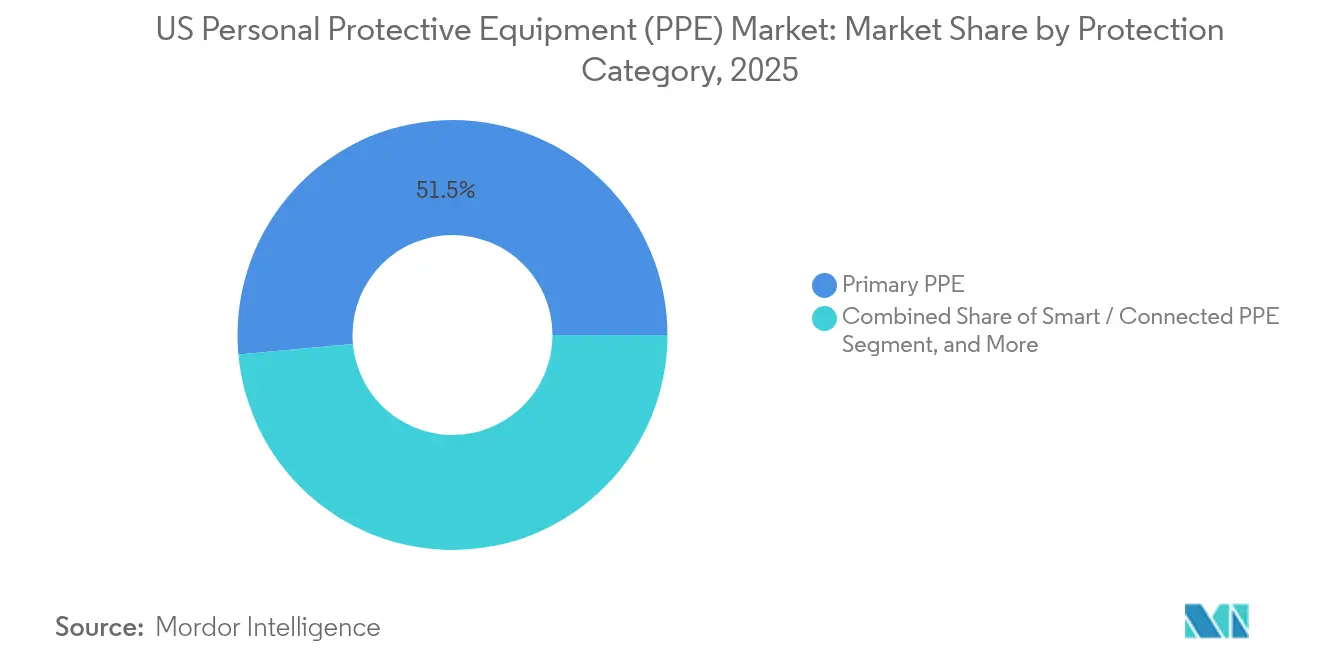
- By protection category, primary PPE accounted for 51.45% of the United States personal protective equipment market size in 2025, while Smart/Connected PPE is on track to grow at a 12.98% CAGR through 2031.
Note: Market size and forecast figures in this report are generated using Mordor Intelligence’s proprietary estimation framework, updated with the latest available data and insights as of 2026.
Market Trends and Insights
Drivers Impact Analysis of US Personal Protective Equipment (PPE) Market*
| DRIVER | (~) % IMPACT ON CAGR FORECAST | GEOGRAPHIC RELEVANCE | IMPACT TIMELINE |
|---|---|---|---|
| OSHA-enforced safety violations driving replacement cycles | +2.8% | National, concentrated in industrial states | Short term (≤ 2 years) |
| Expansion of U.S. on-shore manufacturing reshoring initiatives | +2.1% | Industrial Midwest, Southeast manufacturing corridors | Medium term (2-4 years) |
| Aging workforce boosting demand for ergonomic PPE | +1.4% | National, acute in Rust Belt regions | Long term (≥ 4 years) |
| Surge in wildfire smoke events spurring respiratory PPE sales | +1.2% | Western states, expanding to the Midwest | Short term (≤ 2 years) |
| AI-enabled fit-testing platforms are improving compliance | +0.9% | Technology-forward metropolitan areas | Medium term (2-4 years) |
| Growth of battery-gigafactories requiring specialty chemical-splash gear | +0.7% | Industrial Midwest, Southeast battery corridor | Medium term (2-4 years) |
| Source: Mordor Intelligence | |||
OSHA-Enforced Safety Violations Driving Replacement Cycles
OSHA cited respiratory protection lapses as the fourth-most frequent violation in 2024, while eye and face protection placed ninth, spotlighting persistent gaps across construction and manufacturing. Proposed civil penalty hikes of up to 3% in 2025 intensify the cost of non-compliance, nudging employers toward proactive bulk purchases rather than ad-hoc orders. Predictive enforcement, built on injury-rate analytics, further broadens inspection reach and accelerates replacement timelines. ANSI and NIOSH certification rules prevent the use of low-grade substitutes, thereby bolstering average selling prices. Together, these factors provide the United States' personal protective equipment market with a consistent regulatory pull-through that buffers cyclical demand swings.
Expansion of U.S. On-Shore Manufacturing Reshoring Initiatives
Roughly 350,000 factory jobs returned to American soil in 2022, and that wave crested higher through 2024 as federal procurement preferences rewarded domestic PPE output.[2] Capital spending followed: 3M earmarked USD 67 million for its Nebraska lines, expressly targeting local PPE contracts. Emerging battery plants in Michigan, Tennessee, and Georgia now require the use of chemical splash garments and high-efficiency respirators to mitigate hazards associated with lithium-ion batteries. The reshoring surge re-anchors demand inside U.S. borders, supporting premium pricing for “Made in USA” labels and shortening delivery windows for large industrial buyers.
Aging Workforce Boosting Demand for Ergonomic PPE
Workers aged 55 and above represent a rising share of shop-floor personnel, leaving them more vulnerable to musculoskeletal injuries.[3] Lightweight gloves, adjustable harnesses, and assistive exoskeletons such as StrongArm’s ErgoSkeleton have demonstrated an 84% reduction in unsafe postures. Employers favor such equipment to cut workers’ compensation costs and extend employee tenure. Smart garments equipped with biometric alerts enable supervisors to intervene before fatigue-related accidents escalate. These needs carve out high-margin sub-segments inside the broader United States personal protective equipment market.
Surge in Wildfire Smoke Events Spurring Respiratory PPE Sales
UCLA researchers reported a 50% increase in wildfire smoke exposure incidents for outdoor laborers in 2024.[4] California responded by mandating respirators for any worksite posting Air Quality Index readings above 151, instantly lifting N95 and P100 order volumes. The DHS is now developing a next-generation wildland respirator designed for prolonged deployment by firefighters. Smoke plumes drifting as far as Chicago underscore how climate-linked hazards are redefining geographic baselines for respiratory risk. Demand is therefore broadening beyond traditional hot-spot states, accelerating national unit consumption.
Restraints Impact Analysis of US Personal Protective Equipment (PPE) Market*
| RESTRAINT | (~) % IMPACT ON CAGR FORECAST | GEOGRAPHIC RELEVANCE | IMPACT TIMELINE |
|---|---|---|---|
| Volatile petrochemical feedstock prices are inflating material costs | -1.8% | National, acute in Gulf Coast production regions | Short term (≤ 2 years) |
| Counterfeit imports diluting branded PPE share | -1.2% | Port cities, e-commerce distribution networks | Medium term (2-4 years) |
| End-user "PPE fatigue" lowering compliance in non-regulated sectors | -0.9% | Service sectors, small business concentrations | Short term (≤ 2 years) |
| Acute labor shortages limiting domestic production scale-up | -0.7% | Manufacturing regions, skilled labor markets | Medium term (2-4 years) |
| Source: Mordor Intelligence | |||
Volatile Petro-Chemical Feedstock Prices Inflating Material Costs
Polypropylene and nitrile rubber swings of 25-30% during 2024 compressed disposable glove and mask margins. Cardinal Health identified raw-material volatility as a principal earnings risk in its latest 10-K. DuPont likewise cited volume contraction after raising prices to offset surging input costs, underscoring limited pass-through elasticity.[5] Domestic suppliers must therefore hedge resin exposure or pivot toward reusable lines to protect profitability.
Counterfeit Imports Diluting Branded PPE Share
CBP seized counterfeit safety goods worth more than USD 12 million during fiscal 2024, a 23% jump over the prior year. Substandard knock-offs jeopardize worker health and erode trust in legitimate brands. DuPont’s ITC complaint against Chinese firms highlights the significant legal implications involved. Retailers and small contractors lacking robust vetting processes remain prime targets, sustaining gray-market flow despite stepped-up interdictions.
*Our forecasts treat driver/restraint impacts as directional, not additive. The impact forecasts reflect baseline growth, mix effects, and variable interactions.
US Personal Protective Equipment (PPE) Market Segment Analysis
By Product Type:
Hand Protection Retains Primacy Amid Respiratory UpswingHand Protection held 29.55% of the United States personal protective equipment market share in 2025, buoyed by universal use across construction, healthcare, and automotive assembly. Disposable nitrile gloves dominate daily consumption patterns, while cut-resistant and chemical-resistant variants serve specialized niches. Frequent replacement cycles and concerns about contamination keep unit velocity high, stabilizing baseline revenue. Respiratory Protection, although smaller, is projected to log a 13.38% CAGR through 2031, the fastest within the category stack. Wildfire smoke mandates, battery-plant hazards, and OSHA crackdowns converge to propel the use of half-mask elastomeric and powered-air systems. Protective Clothing gains incremental lift from reshoring, particularly in battery and semiconductor cleanrooms that insist on splash-proof coveralls.
The United States personal protective equipment market size for Other Product Types, which include smart wearables and exoskeletons, remains comparatively small but exhibits above-market momentum as employers pilot technology-rich solutions. Eye and Face Protection enjoys renewed attention following its placement on OSHA’s citation list, with dielectric visors and anti-fog goggles gaining traction. Protective Footwear grows in tandem with federal infrastructure spending that sustains construction employment. Across sub-segments, ANSI and NIOSH standards anchor quality benchmarks, enabling U.S. producers to command price premiums while deterring low-grade imports.

By End User:
Healthcare Leads as Manufacturing AcceleratesHealthcare and Life Sciences represented 35.05% of 2025 revenue, reflecting the persistence of infection-control protocols and an aging population that requires more clinical touchpoints. Hospital purchasing consortia favor bulk contracts for gloves, gowns, and N95s, locking in steady volume. In contrast, Manufacturing spanning metals, electronics, and fast-growing battery assembly is expected to record the highest 12.74% CAGR through 2031. Reshoring funnels orders for chemical-splash garments, hearing protection, and cut-resistant gloves into Midwestern and Southeastern plants. Construction remains a dependable buyer, riding multi-year public works programs that necessitate hard hats, high-visibility apparel, and steel-toe boots.
Food and Beverage processors are tightening respiratory requirements to mitigate aerosolized contaminants, while oil and gas operators are demanding flame-resistant apparel for shale and offshore sites. The utilities and Energy sectors, especially those focused on renewables, are implementing fall-protection systems to safeguard turbine technicians. Public Safety and First Responders rely on federal grants to purchase bunker gear and self-contained breathing apparatus. Mining and Metals outfits workers with abrasion-resistant and impact-absorbing kits, though unit volumes trail those of larger verticals. Compliance rigor and hazard intensity thus vary, but all segments collectively reinforce the breadth of the United States' personal protective equipment market.
By Protection Category:
Primary PPE Stable, Smart Gear SurgesPrimary PPE continued to dominate, with a 51.45% share in 2025, covering essentials such as gloves, helmets, and respirators that directly block physical, chemical, or biological threats. Unit demand flows predictably with employment levels, solidifying its role as the cornerstone of revenue. Secondary PPE items, such as gowns, sleeve covers, and shoe guards, complement sterile environments, particularly in laboratories and food processing facilities. Smart/Connected PPE, although starting from a smaller base, is projected to grow at a 12.98% CAGR through 2031. Products embed sensors for real-time exposure logging, geofencing, and fatigue alerts, enhancing employer ROI through data-driven safety management.
The United States personal protective equipment market size for connected offerings is expected to accelerate as insurers offer discounts on premiums for digitally verified compliance. Early deployments integrate FORXAI Smart Mirror outputs into enterprise resource planning dashboards, enabling automated maintenance and replenishment triggers. Exoskeletons provide kinetic assistance, reducing the incidence of injuries among older or high-repetition workers. Regulatory agencies are drafting validation protocols for sensor-laden devices, a move that will standardize procurement criteria and further catalyze adoption.
Geography Analysis
Industrial reshoring is concentrating fresh PPE demand in the Midwest and Southeast, where automotive, appliance, and battery manufacturers are ramping up their output. Automotive hubs in Michigan and Tennessee favor high-cut gloves and chemical splash suits for electric vehicle assembly lines. The Gulf Coast remains a linchpin for petrochemical-driven demand, although feedstock volatility compresses distributor margins. Wildfire-prone Western states command elevated respiratory uptake, with California’s AQI-triggered respirator rule sparking immediate spikes in N95 orders. Smoke migration into the Great Plains now obliges logistics depots to stock respirators previously deemed unnecessary.
Northeast metros set the pace for smart PPE integration, leveraging dense healthcare networks and tech-savvy labor pools. Hospitals in Boston and Philadelphia are piloting biometric garments to monitor clinician fatigue, while biotech cleanrooms are reinforcing protocols for isolator gloveboxes. Texas and Louisiana, which are heavily invested in refining and LNG export terminals, maintain steady orders for flame-resistant apparel and SCBAs that are pressure-rated for H₂S environments. Federal installations, ranging from shipyards in Virginia to missile ranges in New Mexico, specify rigid, MIL-STD-compliant equipment that commands premium pricing.
Variable state regulations create a patchwork of compliance triggers. California’s more stringent standards on air quality and worker heat exposure surpass federal baselines, amplifying local demand elasticity. Conversely, right-to-work states in the Southeast prioritize cost-efficient solutions yet still adopt U.S.-made gear to qualify for federal subsidies. This mosaic obliges suppliers to maintain agile inventories and region-tailored marketing, yet the distributed footprint ultimately broadens total addressable volume for the United States personal protective equipment market.
Regulatory Landscape
The United States PPE market operates under a multi-agency framework centered on OSHA workplace rules (including the Respiratory Protection standard, 29 CFR 1910.134), with product performance and certification anchored by NIOSH programs and widely adopted consensus standards. In June 2026, OSHA proposed revisions affecting respiratory protection requirements, including changes around medical evaluation requirements for certain filtering facepiece respirators (FFRs) and loose-fitting powered air-purifying respirators (PAPRs), alongside proposed updates spanning multiple chemical-specific standards. These steps reinforce compliance-driven replacement and documentation cycles across industrial and construction workplaces.
Healthcare-oriented procurement policy is also tightening around domestic sourcing. In January 2026, CMS issued an Advance Notice of Proposed Rulemaking to solicit input on domestic PPE procurement approaches for participating hospitals, aligning with the broader “Make PPE in America” policy direction. In May 2026, the US Department of Veterans Affairs issued a class deviation to implement domestic procurement requirements under the Make PPE in America Act, creating a clearer federal buying lever that can shift supplier qualification, contracting, and inventory strategies toward domestically manufactured PPE.
Competitive Landscape
Market consolidation accelerated when Honeywell divested its PPE assets to Protective Industrial Products for USD 1.33 billion in November 2024. The deal realigned Honeywell toward automation and aerospace, while PIP vaulted into the top tier of glove and hard-hat suppliers. Ansell’s USD 640 million acquisition of Kimberly-Clark’s PPE lines extended its healthcare dominance into industrial channels. MSA Safety’s USD 200 million purchase of M&C TechGroup added gas-detection depth that aligns with next-generation battery plant requirements. These moves underscore a strategic shift: scale and specialization now trump sheer product breadth.
Technology is a central differentiator. 3M’s USD 67 million Nebraska upgrade melds connected respirator platforms with high-speed molding lines, enabling shorter lead times for domestic buyers. DuPont’s aggressive IP enforcement helps defend high-margin Tyvek garments against counterfeit erosion. Start-ups leverage AI and wearables to challenge incumbents: StrongArm’s exoskeleton analytics attract logistics giants seeking to reduce injuries. Yet barriers remain high; ANSI, NIOSH, and FDA certifications extend approval cycles, favoring well-capitalized firms capable of multi-site audits.
Domestic sourcing is regaining strategic importance as federal buyers shift away from import-reliant supply chains exposed during the COVID-19 pandemic. Players owning U.S. nitrile or melt-blown capacity secure price premiums and procurement preference points. Simultaneously, counterfeit crackdowns boost trusted brands, nudging buyers toward established names with validated serialization programs.
US Personal Protective Equipment (PPE) Industry Leaders
-
3M Company
-
Honeywell International Inc.
-
Ansell Limited
-
Kimberly-Clark Corporation
-
MSA Safety Incorporated
- *Disclaimer: Major Players sorted in no particular order
US Personal Protective Equipment (PPE) Market Companies Covered in this Report
- 3M Company
- Honeywell International Inc.
- DuPont de Nemours, Inc.
- Kimberly-Clark Corporation
- Ansell Limited
- MSA Safety Incorporated
- Cardinal Health, Inc.
- Medline Industries, LP
- Owens & Minor, Inc.
- Lakeland Industries, Inc.
- Alpha Pro Tech, Ltd.
- Radians, Inc.
- Protective Industrial Products, Inc.
- Magid Glove & Safety Mfg. Co. LLC
- Moldex-Metric, Inc.
- Bullard
- Tingley Rubber Corporation
- Drägerwerk AG & Co. KGaA
- Superior Glove Works Ltd.
- Showa Group
- MCR Safety Inc.
- Pyramex Safety Products LLC
- Klein Tools, Inc.
- Towa Corporation
- Gerson Company
Read Analysis of US Personal Protective Equipment (PPE) Companies
Market Opportunities and Future Outlook
Domestic-procurement mechanisms create space for suppliers to document compliant US-origin supply, maintain audited quality systems, and support institutional contracting workflows across federal and hospital channels. CMS opened a policy pathway in January 2026 by soliciting input on domestic PPE procurement concepts for hospitals, while the VA moved to implementation via a May 2026 class deviation tied to the Make PPE in America Act. Together, these actions favor vendors that can pair certified respiratory and barrier products with traceability, anti-counterfeit controls, and contract-ready logistics, especially in healthcare and public-sector demand pools that increasingly formalize supply security requirements.
Technology-enabled and specialty PPE are also gaining traction as employers purchase outcomes such as compliance support, fit validation, exposure logging, and injury reduction rather than commodity units. NIOSH work tied to standards for isolation gowns and respirator fit helps set more consistent evaluation expectations for higher-performance products, and manufacturers continue to fund differentiated safety portfolios. 3M, for instance, outlined a multiyear R&D push (including a USD 3.5 billion commitment and a pipeline target through 2028) aimed at faster refresh cycles in connected and performance PPE, while MSA Safety has emphasized portable gas detection and fall protection areas that bundle PPE with monitoring and broader worksite safety systems.
Recent Industry Developments in US Personal Protective Equipment (PPE) Market
- July 2026: The procurement expands government demand for enhanced PPE. The contract solidifies 3M’s role in military safety segment and supports domestic PPE supply stability.
- July 2026: The contract expands military respiratory protection demand and may influence stockpiling. The agreement reinforces 3M’s integrated safety ecosystem and exposure to long-cycle military sourcing.
- March 2026: The definitive agreement to acquire Madison Fire & Rescue and form a leading fire and safety venture broadens the PPE ecosystem. The move signals a pivot toward targeted safety verticals via the joint venture and expands fire, rescue, and connected safety capabilities.
US Personal Protective Equipment (PPE) Market Report Scope and Research Methodology
Market Definition and Coverage
For this study, the market is defined as the value of personal protective equipment sold for use in the United States to reduce exposure to workplace and public safety hazards, covering common protective products used across industrial and healthcare settings.
Scope exclusions: We exclude general workwear that is not designed or certified for protection, and services such as fit-testing, training, and equipment maintenance.
Segments Covered in This Report
- By Product Type
- Hand Protection
- Protective Clothing
- Respiratory Protection
- Protective Footwear
- Eye and Face Protection
- Other Product Types
- By End User
- Healthcare and Life Sciences
- Construction
- Oil and Gas / Petrochemicals
- Manufacturing (Discrete and Process)
- Food and Beverage
- Mining and Metals
- Utilities and Energy (incl. Renewables)
- Public Safety and First Responders
- Other End-User
- By Protection Category
- Primary (Direct-contact) PPE
- Secondary (Contamination Barrier) PPE
- Smart / Connected PPE
Data Sources, Market Sizing, and Validation
Desk Research
Desk research was used to set the market boundaries, map the demand pool, and collect anchor indicators that can be checked over time. We mainly leaned on public and official sources such as OSHA standards and enforcement materials, NIOSH and CDC guidance for respiratory protection, U.S. Bureau of Labor Statistics employment and injury data, U.S. Census Bureau manufacturing and trade series, and USITC import-export statistics.
To convert these signals into usable sizing inputs, we also reviewed sources such as company filings and investor presentations, association and standards body publications (for example, ANSI linked safety standards), and reputed news coverage on supply availability and pricing shifts. Where needed, paid subscriptions were used for company financials and intelligence, patent lookups, and shipment-level import-export checks to verify directional movements. The sources listed here are illustrative, and many other public references were also used for data collection, validation, and clarification.
Primary Interviews and Surveys
Primary work was conducted to test what we saw in secondary sources, and to fill gaps that are usually not visible in public data, such as replacement cycles, product mix shifts, and channel pricing. We spoke with stakeholders across the value chain including manufacturers, distributors, safety managers, procurement teams, and user organizations in sectors like construction, manufacturing, and healthcare, and we balanced views across major U.S. regions to avoid a single industry bias.
Distribution of primary research fieldwork respondents
| Company type | Respondent position |
|---|---|
| Top tier: 37% | CXOs: 13% |
| Mid tier: 45% | Functional/Unit leaders: 31% |
| Smaller Players: 18% | Managers: 56% |
Market-Sizing & Forecasting
Market sizing started with a top-down build where U.S. occupational exposure and compliance-led demand pools were reconstructed using employment by high-risk industries, safety incidence signals, and product-specific usage intensity assumptions. Once this was shaped, totals were checked using selective bottom-up approximations, such as supplier revenue sampling, distributor channel checks, and sampled ASP multiplied by estimated volumes, which helped adjust the overall level and the mix.
A few practical inputs guided the model, including workforce counts in PPE-intensive sectors, replacement frequency by product type (for example, respirators versus gloves), import dependence for key categories, pricing movement linked to raw material pressure, and adoption of connected PPE in regulated sites. When a variable could not be observed cleanly, it was bracketed using interview ranges and then tightened by cross-checking against trade flows and procurement behavior. Forecasts were built using scenario analysis supported by short time series smoothing for categories that show cyclicality, and then refined based on expected changes in enforcement intensity, industrial activity, and healthcare preparedness spending.
Data Validation & Update Cycle
Validation was done through repeated cross-checks so that one single data stream did not drive the outcome. Model outputs were compared against independent signals such as import-export direction, manufacturing activity, and safety compliance triggers, and unusual jumps were reviewed until a clear explanation was found or the assumption was revised.
Before sign off, results went through multi-step analyst reviews that included range checks by product type and end user, followed by re-contacting selected interviewees when variances stayed high. Reports are refreshed annually, and interim updates are also done when material events occur that can move demand or pricing. Right before delivery, a fresh review pass is completed so clients receive the latest updated view.
Mordor Intelligence's United States Personal Protective Equipment Ppe Market Size Versus Other Published Estimates
Published market sizes for U.S. PPE often do not match because the scope and counting logic can shift in small but important ways. The biggest differences usually come from what is treated as PPE versus adjacent workwear, whether healthcare is fully included, and how pricing is handled during volatility.
In practice, gaps also come from mixing shipment value with end user consumption value, using aggressive versus conservative replacement cycles, and applying different currency timing for imported items. Another common reason is the refresh cadence, where older assumptions around pandemic-driven demand, stockpiling, and distributor inventory can stay in the numbers longer than they should, which then changes the current year starting point.
Benchmark comparison
| Source | Market Size | Gaps in Research Methodology |
|---|---|---|
| Mordor Intelligence | USD 15.60 B (2025) | |
| Industry Report A | USD 20.84 B (2024) | This estimate appears to start from an earlier year and may include broader safety related categories, and the value looks closer to a wider consumption basket that can fold in non certified workwear and adjacent items. |
| Industry Report B | USD 25.00 B (2024) | The figure is likely driven by a broader definition and a more expansionary assumption set for healthcare and industrial restocking, and it may not separate short term demand spikes from steady replacement demand. |
The spread across the three figures is mostly explained by product boundary choices, the treatment of short-lived demand spikes, and how prices are normalized across years. By keeping the count tied to certified protective categories and checking replacement logic against trade and channel signals, the estimate stays easier to replicate and to audit, which is the approach used by Mordor Intelligence.
Key Questions Answered in the Report
How large is the United States personal protective equipment market in 2026?
The United States personal protective equipment market size is USD 17.36 billion in 2026 with an 11.28% CAGR outlook to 2031.
Which product category is growing fastest?
Respiratory Protection is projected to advance at a 13.38% CAGR through 2031, spurred by wildfire smoke rules and battery-plant requirements.
Why is manufacturing reshoring important for PPE demand?
Approximately 350,000 jobs have returned to U.S. factories, creating concentrated demand for gloves, respirators, and chemical-splash garments in new Midwestern and Southeastern plants.
What role does smart PPE play in future growth?
Smart/Connected PPE embeds sensors for real-time compliance and is expected to grow at 12.98% CAGR, outpacing traditional categories.
How are counterfeit imports affecting the market?
CBP reported a 23% rise in counterfeit PPE seizures in 2024, undermining legitimate brands and prompting tighter supply-chain verification.
Which end-user segment currently dominates sales?
Healthcare and Life Sciences accounted for 35.05% of 2025 revenue, driven by infection-control protocols and high procedural volume.