
| Study Period | 2017 - 2030 |
| Base Year For Estimation | 2024 |
| Forecast Data Period | 2025 - 2030 |
| Market Size (2025) | USD 351.4 Million |
| Market Size (2030) | USD 426 Million |
| CAGR (2025 - 2030) | 3.93 % |
| Market Concentration | Low |
Major Players*Disclaimer: Major Players sorted in no particular order |


United States Pea Protein Market Analysis
The United States Pea Protein Market size is estimated at 351.4 million USD in 2025, and is expected to reach 426 million USD by 2030, growing at a CAGR of 3.93% during the forecast period (2025-2030).
The United States pea protein market is experiencing significant transformation driven by evolving consumer preferences and health consciousness. Approximately 42% of Americans purchased functional or fortified foods and beverages in 2022, indicating a strong shift toward nutritionally enhanced products. This trend is particularly evident in the growing acceptance of plant protein, with manufacturers responding through increased product development and innovation. The market is witnessing substantial investment in research and development to improve the taste, texture, and functionality of pea protein-based products, making them more appealing to mainstream consumers.
The food and beverage industry continues to be a major catalyst for market growth, with manufacturers incorporating pea protein across diverse applications. About 39% of US healthy eaters consider protein content an important attribute when selecting food products, driving demand for protein-enriched offerings. Major brands are launching innovative products incorporating pea protein, particularly in categories like meat alternatives, beverages, and snacks. Companies like Siren Snacks, Larabar, and Simply Protein are leading this innovation wave with products that combine nutrition with convenience.
Health and dietary considerations are playing an increasingly crucial role in market development. With approximately 36% of consumers in the United States being lactose intolerant in 2022, pea protein has emerged as a viable alternative to dairy-based proteins. The ingredient's hypoallergenic properties and non-GMO status have made it particularly attractive to consumers with dietary restrictions. Additionally, about 10.2% of the US population suffered from diabetes in 2022, contributing to the demand for alternative protein options that can help manage blood sugar levels.
The market is witnessing significant innovation in product formulations and applications. Manufacturers are focusing on improving the nutritional profile of conventional products through pea protein fortification. For instance, in the confectionery sector, 85% of chocolates and candies sold in 2022 contained 200 calories or less, with many manufacturers exploring protein enrichment as a way to enhance nutritional value. The industry is also seeing advancements in processing technologies that enhance the functionality of pea protein, making it more versatile for various applications while maintaining its structural integrity under different processing conditions.
United States Pea Protein Market Trends
Growth in plant protein consumption provides opportunities for key players in the ingredients market
- The per capita consumption rate of plant proteins is increasing at a considerable rate in the United States, supported by investments and innovations, resulting in a consumption rate of 40.28 grams per day, primarily due to a rising number of consumers turning vegan to promote animal welfare. This is because factory farming, where animals are maltreated, is a norm in the United States. Most Americans eat less meat and animal products, but they do not eliminate their consumption entirely. They also tend to be more flexitarian than vegan or vegetarian. Nearly 12% of consumers in the country prefer a plant-based diet, whereas 7% of consumers follow a flexitarian diet. Although consumers of all generations in the United States are interested in plant-based meals, individuals in their 20s and 30s are the keenest to adopt plant-based diets.
- There is a constant rise in the per capita consumption of pea protein due to its wide applications in different food products, like meat, poultry, and bakery products. Around 41% of consumers are interested in plant-based food derived from pea protein. Pea protein is mainly used in sports nutrition and meat alternatives. A typical serving of pea protein powder is 30 grams, with 25 grams of protein. Athletes usually use one serving per day but may take as many as three servings per day.
- Soy and whey proteins are used primarily in the food and beverage, supplement, and sports nutrition industries. In 2021, around 36% of consumers were familiar with soy protein and had consumed the same, whereas 31% of individuals consumed whey protein in the US. Similarly, the consumption of soy-based food and beverages favorably increased by 12.9% during 2014-2019, and it is likely to remain consistent throughout the forecast period.

Understand The Key Trends Shaping This Market
Download PDF
The United States is one of the major pea producers globally
- Dry peas are considered the major raw material source for pea protein extraction, and the production data mentioned above is for dry peas only. As most farmers are planting peas to help crop rotation, pea production is flourishing in the country. Many manufacturers have been using pea protein as one of the major ingredients, especially Beyond Meat Inc. and Impossible Burgers. As a result, the production of peas in the United States increased by around 42% from 2017 to 2020. Pea protein can also substitute gluten as a stabilizer in snacks and cereals. After extensive research, pea protein is also entering the gluten-free market, as gluten is believed to cause intestine inflammation in some cases.
- Data shows that growers in the United States are expected to seed about 20% more field peas than in previous years. US farmers also cut acres of principal crops, including corn, soy, and wheat, by about 3%. In 2019, Montana's cultivated dry pea area was estimated at 198,300 ha, up by 44% from the previous year. The cultivated dry pea area in North Dakota was estimated at 163,900 ha, up by 8% from the previous year. In northern Central America, pea crops fall under the yellow (70%) and green (30%) categories, where yellow peas are the most used raw material to produce pea protein.
- According to the USA Dry Pea and Lentil Council, in the United States, some of the growers who had shifted to chickpeas ended up using dry seedling peas instead. Manufacturers in the pea protein market are also more focused on developing new and innovative offerings to fulfill consumers' changing needs and demands by using advanced technologies. As there is a higher level of certain amino acids in peas, it provides an opportunity for the players to tap into the potential posed by innovation.

OTHER KEY INDUSTRY TRENDS COVERED IN THE REPORT
- Baby food is expected to witness steady growth post-pandemic
- Innovation is expected to help maintain a steady growth rate
- Consumer preferences are shifting to premium condiments and sauces, away from packaged soups
- Dairy alternatives are expected to witness a significant growth rate
- There are great opportunities for meat alternative products
- Key players focused more on healthy ingredients post-COVID-19
- Rising US feed exports and feed prices are expected to impact production
- The growth of the bakery industry is led by large commercial players
- Sustainable and innovative packaging trends are expected to influence the breakfast cereal market
- Key players are expected to focus on fortification and nutritional enrichment
- The emphasis on awareness and innovation is the driving force behind the growth of the elderly nutrition market
- E-commerce is expected to emerge as one of the most preferred channels
- Sport/performance nutrition is expected to witness significant growth during the forecast period
- The US cosmetics industry is expected to be driven by the synergy of innovation and social media influence
Segment Analysis: Form
Isolates Segment in US Pea Protein Market
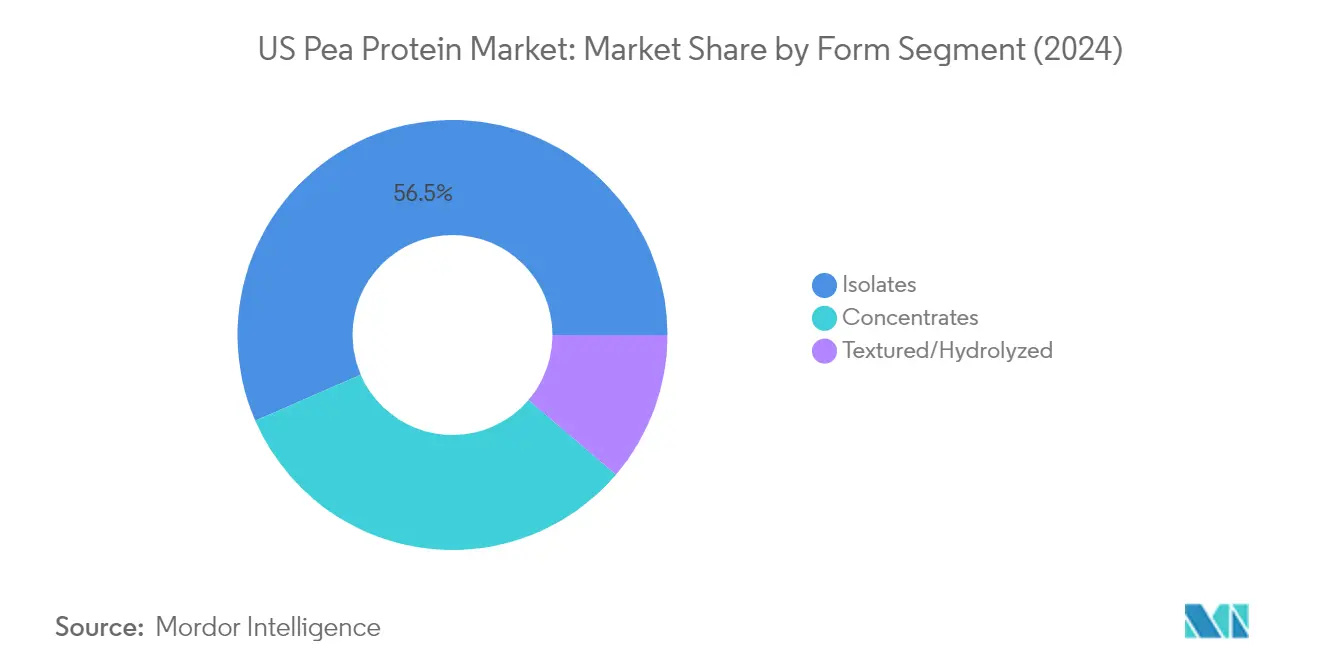
The pea protein isolate segment dominates the US pea protein market, commanding approximately 57% market share in 2024, driven primarily by its high protein content and superior functionality in food and beverage applications. The segment's prominence is particularly notable in the meat alternatives and sports nutrition sectors, where manufacturers value its exceptional protein concentration of over 90% compared to other forms. The food and beverages segment alone accounts for nearly 67% of pea protein isolate applications, with manufacturers like Puri Foods and Axiom Food Inc. focusing on launching a wide range of isolated pea protein products. The segment's growth is further propelled by its functionality as an ideal alternative to soy protein, particularly due to its non-allergenic properties and superior amino acid profile. Additionally, pea protein isolates are projected to maintain their market leadership with an expected growth rate of approximately 6% between 2024 and 2029, driven by increasing demand from health-conscious consumers and the expanding vegan population.
Remaining Segments in Form
The pea protein concentrate and textured pea protein segments complete the US pea protein market landscape, each serving distinct applications and consumer needs. Pea protein concentrates have established a strong presence in the market, particularly in snacks and sports nutrition applications, where they serve as both protein sources and functional ingredients. The segment's popularity stems from its optimal protein profile and versatility in food formulations. Meanwhile, the textured pea protein segment has carved out its niche in the personal care and meat alternative sectors, leveraging its unique properties for specific applications. Hydrolyzed pea protein is particularly valued in the personal care industry for its smoothing and whipping agent properties, while textured proteins excel in meat alternative protein applications due to their ability to mimic muscle meat texture.
Segment Analysis: End User
Animal Feed Segment in US Pea Protein Market
The animal feed segment dominates the US pea protein market, accounting for approximately 50% of the total market value in 2024. This significant market share is attributed to the growing demand from both the livestock and pet food industries, where pea protein serves as an essential ingredient due to its quick rehydration properties, neutral taste profile, and superior texturizing capabilities. The segment's prominence is further strengthened by the increasing adoption of plant-based protein alternatives in animal nutrition formulations, particularly in premium pet food products where manufacturers are responding to pet owners' preferences for high-quality, sustainable ingredients. The segment's strong position is also supported by pea protein's high protein digestibility of around 85%, making it particularly suitable for various livestock species, including poultry birds, where it can constitute up to 20-30% of the total feed composition.
Food and Beverages Segment in US Pea Protein Market
The food and beverages segment is experiencing remarkable growth in the US pea protein market, with a projected growth rate of approximately 9% from 2024 to 2029. This accelerated growth is primarily driven by the expanding meat alternatives industry, where pea protein has become a crucial ingredient due to its superior amino acid profile and hypoallergenic properties. The segment's growth is further fueled by increasing product launches in the snacks category, where manufacturers are incorporating pea protein to meet consumer demand for high-protein, plant-based options. Additionally, the beverage industry's innovation in protein-enriched drinks and the bakery sector's adoption of pea protein as an egg alternative are contributing to the segment's robust growth trajectory. The rising consumer awareness about sustainable and clean-label products has also positioned pea protein as a preferred ingredient in various food and beverage applications.
Remaining Segments in End User Segmentation
The personal care and cosmetics segment, along with the supplements segment, complete the US pea protein market landscape. The personal care and cosmetics sector is leveraging pea protein's amino acid profile for hair care products and anti-aging formulations, particularly utilizing hydrolyzed forms for their superior skin benefits. The supplements segment, particularly strong in sports nutrition applications, is capitalizing on the growing preference for plant-based protein alternatives among fitness enthusiasts and health-conscious consumers. Both segments are benefiting from the clean-label trend and increasing consumer awareness about sustainable and natural ingredients in their products. The versatility of pea protein in these applications, combined with its allergen-free status, continues to drive innovation and product development across these segments.
United States Pea Protein Industry Overview
Top Companies in United States Pea Protein Market
The pea protein market in the United States is characterized by continuous product innovation and strategic expansions by major players. Companies are heavily investing in research and development to improve protein content, taste profiles, and functionality of their pea protein offerings. Operational agility is demonstrated through the establishment of new production facilities and the modernization of existing plants to meet growing demand. Strategic partnerships with farmers and distributors have become crucial for securing raw material supply and expanding market reach. Companies are also focusing on vertical integration, from seed development to final product manufacturing, to maintain quality control and cost efficiency. The market has witnessed significant capacity expansions through both greenfield investments and brownfield projects, particularly in key pea-growing regions of North America.
Consolidated Market Led By Global Players
The United States pea protein market exhibits a highly consolidated structure dominated by large multinational corporations with diverse product portfolios. These global players leverage their extensive research capabilities, established distribution networks, and strong financial positions to maintain market leadership. Many of these companies are food industry conglomerates that have strategically expanded into the plant protein segment through acquisitions and internal development. The market also includes specialized ingredient manufacturers who focus exclusively on plant-based proteins, though their market share remains relatively smaller compared to the conglomerates.
The market has witnessed significant merger and acquisition activity as larger companies seek to quickly expand their plant protein capabilities and geographic reach. These acquisitions have primarily targeted companies with specialized pea protein processing technologies or established relationships with pea farmers. Strategic partnerships between ingredient companies and food manufacturers have become increasingly common, creating integrated supply chains and fostering product innovation. The entry barriers remain high due to the capital-intensive nature of processing facilities and the need for specialized technical expertise.
Innovation and Sustainability Drive Future Success
For incumbent companies to maintain and expand their pea protein market share, focus on technological innovation and sustainable practices has become crucial. Market leaders are investing in advanced processing technologies to improve protein yield and reduce environmental impact. Developing proprietary varieties of peas with higher protein content and establishing direct relationships with farmers through contract farming are becoming essential strategies. Companies are also expanding their application development capabilities to help food manufacturers incorporate pea proteins into new product categories.
Emerging players can gain ground by focusing on specialized market segments and developing unique value propositions. This includes creating specialized pea protein formulations for specific applications like sports nutrition or meat alternatives. Success in the market increasingly depends on addressing clean label demands and maintaining transparent supply chains. The regulatory environment, particularly regarding protein content claims and labeling requirements, continues to evolve and companies must maintain flexibility in their operations to adapt to these changes. Building relationships with end-users in high-growth segments and offering technical support for product development has become essential for market success.
United States Pea Protein Market Leaders
-
Archer Daniels Midland Company
-
Bunge Limited
-
International Flavors & Fragrances, Inc.
-
Kerry Group PLC
-
The Scoular Company
- *Disclaimer: Major Players sorted in no particular order

Need More Details on Market Players and Competiters?
Download PDF
United States Pea Protein Market News
- June 2022: Roquette, a global player in plant-based ingredients and a pioneer in plant proteins, announced the launch of its new NUTRALYS® range of organic textured proteins derived from peas and fava
- November 2021: The global innovator in healthy and functional ingredients and solutions, FrieslandCampina Ingredients, enters the plant-based protein market with two powder solutions developed in collaboration with AGT Foods, one of the largest suppliers of value-added pulses, staple foods, and ingredients. The Plantaris™ range will first feature Plantaris™ Pea Isolate 85 A and Plantaris™ Faba Isolate 90 A.
- April 2021: Anchor Ingredients invested in building a pea processing plant in North Dakota to service both the food and pet food markets. This strategic investment is expected to propel the company to a leading position in the rapidly expanding pulse ingredient space. The growing demand for plant-based proteins, specifically pea protein, in the food and pet food markets has been the major factor driving the company to invest in such expansions.
Free With This Report
We provide a comprehensive and exhaustive set of data pointers for global, regional, and country-level metrics that illustrate the fundamentals of the protein industry. With the help of 45+ free charts, clients can access in-depth market analysis based on per capita consumption of animal and plant protein, end-user market volume, and production data of raw materials for protein ingredients, through granular-level segmental information supported by a repository of market data, trends, and expert analysis. Data and analysis on protein sources, protein types, forms, end-user segments, etc., are available in the form of comprehensive reports as well as Excel-based data worksheets.


United States Pea Protein Market Report - Table of Contents
1. EXECUTIVE SUMMARY & KEY FINDINGS
2. INTRODUCTION
- 2.1 Study Assumptions & Market Definition
- 2.2 Scope of the Study
- 2.3 Research Methodology
3. KEY INDUSTRY TRENDS
-
3.1 End User Market Volume
- 3.1.1 Baby Food and Infant Formula
- 3.1.2 Bakery
- 3.1.3 Beverages
- 3.1.4 Breakfast Cereals
- 3.1.5 Condiments/Sauces
- 3.1.6 Confectionery
- 3.1.7 Dairy and Dairy Alternative Products
- 3.1.8 Elderly Nutrition and Medical Nutrition
- 3.1.9 Meat/Poultry/Seafood and Meat Alternative Products
- 3.1.10 RTE/RTC Food Products
- 3.1.11 Snacks
- 3.1.12 Sport/Performance Nutrition
- 3.1.13 Animal Feed
- 3.1.14 Personal Care and Cosmetics
-
3.2 Protein Consumption Trends
- 3.2.1 Plant
-
3.3 Production Trends
- 3.3.1 Plant
-
3.4 Regulatory Framework
- 3.4.1 United States
- 3.5 Value Chain & Distribution Channel Analysis
4. MARKET SEGMENTATION (includes market size in Value in USD and Volume, Forecasts up to 2030 and analysis of growth prospects)
-
4.1 Form
- 4.1.1 Concentrates
- 4.1.2 Isolates
- 4.1.3 Textured/Hydrolyzed
-
4.2 End User
- 4.2.1 Animal Feed
- 4.2.2 Food and Beverages
- 4.2.2.1 By Sub End User
- 4.2.2.1.1 Bakery
- 4.2.2.1.2 Beverages
- 4.2.2.1.3 Breakfast Cereals
- 4.2.2.1.4 Condiments/Sauces
- 4.2.2.1.5 Confectionery
- 4.2.2.1.6 Dairy and Dairy Alternative Products
- 4.2.2.1.7 Meat/Poultry/Seafood and Meat Alternative Products
- 4.2.2.1.8 RTE/RTC Food Products
- 4.2.2.1.9 Snacks
- 4.2.3 Personal Care and Cosmetics
- 4.2.4 Supplements
- 4.2.4.1 By Sub End User
- 4.2.4.1.1 Baby Food and Infant Formula
- 4.2.4.1.2 Elderly Nutrition and Medical Nutrition
- 4.2.4.1.3 Sport/Performance Nutrition
5. COMPETITIVE LANDSCAPE
- 5.1 Key Strategic Moves
- 5.2 Market Share Analysis
- 5.3 Company Landscape
-
5.4 Company Profiles (includes Global Level Overview, Market Level Overview, Core Business Segments, Financials, Headcount, Key Information, Market Rank, Market Share, Products and Services, and Analysis of Recent Developments).
- 5.4.1 AGT Food and Ingredients Inc.
- 5.4.2 Anchor Ingredients Co. LLC
- 5.4.3 Archer Daniels Midland Company
- 5.4.4 Axiom Foods Inc.
- 5.4.5 Bunge Limited
- 5.4.6 Cargill Incorporated
- 5.4.7 Farbest-Tallman Foods Corporation
- 5.4.8 Glanbia PLC
- 5.4.9 Ingredion Incorporated
- 5.4.10 International Flavors & Fragrances, Inc.
- 5.4.11 Kerry Group PLC
- 5.4.12 Roquette Frères
- 5.4.13 The Scoular Company
6. KEY STRATEGIC QUESTIONS FOR PROTEIN INGREDIENTS INDUSTRY CEOS
7. APPENDIX
-
7.1 Global Overview
- 7.1.1 Overview
- 7.1.2 Porter’s Five Forces Framework
- 7.1.3 Global Value Chain Analysis
- 7.1.4 Market Dynamics (DROs)
- 7.2 Sources & References
- 7.3 List of Tables & Figures
- 7.4 Primary Insights
- 7.5 Data Pack
- 7.6 Glossary of Terms
You Can Purchase Parts Of This Report. Check Out Prices For Specific Sections
Get Price Break-up Now
List of Tables & Figures
- Figure 1:
- VOLUME OF BABY FOOD AND INFANT FORMULA MARKET, METRIC TON, UNITED STATES, 2017 - 2029
- Figure 2:
- VOLUME OF BAKERY MARKET, METRIC TON, UNITED STATES, 2017 - 2029
- Figure 3:
- VOLUME OF BEVERAGES MARKET, METRIC TON, UNITED STATES, 2017 - 2029
- Figure 4:
- VOLUME OF BREAKFAST CEREALS MARKET, METRIC TON, UNITED STATES, 2017 - 2029
- Figure 5:
- VOLUME OF CONDIMENTS/SAUCES MARKET, METRIC TON, UNITED STATES, 2017 - 2029
- Figure 6:
- VOLUME OF CONFECTIONERY MARKET, METRIC TON, UNITED STATES, 2017 - 2029
- Figure 7:
- VOLUME OF DAIRY AND DAIRY ALTERNATIVE PRODUCTS MARKET, METRIC TON, UNITED STATES, 2017 - 2029
- Figure 8:
- VOLUME OF ELDERLY NUTRITION AND MEDICAL NUTRITION MARKET, METRIC TON, UNITED STATES, 2017 - 2029
- Figure 9:
- VOLUME OF MEAT/POULTRY/SEAFOOD AND MEAT ALTERNATIVE PRODUCTS MARKET, METRIC TON, UNITED STATES, 2017 - 2029
- Figure 10:
- VOLUME OF RTE/RTC FOOD PRODUCTS MARKET, METRIC TON, UNITED STATES, 2017 - 2029
- Figure 11:
- VOLUME OF SNACKS MARKET, METRIC TON, UNITED STATES, 2017 - 2029
- Figure 12:
- VOLUME OF SPORT/PERFORMANCE NUTRITION MARKET, METRIC TON, UNITED STATES, 2017 - 2029
- Figure 13:
- VOLUME OF ANIMAL FEED MARKET, METRIC TON, UNITED STATES, 2017 - 2029
- Figure 14:
- VOLUME OF PERSONAL CARE AND COSMETICS MARKET, METRIC TON, UNITED STATES, 2017 - 2029
- Figure 15:
- AVERAGE PER CAPITA CONSUMPTION OF PLANT PROTEIN, GRAM PER DAY, UNITED STATES, 2017 - 2029
- Figure 16:
- DRY PEA PRODUCTION, METRIC TON, UNITED STATES, 2017 - 2022
- Figure 17:
- VOLUME OF PEA PROTEIN MARKET, TONNES, UNITED STATES, 2017 - 2029
- Figure 18:
- VALUE OF PEA PROTEIN MARKET, USD, UNITED STATES, 2017 - 2029
- Figure 19:
- VOLUME OF PEA PROTEIN MARKET BY FORM, METRIC TONNES, UNITED STATES, 2017 - 2029
- Figure 20:
- VALUE OF PEA PROTEIN MARKET BY FORM, USD, UNITED STATES, 2017 - 2029
- Figure 21:
- VALUE SHARE OF PEA PROTEIN MARKET BY FORM, %, UNITED STATES, 2017 VS 2023 VS 2029
- Figure 22:
- VOLUME SHARE OF PEA PROTEIN MARKET BY FORM, %, UNITED STATES, 2017 VS 2023 VS 2029
- Figure 23:
- VOLUME OF PEA PROTEIN MARKET, CONCENTRATES, METRIC TONNES, UNITED STATES, 2017 - 2029
- Figure 24:
- VALUE OF PEA PROTEIN MARKET, CONCENTRATES, USD, UNITED STATES, 2017 - 2029
- Figure 25:
- VALUE SHARE OF PEA PROTEIN MARKET BY END USER, % CONCENTRATES , UNITED STATES, 2022 VS 2029
- Figure 26:
- VOLUME OF PEA PROTEIN MARKET, ISOLATES, METRIC TONNES, UNITED STATES, 2017 - 2029
- Figure 27:
- VALUE OF PEA PROTEIN MARKET, ISOLATES, USD, UNITED STATES, 2017 - 2029
- Figure 28:
- VALUE SHARE OF PEA PROTEIN MARKET BY END USER, % ISOLATES , UNITED STATES, 2022 VS 2029
- Figure 29:
- VOLUME OF PEA PROTEIN MARKET, TEXTURED/HYDROLYZED, METRIC TONNES, UNITED STATES, 2017 - 2029
- Figure 30:
- VALUE OF PEA PROTEIN MARKET, TEXTURED/HYDROLYZED, USD, UNITED STATES, 2017 - 2029
- Figure 31:
- VALUE SHARE OF PEA PROTEIN MARKET BY END USER, % TEXTURED/HYDROLYZED , UNITED STATES, 2022 VS 2029
- Figure 32:
- VOLUME OF PEA PROTEIN MARKET BY END USER, METRIC TONNES, UNITED STATES, 2017 - 2029
- Figure 33:
- VALUE OF PEA PROTEIN MARKET BY END USER, USD, UNITED STATES, 2017 - 2029
- Figure 34:
- VALUE SHARE OF PEA PROTEIN MARKET BY END USER, %, UNITED STATES, 2017 VS 2023 VS 2029
- Figure 35:
- VOLUME SHARE OF PEA PROTEIN MARKET BY END USER, %, UNITED STATES, 2017 VS 2023 VS 2029
- Figure 36:
- VOLUME OF PEA PROTEIN MARKET, ANIMAL FEED, UNITED STATES, 2017 - 2029
- Figure 37:
- VALUE OF PEA PROTEIN MARKET, ANIMAL FEED, UNITED STATES, 2017 - 2029
- Figure 38:
- VALUE SHARE OF PEA PROTEIN MARKET BY FORM, % ANIMAL FEED , UNITED STATES, 2022 VS 2029
- Figure 39:
- VOLUME OF PEA PROTEIN MARKET, FOOD AND BEVERAGES END USER, METRIC TONNES, UNITED STATES, 2017 - 2029
- Figure 40:
- VALUE OF PEA PROTEIN MARKET, FOOD AND BEVERAGES END USER, USD, UNITED STATES, 2017 - 2029
- Figure 41:
- VALUE SHARE OF PEA PROTEIN MARKET BY FOOD AND BEVERAGES END USER, %, UNITED STATES, 2017 VS 2023 VS 2029
- Figure 42:
- VOLUME SHARE OF PEA PROTEIN MARKET BY FOOD AND BEVERAGES END USER, %, UNITED STATES, 2017 VS 2023 VS 2029
- Figure 43:
- VOLUME OF PEA PROTEIN MARKET, BAKERY, METRIC TONNES, UNITED STATES, 2017 - 2029
- Figure 44:
- VALUE OF PEA PROTEIN MARKET, BAKERY, USD, UNITED STATES, 2017 - 2029
- Figure 45:
- VALUE SHARE OF PEA PROTEIN MARKET BY FORM, % BAKERY , UNITED STATES, 2022 VS 2029
- Figure 46:
- VOLUME OF PEA PROTEIN MARKET, BEVERAGES, METRIC TONNES, UNITED STATES, 2017 - 2029
- Figure 47:
- VALUE OF PEA PROTEIN MARKET, BEVERAGES, USD, UNITED STATES, 2017 - 2029
- Figure 48:
- VALUE SHARE OF PEA PROTEIN MARKET BY FORM, % BEVERAGES , UNITED STATES, 2022 VS 2029
- Figure 49:
- VOLUME OF PEA PROTEIN MARKET, BREAKFAST CEREALS, METRIC TONNES, UNITED STATES, 2017 - 2029
- Figure 50:
- VALUE OF PEA PROTEIN MARKET, BREAKFAST CEREALS, USD, UNITED STATES, 2017 - 2029
- Figure 51:
- VALUE SHARE OF PEA PROTEIN MARKET BY FORM, % BREAKFAST CEREALS , UNITED STATES, 2022 VS 2029
- Figure 52:
- VOLUME OF PEA PROTEIN MARKET, CONDIMENTS/SAUCES, METRIC TONNES, UNITED STATES, 2017 - 2029
- Figure 53:
- VALUE OF PEA PROTEIN MARKET, CONDIMENTS/SAUCES, USD, UNITED STATES, 2017 - 2029
- Figure 54:
- VALUE SHARE OF PEA PROTEIN MARKET BY FORM, % CONDIMENTS/SAUCES , UNITED STATES, 2022 VS 2029
- Figure 55:
- VOLUME OF PEA PROTEIN MARKET, CONFECTIONERY, METRIC TONNES, UNITED STATES, 2017 - 2029
- Figure 56:
- VALUE OF PEA PROTEIN MARKET, CONFECTIONERY, USD, UNITED STATES, 2017 - 2029
- Figure 57:
- VALUE SHARE OF PEA PROTEIN MARKET BY FORM, % CONFECTIONERY , UNITED STATES, 2022 VS 2029
- Figure 58:
- VOLUME OF PEA PROTEIN MARKET, DAIRY AND DAIRY ALTERNATIVE PRODUCTS, METRIC TONNES, UNITED STATES, 2017 - 2029
- Figure 59:
- VALUE OF PEA PROTEIN MARKET, DAIRY AND DAIRY ALTERNATIVE PRODUCTS, USD, UNITED STATES, 2017 - 2029
- Figure 60:
- VALUE SHARE OF PEA PROTEIN MARKET BY FORM, % DAIRY AND DAIRY ALTERNATIVE PRODUCTS , UNITED STATES, 2022 VS 2029
- Figure 61:
- VOLUME OF PEA PROTEIN MARKET, MEAT/POULTRY/SEAFOOD AND MEAT ALTERNATIVE PRODUCTS, METRIC TONNES, UNITED STATES, 2017 - 2029
- Figure 62:
- VALUE OF PEA PROTEIN MARKET, MEAT/POULTRY/SEAFOOD AND MEAT ALTERNATIVE PRODUCTS, USD, UNITED STATES, 2017 - 2029
- Figure 63:
- VALUE SHARE OF PEA PROTEIN MARKET BY FORM, % MEAT/POULTRY/SEAFOOD AND MEAT ALTERNATIVE PRODUCTS , UNITED STATES, 2022 VS 2029
- Figure 64:
- VOLUME OF PEA PROTEIN MARKET, RTE/RTC FOOD PRODUCTS, METRIC TONNES, UNITED STATES, 2017 - 2029
- Figure 65:
- VALUE OF PEA PROTEIN MARKET, RTE/RTC FOOD PRODUCTS, USD, UNITED STATES, 2017 - 2029
- Figure 66:
- VALUE SHARE OF PEA PROTEIN MARKET BY FORM, % RTE/RTC FOOD PRODUCTS , UNITED STATES, 2022 VS 2029
- Figure 67:
- VOLUME OF PEA PROTEIN MARKET, SNACKS, METRIC TONNES, UNITED STATES, 2017 - 2029
- Figure 68:
- VALUE OF PEA PROTEIN MARKET, SNACKS, USD, UNITED STATES, 2017 - 2029
- Figure 69:
- VALUE SHARE OF PEA PROTEIN MARKET BY FORM, % SNACKS , UNITED STATES, 2022 VS 2029
- Figure 70:
- VOLUME OF PEA PROTEIN MARKET, PERSONAL CARE AND COSMETICS, UNITED STATES, 2017 - 2029
- Figure 71:
- VALUE OF PEA PROTEIN MARKET, PERSONAL CARE AND COSMETICS, UNITED STATES, 2017 - 2029
- Figure 72:
- VALUE SHARE OF PEA PROTEIN MARKET BY FORM, % PERSONAL CARE AND COSMETICS , UNITED STATES, 2022 VS 2029
- Figure 73:
- VOLUME OF PEA PROTEIN MARKET, SUPPLEMENTS END USER, METRIC TONNES, UNITED STATES, 2017 - 2029
- Figure 74:
- VALUE OF PEA PROTEIN MARKET, SUPPLEMENTS END USER, USD, UNITED STATES, 2017 - 2029
- Figure 75:
- VALUE SHARE OF PEA PROTEIN MARKET BY SUPPLEMENTS END USER, %, UNITED STATES, 2017 VS 2023 VS 2029
- Figure 76:
- VOLUME SHARE OF PEA PROTEIN MARKET BY SUPPLEMENTS END USER, %, UNITED STATES, 2017 VS 2023 VS 2029
- Figure 77:
- VOLUME OF PEA PROTEIN MARKET, BABY FOOD AND INFANT FORMULA, METRIC TONNES, UNITED STATES, 2017 - 2029
- Figure 78:
- VALUE OF PEA PROTEIN MARKET, BABY FOOD AND INFANT FORMULA, USD, UNITED STATES, 2017 - 2029
- Figure 79:
- VALUE SHARE OF PEA PROTEIN MARKET BY FORM, % BABY FOOD AND INFANT FORMULA , UNITED STATES, 2022 VS 2029
- Figure 80:
- VOLUME OF PEA PROTEIN MARKET, ELDERLY NUTRITION AND MEDICAL NUTRITION, METRIC TONNES, UNITED STATES, 2017 - 2029
- Figure 81:
- VALUE OF PEA PROTEIN MARKET, ELDERLY NUTRITION AND MEDICAL NUTRITION, USD, UNITED STATES, 2017 - 2029
- Figure 82:
- VALUE SHARE OF PEA PROTEIN MARKET BY FORM, % ELDERLY NUTRITION AND MEDICAL NUTRITION , UNITED STATES, 2022 VS 2029
- Figure 83:
- VOLUME OF PEA PROTEIN MARKET, SPORT/PERFORMANCE NUTRITION, METRIC TONNES, UNITED STATES, 2017 - 2029
- Figure 84:
- VALUE OF PEA PROTEIN MARKET, SPORT/PERFORMANCE NUTRITION, USD, UNITED STATES, 2017 - 2029
- Figure 85:
- VALUE SHARE OF PEA PROTEIN MARKET BY FORM, % SPORT/PERFORMANCE NUTRITION , UNITED STATES, 2022 VS 2029
- Figure 86:
- MOST ACTIVE COMPANIES BY NUMBER OF STRATEGIC MOVES, COUNT, UNITED STATES PEA PROTEIN MARKET, 2017 - 2022
- Figure 87:
- MOST ADOPTED STRATEGIES, COUNT, UNITED STATES, 2017 - 2022
- Figure 88:
- VALUE SHARE OF MAJOR PLAYERS, %, UNITED STATES PEA PROTEIN MARKET
United States Pea Protein Industry Segmentation
Concentrates, Isolates, Textured/Hydrolyzed are covered as segments by Form. Animal Feed, Food and Beverages, Personal Care and Cosmetics, Supplements are covered as segments by End User.| Form | Concentrates | |||
| Isolates | ||||
| Textured/Hydrolyzed | ||||
| End User | Animal Feed | |||
| Food and Beverages | By Sub End User | Bakery | ||
| Beverages | ||||
| Breakfast Cereals | ||||
| Condiments/Sauces | ||||
| Confectionery | ||||
| Dairy and Dairy Alternative Products | ||||
| Meat/Poultry/Seafood and Meat Alternative Products | ||||
| RTE/RTC Food Products | ||||
| Snacks | ||||
| Personal Care and Cosmetics | ||||
| Supplements | By Sub End User | Baby Food and Infant Formula | ||
| Elderly Nutrition and Medical Nutrition | ||||
| Sport/Performance Nutrition | ||||
Need A Different Region or Segment?
Customize Now
Market Definition
- End User - The Protein Ingredients Market operates on a B2B basis. Food, Beverages, Supplements, Animal Feed, and Personal Care & Cosmetic manufacturers are considered to be end-consumers in the market studied. The scope excludes manufacturers buying liquid/dry whey to be used for application as a binding agent or thickener or other non-protein applications.
- Penetration Rate - Penetration Rate is defined as the percentage of Protein-Fortified End User Market Volume in the Overall End User Market Volume.
- Average Protein Content - Average protein content is the average protein content present per 100 g of product manufactured by all end-user companies considered under the scope of this report.
- End User Market Volume - End-user market volume is the consolidated volume of all types and forms of end-user products in the country or region.
| Keyword | Definition |
|---|---|
| Alpha-lactalbumin (α-Lactalbumin) | It is a protein that regulates the production of lactose in the milk of almost all mammalian species. |
| Amino acid | It is an organic compound that contains both amino and carboxylic acid functional groups, which are required for the synthesis of body protein and other important nitrogen-containing compounds, such as creatine, peptide hormones, and some neurotransmitters. |
| Blanching | It is the process of briefly heating vegetables with steam or boiling water. |
| BRC | British Retail Consortium |
| Bread improver | It is a flour-based blend of several components with specific functional properties designed to modify dough characteristics and give quality attributes to bread. |
| BSF | Black Soldier Fly |
| Caseinate | It is a substance produced by adding an alkali to acid casein, a derivative of casein. |
| Celiac disease | Celiac disease is an immune reaction to eating gluten, a protein found in wheat, barley, and rye. |
| Colostrum | It is a milky fluid that’s released by mammals that have recently given birth before breast milk production begins. |
| Concentrate | It is the least processed form of protein and has a protein content ranging from 40-90% by weight. |
| Dry protein basis | It refers to the percentage of "pure protein" present in a supplement after the water in it is completely removed through heat. |
| Dry whey | It is the product resulting from drying fresh whey which has been pasteurized and to which nothing has been added as a preservative. |
| Egg protein | It is a mixture of individual proteins, including ovalbumin, ovomucoid, ovoglobulin, conalbumin, vitellin, and vitellenin. |
| Emulsifier | It is a food additive that facilitates the blending of foods that are immiscible with one another, such as oil and water. |
| Enrichment | It is the process of addition of micronutrients that are lost during the processing of the product. |
| ERS | Economic Research Service of the USDA |
| Extrusion | It is the process of forcing soft mixed ingredients through an opening in a perforated plate or die designed to produce the required shape. The extruded food is then cut to a specific size by blades. |
| Fava | Also known as Faba, it is another word for yellow split beans. |
| FDA | Food and Drug Administration |
| Flaking | It is a process in which typically a cereal grain (like corn, wheat, or rice) is broken down into grits, cooked with flavors and syrups, and then pressed into flakes between cooled rollers. |
| Foaming agent | It is a food ingredient that makes it possible to form or maintain a uniform dispersion of a gaseous phase in a liquid or solid food. |
| Foodservice | It refers to the part of the food industry which includes businesses, institutions, and companies which prepare meals outside the home. It includes restaurants, school and hospital cafeterias, catering operations, and many other formats. |
| Fortification | It is the deliberate addition of micronutrients that are not found in them naturally or which are lost during processing, to improve a food product's nutritional value. |
| FSANZ | Food Standards Australia New Zealand |
| FSIS | Food Safety and Inspection Service |
| FSSAI | Food Safety and Standards Authority of India |
| Gelling agent | It is an ingredient that functions as a stabilizer and thickener to provide thickening without stiffness through the formation of gel. |
| GHG | Greenhouse Gas |
| Gluten | It is a family of proteins found in grains, including wheat, rye, spelt, and barley. |
| Hemp | It is a botanical class of Cannabis sativa cultivars grown specifically for industrial or medicinal use. |
| Hydrolysate | It is a form of protein manufactured by exposing the protein to enzymes that can partially break the bonds between the protein's amino acids and break down large, complicated proteins into smaller pieces. Its processing makes it easier and quicker to digest. |
| Hypoallergenic | It refers to a substance that causes fewer allergic reactions. |
| Isolate | It is the purest and most processed form of protein which has undergone separation to obtain a pure protein fraction. It typically contains ≥ 90% of protein by weight. |
| Keratin | It is a protein that helps form hair, nails, and the outer layer of skin. |
| Lactalbumin | It is the albumin contained in milk and obtained from whey. |
| Lactoferrin | It is an iron‑binding glycoprotein that is present in the milk of most mammals. |
| Lupin | It is the yellow legume seeds of the genus Lupinus. |
| Millenial | Also known as Generation Y or Gen Y, it refers to the people born from 1981 to 1996. |
| Monogastric | It refers to an animal with a single-compartmented stomach. Examples of monogastric include humans, poultry, pigs, horses, rabbits, dogs, and cats. Most monogastric are generally unable to digest much cellulose food materials such as grasses. |
| MPC | Milk protein concentrate |
| MPI | Milk protein isolate |
| MSPI | Methylated soy protein isolate |
| Mycoprotein | Mycoprotein is a form of single-cell protein, also known as fungal protein, derived from fungi for human consumption. |
| Nutricosmetics | It is a category of products and ingredients that act as nutritional supplements to care for skin, nails, and hair natural beauty. |
| Osteoporosis | It is a medical condition in which the bones become brittle and fragile from loss of tissue, typically as a result of hormonal changes, or deficiency of calcium or vitamin D. |
| PDCAAS | Protein digestibility-corrected amino acid score (PDCAAS) is a method of evaluating the quality of a protein based on both the amino acid requirements of humans and their ability to digest it. |
| Per-capita consumption of animal protein | It is the average amount of animal protein (such as milk, whey, gelatin, collagen, and egg proteins) that is readily available for consumption by each person in an actual population. |
| Per-capita consumption of plant protein | It is the average amount of plant protein (such as soy, wheat, pea, oat, and hemp proteins) that is readily available for consumption by each person in an actual population. |
| Quorn | It is a microbial protein manufactured using mycoprotein as an ingredient, in which the fungus culture is dried and mixed with egg albumen or potato protein, which acts as a binder, and then is adjusted in texture and pressed into various forms. |
| Ready-to-Cook (RTC) | It refers to food products that include all of the ingredients, where some preparation or cooking is required through a process that is given on the package. |
| Ready-to-Eat (RTE) | It refers to a food product prepared or cooked in advance, with no further cooking or preparation required before being eaten. |
| RTD | Ready-to-Drink |
| RTS | Ready-to-Serve |
| Saturated fat | It is a type of fat in which the fatty acid chains have all single bonds. It is generally considered unhealthy. |
| Sausage | It is a meat product made of finely chopped and seasoned meat, which may be fresh, smoked, or pickled and which is then usually stuffed into a casing. |
| Seitan | It is a plant-based meat substitute made out of wheat gluten. |
| Softgel | It is a gelatin-based capsule with a liquid fill. |
| SPC | Soy protein concentrate |
| SPI | Soy protein isolate |
| Spirulina | It is a biomass of cyanobacteria that can be consumed by humans and animals. |
| Stabilizer | It is an ingredient added to food products to help maintain or enhance their original texture, and physical and chemical characteristics. |
| Supplementation | It is the consumption or provision of concentrated sources of nutrients or other substances that are intended to supplement nutrients in the diet and is intended to correct nutritional deficiencies. |
| Texturant | It is a specific type of food ingredient that is used to control and alter the mouthfeel and texture of food and beverage products. |
| Thickener | It is an ingredient that is used to increase the viscosity of a liquid or dough and make it thicker, without substantially changing its other properties. |
| Trans fat | Also called trans-unsaturated fatty acids or trans fatty acids, it is a type of unsaturated fat that naturally occurs in small amounts in meat. |
| TSP | Textured soy protein |
| TVP | Textured vegetable protein |
| WPC | Whey protein concentrate |
| WPI | Whey protein isolate |
Need More Details on Market Definition?
Ask a Question
Research Methodology
Mordor Intelligence follows a four-step methodology in all our reports.
- Step-1: Identify Key Variables: The quantifiable key variables (industry and extraneous) pertaining to the specific product segment and country are selected from a group of relevant variables & factors based on desk research & literature review; along with primary expert inputs. These variables are further confirmed through regression modeling (wherever required).
- Step-2: Build a Market Model: In order to build a robust forecasting methodology, the variables and factors identified in Step-1 are tested against available historical market numbers. Through an iterative process, the variables required for market forecast are set and the model is built on the basis of these variables.
- Step-3: Validate and Finalize: In this important step, all market numbers, variables and analyst calls are validated through an extensive network of primary research experts from the market studied. The respondents are selected across levels and functions to generate a holistic picture of the market studied.
- Step-4: Research Outputs: Syndicated Reports, Custom Consulting Assignments, Databases & Subscription Platforms

Get More Details On Research Methodology
Download PDF


