United States Over-The-Counter Drugs Market Size and Share
Market Overview
| Study Period | 2020 - 2031 |
|---|---|
| Base Year For Estimation | 2025 |
| Forecast Data Period | 2026 - 2031 |
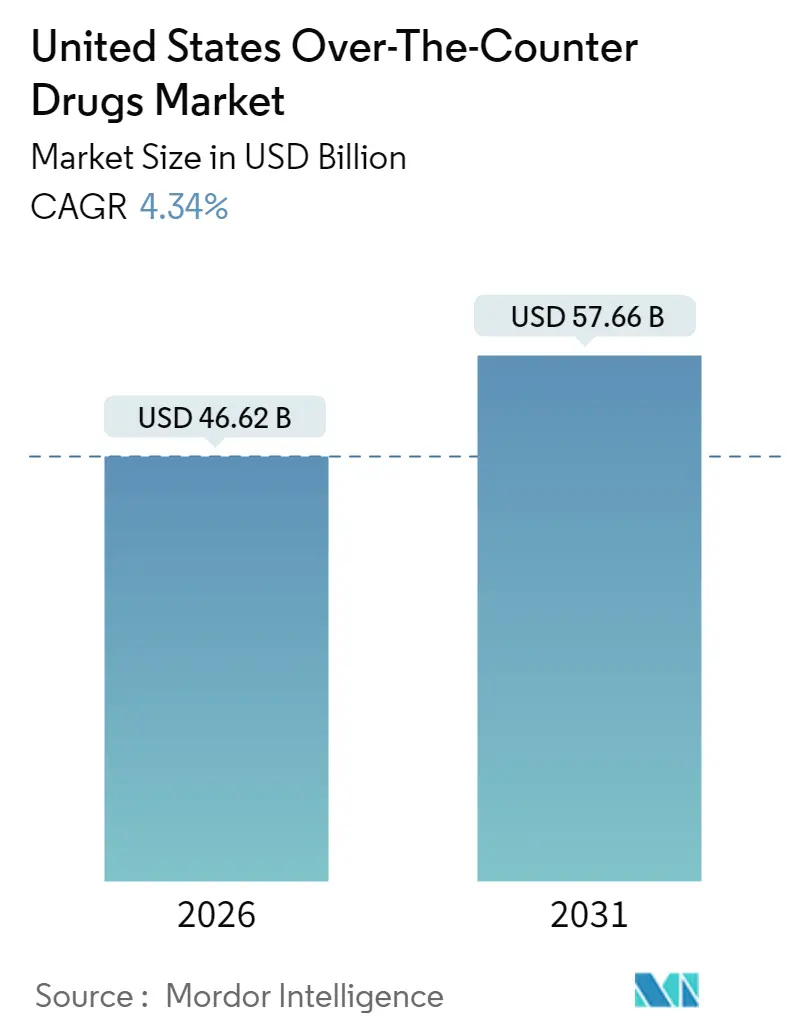
| Market Size (2026) | USD 46.62 Billion |
| Market Size (2031) | USD 57.66 Billion |
| Growth Rate (2026 - 2031) | 4.34% CAGR |
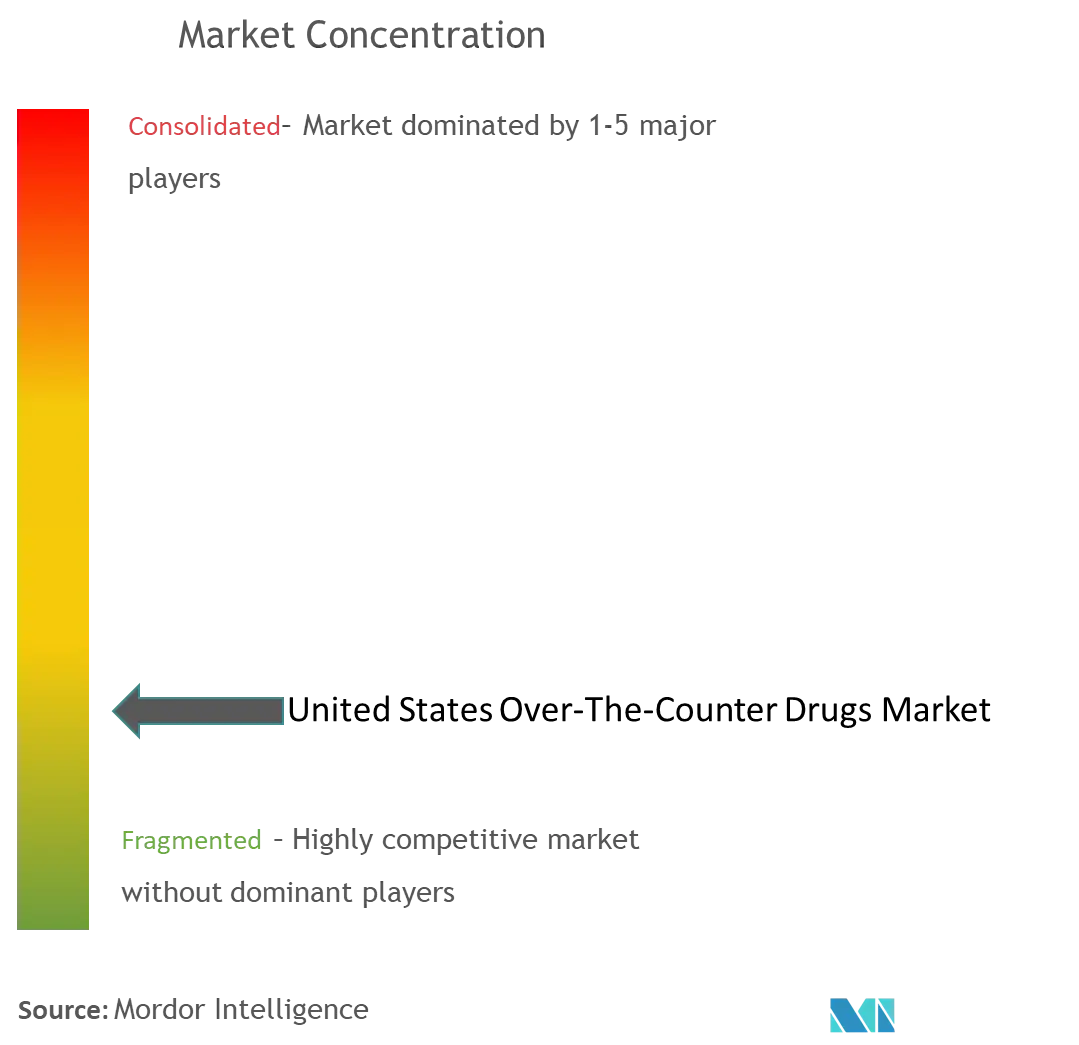
| Market Concentration | Low |
Major Players *Disclaimer: Major Players sorted in no particular order Image © Mordor Intelligence. Reuse requires attribution under CC BY 4.0. | |
United States Over-The-Counter Drugs Market Analysis by Mordor Intelligence
The United States Over-The-Counter Drugs market was valued at USD 44.68 billion in 2025 and estimated to grow from USD 46.62 billion in 2026 to reach USD 57.66 billion by 2031, at a CAGR of 4.34% during the forecast period (2026-2031). The United States Over-The-Counter Drugs market is benefiting from rising self-care habits, streamlined FDA monograph reforms and digital commerce adoption, even as compliance costs and safety oversight introduce friction. Brand owners are intensifying Rx-to-OTC switch programs to extend product lifecycles, while retailers are scaling private-label offerings that pressure legacy margins. Online pharmacies, same-day delivery networks and integrated telehealth platforms are widening consumer access, especially in rural communities where traditional pharmacy density remains low. Larger manufacturers are also capitalizing on cost synergies from recent consolidation, allowing them to absorb elevated OMUFA fees and accelerate innovation cycles.
Key Report Takeaways
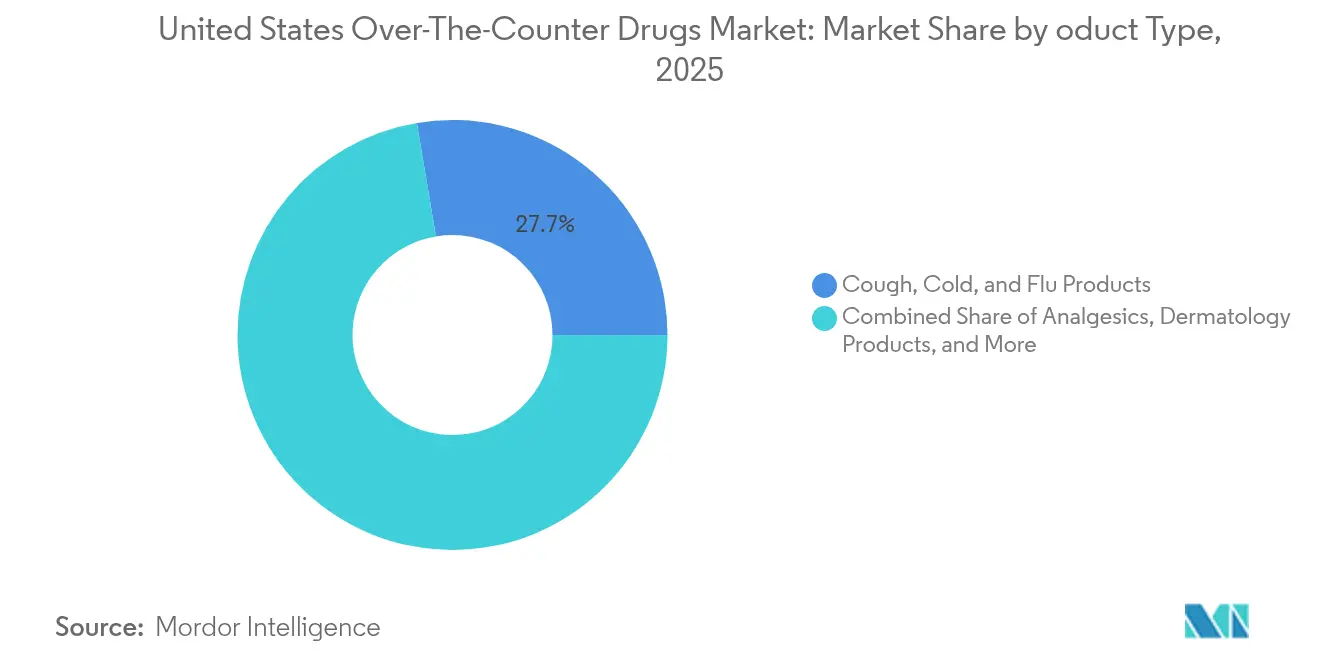
- By product type, cough, cold, and flu remedies led with 27.65% revenue share in 2025, whereas weight-loss and dietary supplements are forecast to expand at a 9.65% CAGR through 2031.
- By distribution channel, retail pharmacies held 60.85% of the United States Over-The-Counter Drugs market share in 2025, while online pharmacies are projected to post the fastest growth at 18.14% CAGR to 2031.
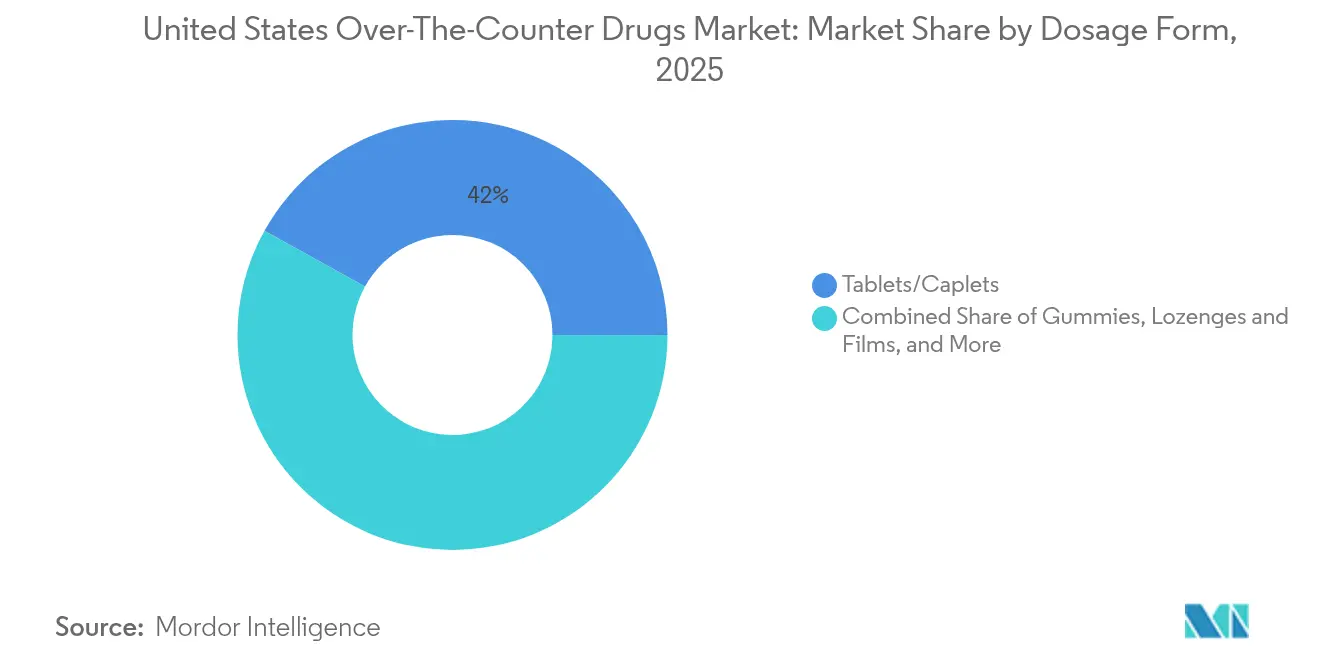
- By dosage form, tablets and caplets commanded a 41.95% share of the United States Over-The-Counter Drugs market in 2025; gummies and chewables are advancing at a 11.95% CAGR between 2026 and 2031.
- By route of administration, oral products captured a 73.55% share and are expected to register a 9.66% CAGR over the forecast period.
- By category, branded OTC lines accounted for a 52.05% share in 2025, whereas private-label portfolios are on track for an 8.58% CAGR through 2031.
Note: Market size and forecast figures in this report are generated using Mordor Intelligence’s proprietary estimation framework, updated with the latest available data and insights as of January 2026.
United States Over-The-Counter Drugs Market Trends and Insights
Drivers Impact Analysis
| Driver | (~) % Impact on CAGR Forecast | Geographic Relevance | Impact Timeline |
|---|---|---|---|
| High Cost Of Prescription Drugs Driving Switch To OTC | +0.80% | National, concentrated in uninsured populations | Medium term (2-4 years) |
| Rising Trend Of Self-Care And Consumer-Health Awareness | +1.20% | National, strongest in urban metros | Long term (≥ 4 years) |
| Growing Number Of FDA Rx-To-OTC Switch Approvals | +0.60% | National regulatory impact | Short term (≤ 2 years) |
| Expansion Of Digital-Therapeutic Adjacent OTC Bundles | +0.40% | Tech-forward markets, West Coast leadership | Medium term (2-4 years) |
| AI-Powered Personalized OTC Recommendations In Pharmacies | +0.30% | Major pharmacy chains, urban deployment | Long term (≥ 4 years) |
| Growing Availability Of OTC Products Via E-Commerce Channels | +0.90% | National, rural market penetration focus | Medium term (2-4 years) |
| Source: Mordor Intelligence | |||
High Cost of Prescription Drugs Driving Switch to OTC
Escalating prescription prices are encouraging consumers to substitute or supplement therapies with OTC alternatives. FDA approvals of Opill as the first OTC progestin-only contraceptive and Narcan nasal spray for opioid overdose underscore a regulatory openness to broader non-prescription access.[1]U.S. Food and Drug Administration, “OTC Monograph Reform User Fees FY 2025,” fda.gov Cialis is progressing through the actual-use study pathway, marking the first PDE-5 inhibitor positioned for OTC status and signaling a multibillion-dollar self-treatment opportunity. These developments particularly resonate with uninsured households and high-deductible plan members who value immediate, lower-cost relief. The United States Over-The-Counter Drugs market consequently benefits from higher switching intent and retail foot traffic. Pharmacists are expanding advisory roles, reinforcing consumer confidence in self-care choices, and sustaining demand momentum.
Rising Trend of Self-Care and Consumer-Health Awareness
Pandemic-era routines normalized daily supplement use, mindfulness practices, and at-home diagnostics. Consumers favor flavorful delivery formats; gummy vitamins have gained mainstream appeal and now occupy more than one-third of supplement unit sales. Women’s health formulations and stress-relief botanicals are extending the addressable base beyond traditional multivitamin shoppers. Social media influencers and digital wellness apps amplify education, fueling trial and repeat purchases. As a result, the United States Over-The-Counter Drugs market enjoys durable tailwinds from preventative consumption habits that cut across age and income cohorts. Brand owners respond by launching personalized SKUs, clean-label claims, and subscription refill models that heighten engagement and mitigate churn.
Growing Number of FDA Rx-to-OTC Switch Approvals
Monograph reform now permits administrative orders in lieu of lengthy notice-and-comment rulemaking, slashing approval lead-times from years to months for compliant ingredients.[2]Consumer Healthcare Products Association, “OTC Retail Sales 2024,” chpa.org Recent transitions, such as Nasonex 24HR, expand non-prescription therapy options while alleviating physician workload. For manufacturers, earlier lifecycle optimization and broader distribution offset patent erosion in prescription lines. The United States Over-The-Counter Drugs market gains both expanded assortment and renewed promotional activity as firms vie for front-of-store visibility. Retailers leverage the launch cadence to craft bundled wellness solutions that marry switched actives with complementary supplements or devices.
Growing Availability of OTC Products Via E-Commerce Channels
Convenience and confidentiality fuel online demand, with subscription savings and one-click refills resonating among chronic ailment sufferers. Amazon has rolled out same-day OTC delivery to nearly half of U.S. consumers and is scaling proprietary store brands for price-sensitive segments.[3]American Hospital Association, “Hospital and Health System Digital Transformation 2025,” aha.org Rural populations in pharmacy deserts particularly benefit from doorstep access, lifting category penetration beyond historical urban strongholds. Yet increased digital volume invites counterfeit risk; the FDA has issued multiple warning letters to online sellers for distributing unapproved analgesics. The United States Over-The-Counter Drugs market, therefore, faces a dual imperative: capture e-commerce growth while fortifying supply-chain authentication.
Restraints Impact Analysis
| Restraint | (~) % Impact on CAGR Forecast | Geographic Relevance | Impact Timeline |
|---|---|---|---|
| Stringent FDA Monograph-Reform Compliance Costs | -0.70% | National manufacturing impact | Short term (≤ 2 years) |
| Safety Concerns Over Misuse Of OTC Analgesics | -0.40% | National, youth-focused restrictions | Medium term (2-4 years) |
| Rising E-Commerce Counterfeit OTC Penetration | -0.30% | Online channels, rural vulnerability | Medium term (2-4 years) |
| Regulatory Scrutiny Over Opioid-Based OTC Products | -0.20% | National, controlled substance protocols | Long term (≥ 4 years) |
| Source: Mordor Intelligence | |||
Stringent FDA Monograph-Reform Compliance Costs
OMUFA facility and order fees rose 10% in FY 2025, with Tier 1 OMOR assessments climbing to USD 559,777 as per the Federal Register. Smaller manufacturers confront capital strain as they upgrade documentation, quality systems, and plant infrastructure, while larger peers absorb costs through scale efficiencies and strategic acquisitions. Consolidation is therefore accelerating; well-capitalized firms exploit distressed valuations to bolster portfolios and distribution leverage. Although near-term financial burdens temper innovation by niche players, the United States Over-The-Counter Drugs market ultimately may benefit from standardized quality and more predictable regulatory oversight.
Safety Concerns Over Misuse of OTC Analgesics
Rising reports of adolescent diphenhydramine challenges on social media and acetaminophen overdoses triggered renewed calls for packaging safeguards and dosage-cap reductions. Legislators in several states are exploring age restrictions, which could fragment labeling requirements and complicate nationwide supply chains. Manufacturers are evaluating unit-dose blister packs, QR-code education, and tamper-evident seals to mitigate misuse. Retailers, meanwhile, pilot pharmacist-led counseling at checkout for high-risk SKUs. Heightened vigilance moderates consumption growth in analgesics; however, transparent safety measures can reinforce trust across the United States Over-The-Counter Drugs market.
Segment Analysis
By Product Type: Weight-Loss Supplements Capitalize on GLP-1 Momentum
The segment generated the largest revenue pool in 2025 when cough, cold, and flu remedies held a 27.65% share of the United States Over-The-Counter Drugs market. Seasonal incidence patterns keep manufacturers agile on inventory and promotion planning. Weight-loss and dietary supplements are accelerating at a 9.65% CAGR as consumers use fiber, probiotics, and nutrient blends to complement GLP-1 therapies. Private-label entrants emphasize metabolic support and side-effect mitigation formulas, forcing legacy brands to diversify SKUs and invest in clinical substantiation. The United States Over-The-Counter Drugs market size for weight-management aids is set to broaden as more prescription obesity treatments receive over-the-counter extensions, enlarging cross-category basket rings.
Demand for analgesics remains steady, underpinned by long-term musculoskeletal conditions among aging cohorts seeking non-opioid relief. Vitamins, minerals, and specialty botanicals tap preventive health priorities, bolstered by growing evidence around immune resilience. Dermatology-led topicals and acne patches find traction on TikTok and Instagram, engaging younger demographics with instant visual results. Innovative ophthalmic solutions address digital-device eye strain, expanding shelf space in mass retail. Intensifying competition compels brands to differentiate through functional claims, clean-label ingredients, and subscription logistics that elevate lifetime value within the United States Over-The-Counter Drugs market.
Note: Segment shares of all individual segments available upon report purchase
By Distribution Channel: Online Surge Challenges Traditional Retail
Retail pharmacies preserved 60.85% of the United States Over-The-Counter Drugs market share in 2025, owing to professional counsel, immediacy of acquisition, and insurance tie-ins for prescription pickups. Chain banners invest in loyalty ecosystems, drive-thru lanes, and wellness clinics to defend footfall. Nevertheless, online pharmacies are scaling at an 18.14% CAGR through 2031 as frictionless ordering and next-hour fulfillment reset expectations. Amazon, CVS, and Walgreens deploy AI demand engines to synchronize promotions, inventory, and auto-refill triggers, thereby widening digital margins.
Hospital pharmacies cater to acute-care formulary needs but represent a modest retail OTC contribution. Grocery and convenience outlets capture impulse purchases for pain, allergies, and digestive relief near checkout. Over the forecast horizon, blended models will rise—click-and-collect, locker pickups, and in-app telepharmacy sessions—blurring lines between physical and virtual shelves. The United States Over-The-Counter Drugs market will reward operators that unify pricing, authentication, and personalized recommendations across omnichannel touchpoints.
By Dosage Form: Gummies Revolutionize Consumer Preferences
Tablets and caplets controlled 41.95% of the 2025 category revenues due to low production costs and accurate dosing that aligns with clinician guidance. The format remains dominant in analgesics, antacids, and antihistamines, where regimen adherence is critical. However, gummies and chewables are expanding at 11.95% CAGR, transforming the supplement landscape as texture and flavor offset pill fatigue and promote routine compliance among children and seniors.
Liquids and syrups provide swift bioavailability and are favored in pediatric cold and pain SKUs. Nasal sprays, eye drops, and transdermal creams integrate advanced delivery technologies that offer localized relief and minimize systemic exposure. Brands enhance convenience with stick packs and on-the-go blister cards, reflecting a broader packaging innovation race inside the United States Over-The-Counter Drugs market. The United States Over-The-Counter Drugs market size tied to gummy formulations is poised to escalate as plant-based pectin matrices support sugar-reduced offerings and expand positioning into sleep, immunity, and beauty benefits.
Note: Segment shares of all individual segments available upon report purchase
By Route of Administration: Oral Dominance Faces Innovation Pressure
Oral products generated 73.55% of revenues in 2025, retaining familiarity, dosing flexibility, and cost leadership, and they are forecast to post a healthy 9.66% CAGR. Yet topical delivery is gaining prominence where targeted action or cosmetic overlap is desired, such as lidocaine patches for back pain or salicylic acid pads for acne.
Nasal administration advances through allergy and congestion therapies freshly released from prescription control, with Nasonex 24HR as a recent exemplar. Ophthalmic formats benefit from rising digital eye strain, prompting manufacturers to bundle preservative-free formulas and reusable droppers. Rectal and vaginal routes remain niche, serving pediatric fever management and feminine hygiene pain relief respectively. Collectively, modality diversity broadens the total addressable United States Over-The-Counter Drugs market, granting consumers greater alignment between therapeutic goal and delivery comfort.
By Category: Private Label Gains Ground Against Branded Giants
Branded lines enjoyed a 52.05% share of 2025 revenue on the strength of marketing budgets, heritage trust, and physician endorsements. Yet private-label penetration is scaling at an 8.58% CAGR as retailers harness loyalty card insights to launch functionally equivalent SKUs, often priced 20-30% lower. CVS aims for an 18–20% private-label mix of front-end sales, while Walgreens prioritizes innovation attributes over straight imitation to secure premium perception.
Generic OTCs occupy the value tier, supplying public insurers and discount chains seeking affordability. Branded incumbents respond with line extensions, combination packs, and digital adherence apps to reinforce differentiation. Margin convergence is likely as supply-chain rationalization compresses cost gaps and as quality parity messaging reassures shoppers. The United States Over-The-Counter Drugs market size attributable to store brands will thus grow faster than the headline market, pressuring traditional manufacturers to reevaluate pricing power and co-marketing investments.
Geography Analysis
Regional consumption patterns within the United States Over-The-Counter Drugs market reflect demographic density, income distribution, regulatory variance, and healthcare infrastructure disparities. California and New York collectively command the largest spending pools owing to sizable urban populations and higher disposable incomes, although growth in these states is moderating as category maturity sets in. Texas and Florida deliver above-average volume expansion, supported by rapid in-migration, aging cohorts, and higher prevalence of metabolic disorders that spur chronic OTC usage.
The Midwest experiences stable replacement demand, yet rural counties reveal underserved segments where pharmacy closures have limited physical access. E-commerce thus becomes an essential bridge, with same-day logistics networks extending coverage to zip codes previously classified as pharmacy deserts. The Southeast attracts manufacturing investment thanks to competitive energy rates and favorable tax incentives, helping local employers defray OMUFA cost hikes.
Regulatory interpretations vary at the state level, particularly for pseudoephedrine purchase limits and potential diphenhydramine age-gating, creating patchwork compliance obligations. Nonetheless, federal monograph harmonization offers nationwide predictability for most established ingredients, sustaining launch pipelines. Taken together, the United States Over-The-Counter Drugs market demonstrates a north-south and urban-rural bifurcation that encourages tailored merchandising, pricing and telepharmacy outreach strategies.
Competitive Landscape
The United States Over-The-Counter Drugs market hosts a moderately concentrated slate of multinational firms, retail health conglomerates, and digitally native upstarts. Kenvue, Bayer, Haleon, and Sanofi lead revenue rankings, leveraging multi-category portfolios and advertising scale to maintain front-of-shelf dominance. Sanofi divested a 50% stake in Opella to finance novel prescription ventures while retaining a strategic consumer health presence. Pfizer completed its full exit from Haleon in 2025, underscoring the sector’s capital-allocation recalibration.
Retailers are no longer mere distributors; CVS and Walgreens integrate AI-driven recommendation engines and in-store health hubs that amplify private-brand velocity. Amazon blends marketplace algorithms with proprietary OTC SKUs, threatening to reroute demand away from brick-and-mortar aisles. Contract manufacturers consolidate to achieve volume thresholds that justify OMUFA fee outlays, while niche botanical and women’s health start-ups exploit DTC channels for focused community engagement.
Sustainability and ESG narratives gain prominence as consumers seek recyclable packaging and cruelty-free sourcing. Digital authentication and serialization technologies, promoted through QR codes, counter counterfeit infiltration especially in online supply chains. Overall, technological fluency and portfolio agility will shape competitive outcomes across the United States Over-The-Counter Drugs market as stakeholders balance regulatory compliance, brand equity and omnichannel economics.
United States Over-The-Counter Drugs Industry Leaders
Kenvue Inc.
Haleon plc
Bayer AG
Reckitt Benckiser Group plc
Sanofi
- *Disclaimer: Major Players sorted in no particular order
Recent Industry Developments
- January 2025: Sanofi’s Opella division cleared an FDA milestone for the OTC migration of Cialis, opening a first-in-class self-care pathway for erectile dysfunction.
- December 2024: Reckitt inaugurated its largest U.S. OTC production plant to enhance supply resilience and scale capacity for health and hygiene brands.
- August 2024: Bayer filed an NDA for elinzanetant to address menopausal vasomotor symptoms, signaling continued consumer-centric R&D.
- July 2024: Cooper Consumer Health acquired Viatris’s OTC business, expanding its European product footprint.
Research Methodology Framework and Report Scope
Market Definitions and Key Coverage
Our study defines the United States over-the-counter (OTC) drugs market as all non-prescription medicines that carry an FDA-approved monograph or NDA switch and are sold through retail, hospital, or online pharmacies to end consumers. Products include analgesics, cough-cold remedies, gastrointestinal aids, dermatology treatments, ophthalmic drops, and vitamins sold as medicines, but not dietary supplements.
Scope exclusion: herbal or sports nutrition products regulated as foods, behind-the-counter pseudoephedrine packs, and medical devices are outside this definition.
Segmentation Overview
- By Product Type
- Cough, Cold & Flu Products
- Analgesics
- Dermatology Products
- Gastrointestinal Products
- Vitamins, Minerals & Supplements (VMS)
- Weight-loss / Dietary Products
- Ophthalmic Products
- Sleeping Aids
- Other Product Types
- By Distribution Channel
- Hospital Pharmacies
- Retail Pharmacies
- Online Pharmacies
- Convenience / Grocery Stores
- By Dosage Form
- Tablets & Caplets
- Liquids & Syrups
- Gummies & Chewables
- Sprays & Drops
- Topicals & Ointments
- By Route of Administration
- Oral
- Topical
- Nasal
- Ophthalmic
- Rectal / Vaginal
- By Category
- Branded OTC
- Private-label / Store Brands
- Generic OTC
Detailed Research Methodology and Data Validation
Primary Research
Mordor analysts completed expert interviews with pharmacists, buying heads at grocery and mass-merchandise chains, and regulatory consultants across the Northeast, Midwest, and Sunbelt states. These discussions clarified true-to-shelf average selling prices, seasonality for cough-cold lines, and likely uptake curves for recent Rx-to-OTC approvals, which were used to adjust model coefficients.
Desk Research
Analysts extracted baseline demand signals from tier-1 public sources such as the Consumer Healthcare Products Association, FDA Orange Book switch database, the CDC's National Ambulatory Medical Care Survey, and U.S. Census retail sales releases. Complementary insights came from company 10-Ks, investor decks, major pharmacy chain filings, and trade publications covering channel promotions. Subscription databases, including D&B Hoovers for company revenue splits and Dow Jones Factiva for transaction news, supplied granular checks on brand share and price moves.
Shipment values were cross-referenced with Volza import records and customs harmonized codes, while Questel patent trends flagged upcoming OTC switches that could alter the forecast base. The sources listed illustrate, not exhaust, the wider desk research pool applied during data compilation and cross-validation.
Market-Sizing & Forecasting
A top-down construct begins with 2024 consumer health expenditure and retail audit data, which are then filtered by OTC penetration rates and category-level ASP trends to deliver the 2025 market baseline. Select bottom-up roll-ups of sampled brand volumes from NielsenIQ scanner panels validate and fine-tune totals. Key variables feeding the model include Rx-to-OTC switch count, out-of-pocket prescription cost inflation, e-pharmacy share of traffic, flu incidence rate, and average unit price of private-label pain relievers. Forecasts deploy multivariate regression blended with scenario analysis for pandemic rebound and inflation persistence, producing a 2025-2030 CAGR aligned with consensus from our primary panels. Gaps where panel coverage is thin are bridged through price-volume elasticity curves calibrated on past switch events.
Data Validation & Update Cycle
Before sign-off, outputs pass variance checks against CHPA sales trackers and IRS retail statistics, followed by peer review across two analyst tiers. The model refreshes annually, with interim edits triggered by material FDA approvals, macro shocks, or greater than 5 percent variance in quarterly sales trackers.
Why Mordor's United States OTC Drugs Baseline Inspires Confidence
Published estimates differ because firms select varying product baskets, pricing bases, and refresh cadences. Some count nutraceuticals, others convert revenues at list rather than net prices, and update cycles range from yearly to triennial.
Key gap drivers include (a) inclusion of dietary supplements and CBD nutraceuticals, (b) application of gross-to-net discounts that diverge from retail realities, and (c) currency re-baselining and differing inflation adjustors.
Benchmark comparison
| Market Size | Anonymized source | Primary gap driver |
|---|---|---|
| USD 44.68 B | Mordor Intelligence | - |
| USD 54.60 B | Global Consultancy A | Counts nutraceuticals and OTC devices, applies list prices |
| USD 24.81 B | Trade Journal B | Excludes vitamins and online channel sales, uses 2023 ASPs unchanged |
In sum, Mordor's disciplined scope alignment with FDA monograph definitions, dual-path modeling, and annual refresh ensures a balanced, transparent baseline that decision-makers can trace back to observable retail and regulatory variables.
Key Questions Answered in the Report
What is the current United States Over-The-Counter Drugs market size?
The United States Over-The-Counter Drugs market size stands at USD 46.62 billion in 2026 and is forecast to reach USD 57.66 billion by 2031.
Which product segment is expanding the fastest?
Weight-loss and dietary supplements are projected to grow at a 9.65% CAGR through 2031, buoyed by consumer interest in GLP-1-adjacent metabolic support.
How quickly are online pharmacies growing?
Online pharmacies are expected to register an 18.14% CAGR during 2026-2031, easily outpacing brick-and-mortar channels amid rising demand for doorstep delivery.
What impact do OMUFA fees have on smaller manufacturers?
FY 2025 OMUFA fees rose 10%, creating financial pressure that may limit innovation by smaller firms and accelerate market consolidation toward larger incumbents.
Why are private-label OTC products gaining ground?
Retailers leverage shopper data to launch quality-parity private labels priced below national brands, enabling an 8.58% CAGR for the private-label category through 2031.
Which geographic areas present the greatest growth opportunity?
Texas and Florida show the highest growth potential owing to expanding populations and aging demographics that drive sustained OTC therapy demand.


