
United States Online Trading Platform Market Size and Share
Market Overview
| Study Period | 2020 - 2031 |
|---|---|
| Forecast Data Period | 2026 - 2031 |
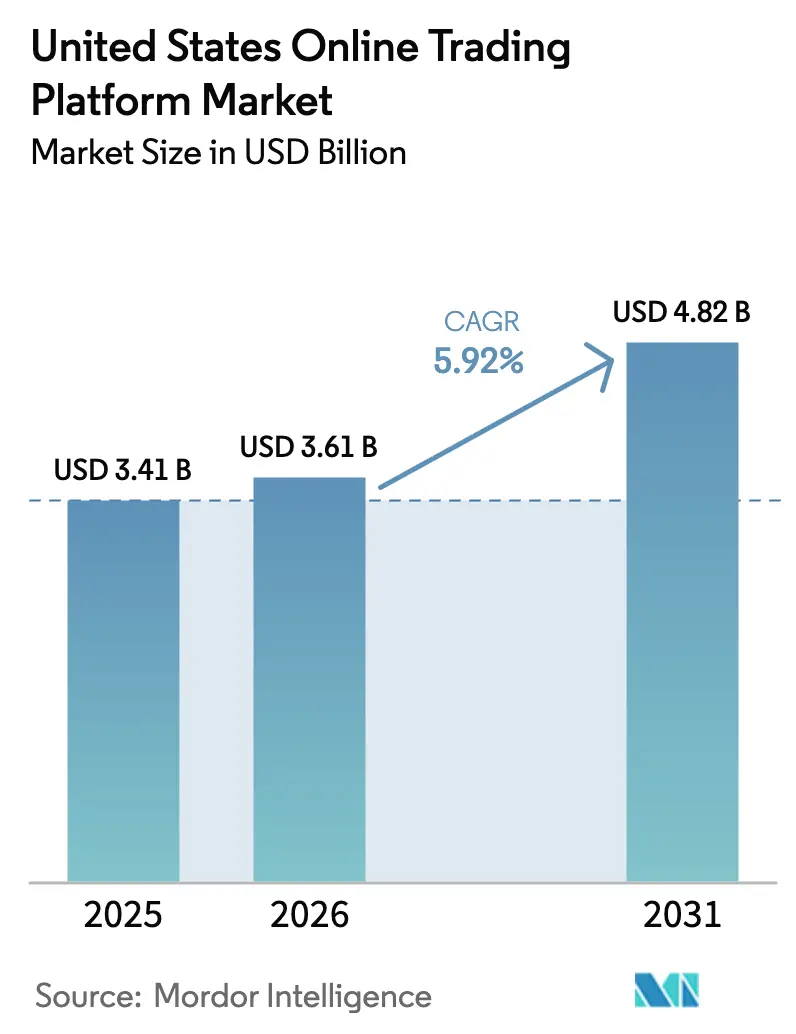
| Base Year Market Size (2025) | USD 3.41 Billion |
| Market Size (2026) | USD 3.61 Billion |
| Market Size (2031) | USD 4.82 Billion |
| Growth Rate (2026 - 2031) | 5.92 % |
| Market Concentration | Medium |
Major Players *Disclaimer: Major Players sorted in no particular order Image © Mordor Intelligence. Reuse requires attribution under CC BY 4.0. | |
United States Online Trading Platform Market Analysis by Mordor Intelligence
The US online trading platform market size was valued at USD 3.41 billion in 2025 and estimated to grow from USD 3.61 billion in 2026 to reach USD 4.82 billion by 2031, at a CAGR of 5.92% during the forecast period (2026-2031). Rising retail participation, reinforced by commission-free trades and fractional shares, is sustaining double-digit growth in new account openings while increasing platform operating scale requirements. Mobile-first design, cloud deployment, and AI-enabled analytics are expanding use cases beyond basic equity trading into fixed-income, crypto, and alternative assets. Meanwhile, compliance costs driven by FINRA’s proposed fee increases and the Securities and Exchange Commission’s (SEC) focus on AI governance are pressuring margins, tilting competitive advantage toward firms with broad asset bases and strong technology stacks. The tension between ease of access and regulatory scrutiny is expected to shape strategic investment in cybersecurity, data-privacy controls, and post-trade automation over the outlook period.
Key Report Takeaways
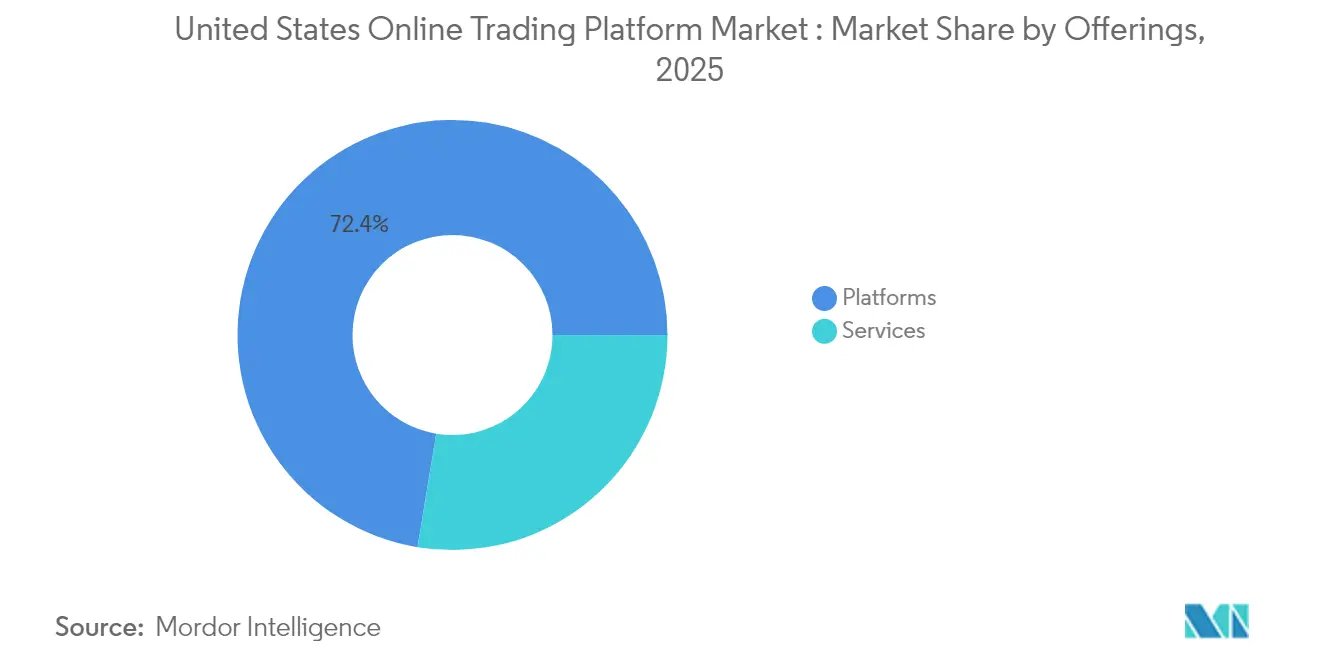
- By offerings, platforms led with 72.40% of US online trading platform market share in 2025, whereas services are on track to grow at a 7.78% CAGR through 2031.
- By deployment mode, cloud accounted for 61.40% share of the US online trading platform market size in 2025 and is expanding at 9.27% CAGR to 2031.
- By type, beginner-focused interfaces captured 56.30% revenue share in 2025; advanced platforms are projected to rise at an 8.12% CAGR to 2031.
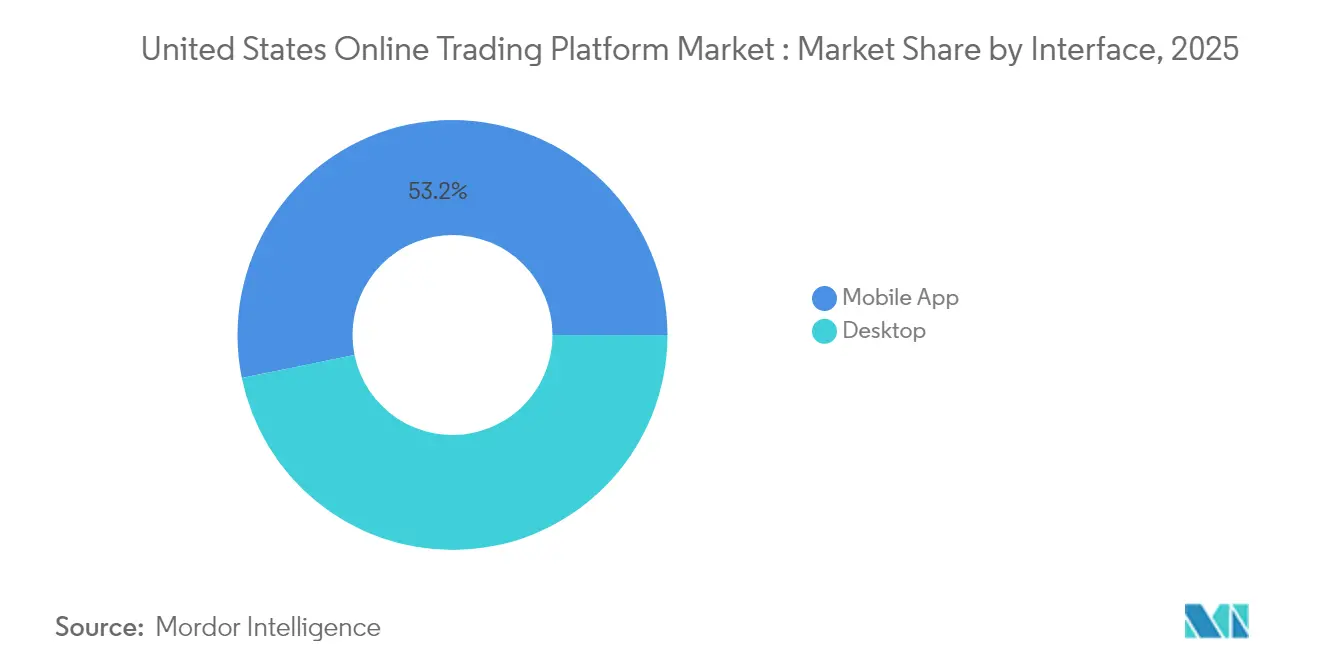
- By interface, mobile apps held 53.20% share of the US online trading platform market size in 2025, while desktop solutions are growing at 7.74% CAGR.
- By end user, retail investors dominated with 80.40% market share in 2025, yet institutional investors exhibit the fastest growth at 7.52% CAGR.
Note: Market size and forecast figures in this report are generated using Mordor Intelligence’s proprietary estimation framework, updated with the latest available data and insights as of 2026.
Worldwide, activity is shaped by contributions from multiple countries and regions, with United states representing one among them. The global report on online trading platform market by Mordor Intelligence reflects how these countries and regional layers combine into a single system.
United States Online Trading Platform Market Trends and Insights
Drivers Impact Analysis*
| Driver | (~) % Impact on CAGR Forecast | Geographic Relevance | Impact Timeline |
|---|---|---|---|
| Proliferation of commission-free trades & fractional shares | +1.8% | Global, with strongest impact in North America | Medium term (2-4 years) |
| Smartphone ubiquity accelerating mobile trading adoption | +1.5% | Global, particularly strong in APAC and North America | Short term (≤ 2 years) |
| AI-driven robo-advisory & predictive analytics integration | +1.2% | North America & EU leading, expanding to APAC | Long term (≥ 4 years) |
| Growing retail investor base (Gen Z & Millennials) | +1.0% | Global, with demographic concentration in urban centers | Medium term (2-4 years) |
| Diversification into crypto & alternative asset classes | +0.8% | North America leading, selective EU adoption | Medium term (2-4 years) |
| 24-hour trading windows unlocking after-hours liquidity | +0.6% | North America, with pilot expansions to other regions | Long term (≥ 4 years) |
| Source: Mordor Intelligence | |||
Proliferation of Commission-Free Trades and Fractional Shares
Commission-free pricing reshaped competitive positioning by removing cost barriers and shifting monetization toward payment-for-order-flow and cash-management yields. Robinhood’s 2024 revenue of USD 2.95 billion, with 61% sourced from order flow, illustrates how ancillary income models offset zero-commission execution.[1] Fractional trading broadens access to high-price equities and serves as an acquisition funnel for first-time investors. Academic evidence shows micro-lot trades contain useful liquidity signals that tighten spreads over time. Platforms continue introducing USD 1 entry-points to capture untapped share in lower-income cohorts, but the resulting order-flow concentration heightens regulatory focus on best-execution quality.
Smartphone Ubiquity Accelerating Mobile Trading Adoption
More than 64% of Gen Z and 68% of Millennials prefer mobile banking, reinforcing a mobile-first orientation in brokerage design.[2] AI-enabled sentiment engines embedded in apps reduce manual research time and can lower operating costs by 25% for institutions adopting algorithmic support. Social-trading features, however, nudge risk-taking: peer-performance feeds correlate with larger bet sizes yet lower satisfaction when volatility rises. Regulators are evaluating whether gamified prompts overstimulate trading frequency, signalling future disclosure mandates on behavioral nudges.
AI-Driven Robo-Advisory & Predictive Analytics Integration
Assets managed by robo-advisors surpassed USD 1 trillion in 2025 and continue to rise despite documented trust gaps among low-income households.[3] The SEC’s penalties against two advisers for “AI-washing” underscore enforcement around marketing accuracy. Hybrid models that blend machine outputs with human oversight record higher adherence rates and mitigate behavioral inertia, suggesting an emerging standard rather than full autonomy. Platforms investing in explainable AI stand to improve conversion among cautious demographics and differentiate on transparency.
Growing Retail Investor Base (Gen Z & Millennials)
Transfers by investors under 40 have tripled over the past decade, placing sustained demand on digital channels.[4] Participation rates rose faster among Black and Hispanic investors, indicating progress in financial inclusion. Social-media-driven episodes such as WallStreetBets demonstrated collective influence, but academic review reveals negative holding-period returns on positions opened at peak chatter, reinforcing education needs. Platforms integrating financial-literacy modules can improve retention while satisfying upcoming SEC guidance on digital engagement practices.
Restraints Impact Analysis*
| Restraint | (~) % Impact on CAGR Forecast | Geographic Relevance | Impact Timeline |
|---|---|---|---|
| Heightened cyber-security & data-privacy breaches | -1.2% | Global, with acute impact in North America and EU | Short term (≤ 2 years) |
| Complex & evolving SEC / CFTC / FINRA compliance costs | -0.8% | North America, with spillover to global operations | Medium term (2-4 years) |
| Looming ban/reform of Payment-for-Order-Flow (PFOF) model | -0.7% | North America, with potential global regulatory spillover | Medium term (2-4 years) |
| Market saturation among discount brokers squeezing margins | -0.5% | North America, with selective impact in mature markets | Long term (≥ 4 years) |
| Source: Mordor Intelligence | |||
Heightened Cyber-Security & Data-Privacy Breaches
The probability of extreme loss events from cyber incidents quadrupled since 2017, magnifying systemic risk across interconnected trading ecosystems. FINRA’s 2025 report flags new account fraud and quantum-computing vulnerabilities as near-term threats. The 2023 ransomware attack that disrupted 60 credit unions spotlighted third-party dependency risk. Average phishing breach costs remain modest in headline terms, but potential reputational erosion for platforms handling margin balances is far higher. Cyber-resilience investment and multi-factor authentication protocols are becoming core differentiators alongside execution quality.
Complex & Evolving SEC / CFTC / FINRA Compliance Costs
FINRA is phasing in fee increases that will add USD 450 million in annual costs by 2029. The 2025 SEC examination priorities expand oversight into AI deployment, T+1 post-trade timing, and record-keeping of off-channel communications. Implementation of the Securities Lending and Transparency Engine introduces granular reporting fees, while T+1 settlement compresses reconciliation windows and elevates real-time automation requirements. Record penalties of USD 8.2 billion in 2024 illustrate rising financial exposure from compliance lapses. Platforms with mature governance frameworks and scalable cloud infrastructure will absorb these costs more effectively, reinforcing consolidation trends.
*Our forecasts treat driver/restraint impacts as directional, not additive. The impact forecasts reflect baseline growth, mix effects, and variable interactions.
Segment Analysis
By Offerings: Platforms Consolidating Service Integration
Platforms captured 72.40% revenue in 2025 and remain the anchor around which value-added services are layered. The US online trading platform market size for platforms is poised to expand steadily as integrated research, margin lending, and cash-management features enhance stickiness. Services grow at an 7.78% CAGR, signaling that consulting, advisory APIs, and third-party data feeds drive incremental revenue without forcing full stack development. Competitive differentiation is shifting from raw execution speed toward breadth of ancillary capabilities such as tax-loss harvesting or ESG screening. Elevated compliance overhead accelerates platform mergers, allowing acquirers to spread regulatory costs and monetize through cross-selling. Conversely, niche providers are positioning as service-layer partners rather than standalone brokers, inserting themselves into platform ecosystems via open APIs.
The pricing pivot away from commissions increases reliance on net interest income and payment-for-order-flow rebates, exposing revenue to rate cycles and policy shifts. Service providers delivering algorithmic best-execution analysis or liquidity sourcing models gain importance as platforms seek to defend spreads amid scrutiny. The US online trading platform market will likely witness hybrid revenue stacks where core platform access remains free, while premium analytics, coaching, or tax tools follow a subscription or usage-based model. This twin-track strategy helps stabilize earnings against volume volatility and aligns product roadmaps with user sophistication curves.

By Deployment Mode: Cloud Accelerates Efficiency
Cloud deployments held 61.40% share in 2025 and grew fastest at 9.27% CAGR, underscoring strategic preference for elastic capacity, micro-services architecture, and embedded security updates. The US online trading platform market share advantage for cloud is amplified by the push toward 24-hour trading windows and real-time settlement that strain legacy on-premises data centers. Cloud native analytics shorten release cycles, enabling rapid compliance patching when regulations shift. Major providers are introducing FINRA-ready logging templates and isolated tenancy modules that mitigate data-sovereignty concerns, persuading previously reluctant institutional clients.
On-premises systems persist where ultra-low latency or proprietary hardware acceleration is non-negotiable, such as high-frequency trading desks. Yet even these users adopt hybrid stacks, routing less sensitive workloads to the cloud for cost savings. As the US online trading platform industry standardizes post-trade messaging around ISO 20022 and real-time affirmation, cloud’s scalability becomes vital. Vendor concentration risk is addressed through multi-cloud failover architectures and zero-trust network frameworks. Cloud adoption also supports environmental mandates, with providers offering renewable-energy credits that help platforms meet ESG disclosure requirements
By Type: Advanced Platforms Attract Sophisticated Users
Beginner-focused apps secured 56.30% share in 2025 by simplifying onboarding and promoting micro-investing. Nevertheless, advanced platforms are sprinting ahead at 8.12% CAGR, reflecting user migration toward deeper analytics, conditional orders, and multi-asset coverage. The US online trading platform market size for advanced tiers is expanding as experienced investors prioritize direct-market-access and smart-routing engines that reduce slippage. Advanced platforms typically charge modest commissions or tiered subscriptions, cushioning them from swings in order-flow revenue and aligning incentives with execution quality.
Gamification tactics that once drove engagement for beginners face regulatory examination, nudging providers to add risk controls and educational overlays. As portfolios grow, users seek performance attribution tools, tax-efficient rebalancing, and cross-asset correlation dashboards. Advanced platforms integrate these modules, potentially in partnership with third-party fintech engines, to capture migrating users. Success hinges on balancing complexity with usability, ensuring that interface depth does not overwhelm but progressively unveils sophisticated functions.
By Interface: Desktop Regains Momentum Among Serious Traders
Mobile held 53.20% share in 2025, but desktop usage is reviving with 7.74% CAGR as frequent traders revert to larger screens for multimonitor charting and keyboard shortcuts. Deep option-chain analytics, strategy builders, and algorithm back-testing engines perform better on desktop environments. The US online trading platform market size attached to desktop users reflects higher average revenue per account, as this cohort often trades derivatives and maintains margin balances. Mobile retains primacy for rapid order entry and portfolio monitoring; however, interoperability across devices becomes a hygiene factor.
Desktop innovation focuses on customizable workspaces, latency-optimized data feeds, and AI-assisted scripting that transforms natural-language instructions into executable code. Meanwhile, mobile apps are evolving toward micro-learning hubs, pushing bite-sized market insights and risk alerts. Platforms achieving seamless state-sync between devices reinforce loyalty and limit account portability. Regulatory proposals targeting behavioral prompts could reshape mobile interface design, further elevating desktop’s analytical edge among professionals.
By End User: Institutional Uptake Accelerates
Retail investors account for 80.40% share, anchoring platform economics through scale of individual accounts. Institutional investors, however, are growing at 7.52% and require advanced order-management systems, compliance reporting, and connectivity into custodial workflows. As wealth managers digitize front-office interactions, the US online trading platform market opens new subscription revenue for white-label dashboards and digital-advice portals. Institutions also view digital channels as distribution arms for model portfolios, structured notes, and private-market allocations.
Retail flows remain sensitive to macro-volatility and social-media sentiment, demanding robust customer-support and real-time risk education. Institutional flows, by contrast, provide steadier asset levels and contribute to liquidity depth that benefits retail price discovery. Platforms that tailor feature sets-automated Model Delivery for advisors and community chat moderation for retail-capture synergies while satisfying divergent compliance obligations. Growth in both cohorts suggests a future where multi-segment architectures outcompete single-segment incumbents.
Geography Analysis
The United States remains the focal point of the US online trading platform market, supported by equity markets representing 47.4% of global capitalization and a rule framework that balances investor protection with innovation. The May 2024 shift to T+1 settlement improved affirmation rates and reduced trade fails, demonstrating operational resilience. National adoption of spot Bitcoin ETFs in 2024 widened asset coverage, stimulating incremental order flow in the US online trading platform market. State-level variations, particularly around digital-asset licensing, inject complexity; platforms often segment functionality by residency to comply with divergent rules.
Urban regions exhibit higher penetration, driven by concentration of Gen Z and Millennial users. Rural adoption lags but is accelerating via financial-literacy initiatives and improved broadband coverage. Federal Reserve policy directly influences platform revenue through margin rates and cash sweep yields. Tightening cycles expand net-interest income, while easing phases intensify competition for order flow. Meanwhile, cybersecurity statutes enacted in California and New York impose stricter breach-notification and vendor-risk standards, pushing nationwide firms to elevate baseline controls.
International expansion by US platforms remains measured. Europe’s progression toward T+1 by 2027 and debates in Asia over best-execution parity may ease cross-border scaling. However, data-localization laws and divergent stances on crypto custody constrain full-feature replication abroad. Partnerships with local broker-dealers or acquisition of licensed entities are emerging as preferred entry modes. Conversely, foreign platforms eyeing US entry face high compliance thresholds, especially around pattern-day-trading rules and consolidated audit-trail reporting.
Regulatory Landscape
The United States online trading platform market operates under a layered regime led by the Securities and Exchange Commission (SEC), supported by FINRA and, where applicable, the CFTC, along with state securities and banking regulators. In 2026, retail-investor protection remains a central enforcement theme through requirements tied to Regulation Best Interest (Reg BI) and Form CRS. Examination and oversight also extend to how platforms use AI in customer interactions and disclosures, alongside tighter expectations for cybersecurity and data-handling practices.
Market structure and risk controls are further shaped by self-regulatory rulemaking and implementation milestones. FINRA actions in 2026, including the April 2026 amendment to FINRA Rule 4210 that updates margin treatment for active trading through intraday margin standards, increase the importance of real-time surveillance, margining, and supervisory controls. Across major broker-dealers such as Charles Schwab and Interactive Brokers, core compliance requirements continue to focus on capital and liquidity risk management, protection of customer assets, and documented supervisory procedures for third-party vendor outsourcing, reflecting regulator attention to outage and cyberattack propagation through external service providers.
Value Chain Analysis
The value chain for US online trading platforms starts with product and client acquisition, including digital onboarding, KYC/AML, funding rails, and customer support. It then moves into core platform operations such as order entry across mobile and desktop, market data, portfolio analytics, and risk controls. Execution and market access typically depend on routing and liquidity relationships (exchanges, market makers, and alternative venues), supported by monetization layers such as cash management, margin lending, and subscription analytics.
Post-trade processing links broker-dealers to clearing and custody functions, where settlement-cycle compression and higher reporting obligations increase the need for automation, resilient data pipelines, and audit-ready recordkeeping. Technology and outsourced services cover cloud infrastructure, cybersecurity tooling, identity and fraud prevention, and compliance monitoring, with vendor governance increasingly treated as a first-order risk in supervisory programs. On the demand side, retail investors drive scale, while institutional users pull platforms toward deeper OMS/EMS capabilities, reporting, and integration into advisor and custody workflows. Broader US global value chain linkages also influence operating inputs, since imported technology components and services complement domestic export-oriented activity, reinforcing the need for cross-border supplier continuity for data, software, and infrastructure used in platform delivery.
Competitive Landscape
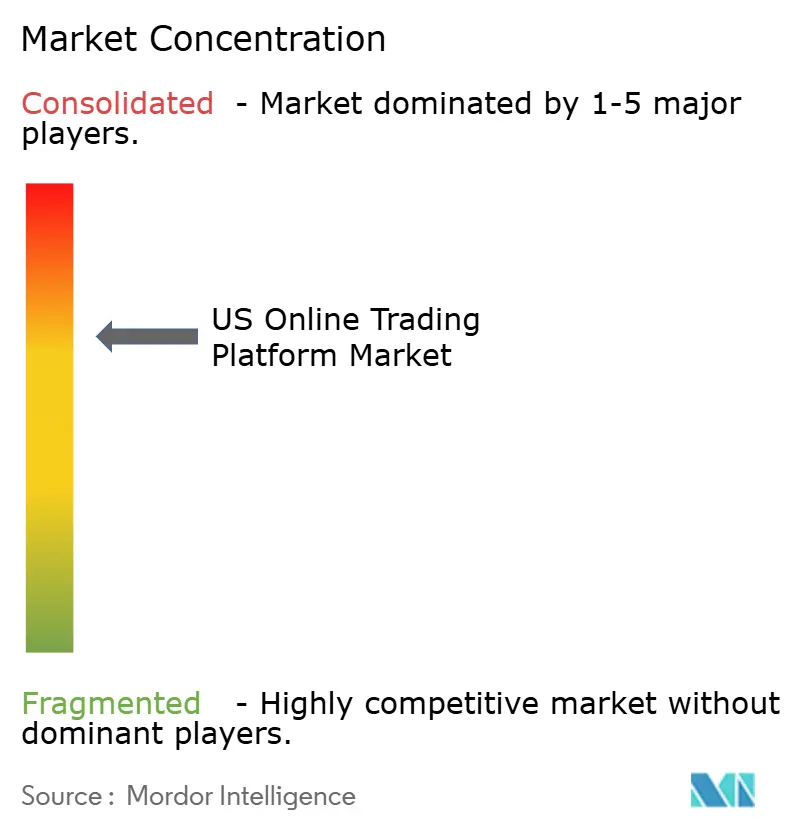
Market structure is moderately concentrated, with the five largest providers controlling a substantial portion of assets yet leaving room for niche innovators. Charles Schwab manages USD 10.1 trillion in client assets and Fidelity USD 13.7 trillion, leveraging scale to offset fee compression. Interactive Brokers competes through low-cost margin lending and global exchange connectivity. Consolidation continues, illustrated by Schwab’s absorption of TD Ameritrade, which unified technology stacks and broadened product coverage.
Strategic plays revolve around vertical integration—banking, advisory, and payments—aimed at lifting customer lifetime value and reducing churn. Simultaneously, horizontal diversification into crypto, futures, and prediction markets addresses asset-class migration. Schwab’s rollout of 24/5 trading and Interactive Brokers’ stock split both target liquidity expansion and retail share-of-wallet. Technology spending prioritizes AI-driven personalization, with natural-language trade assistants and anomaly-detection engines reducing support costs.
Regulation is reshaping competitive moats. Firms with robust compliance automation can onboard emerging products faster, creating time-to-market advantages. Conversely, rising fixed costs push smaller players toward white-label arrangements or niche specialization such as community-based ESG portfolios. Emerging entrants emphasize social-trading overlays but must contend with potential IOSCO rules limiting engagement gamification. In summary, scale, breadth of asset coverage, and compliance agility define positioning in the evolving US online trading platform market.
United States Online Trading Platform Industry Leaders
-
Fidelity Investments Institutional Operations Company, Inc.
-
The Charles Schwab Corporation
-
Interactive Brokers LLC
-
Merrill Lynch, Pierce, Fenner and Smith Inc. (Bank of America Corporation)
-
E*TRADE LLC (Morgan Stanley)
- *Disclaimer: Major Players sorted in no particular order
Market Opportunities and Future Outlook
Rising supervisory scrutiny of AI claims, digital engagement, and cyber-risk creates a whitespace for compliance-by-design capabilities delivered as productized tooling inside trading platforms. FINRA focus areas for 2026 point to the practical need for automated supervision, stronger controls around account takeover and fraud, and governance over third-party technology dependencies. That creates opportunities for embedded regtech modules, including surveillance, communications retention, model governance, and vendor-risk monitoring, which can reduce manual review cycles and shorten time-to-remediation.
Asset and venue expansion continues to open monetizable feature adjacencies beyond core equity trading. Charles Schwab announcing Schwab Crypto for spot crypto trading adds another mainstream distribution channel for bitcoin and ethereum within a brokerage experience. Interactive Brokers expanding AI-enabled workflows and launching a unified interface that connects prediction markets across Kalshi, CME Group, and ForecastEx reflects continued product depth for multi-venue access. These developments support opportunities for platforms and service-layer providers to differentiate through multi-asset packaging (crypto, fixed income, and alternatives), unified cross-venue order experiences, and institutional-grade personalization such as custom models and separately managed account toolkits for advisors and broker-dealer channels.
Recent Industry Developments
- July 2026: Fidelity Investments expanded its institutional separately managed account (SMA) lineup with six new custom strategies and two new model offerings. The expansion of institutional SMA offerings broadens institutional wealth management capabilities and platform stickiness for advisors and end clients.
- June 2026: Interactive Brokers LLC expanded agentic trading capabilities with integration of AI tools ChatGPT and Grok. The AI-enabled trading workflow enhancements strengthen competitive differentiation through AI-assisted research and execution across global markets.
- April 2026: Charles Schwab announced Schwab Crypto, a spot crypto trading offering for retail clients. This diversification of asset coverage broadens crypto access for retail clients.
Research Methodology Framework and Report Scope
Market Definition and Coverage
For this study, the market covers revenues earned from online trading platforms used in the United States to place, manage, and monitor investment trades through web and mobile interfaces, including platform software and related services tied to trading access and workflows.
Scope exclusions: The sizing excludes pure market-value of traded assets and broader securities brokerage revenue lines that are not directly attributable to the platform and its platform-linked service streams.
Segmentation Overview
- By Offerings
- Platforms
- Services
- By Deployment Mode
- Cloud
- On-Premises
- By Type
- Beginner-focused Platforms
- Advanced-trader Platforms
- By Interface
- Mobile App
- Desktop
- By End-user
- Retail Investors
- Institutional Investors
Data Sources, Market Sizing, and Validation
Desk Research
Desk research was used to set the market boundaries and to build the basic demand indicators that explain why platform revenues move over time. Public sources were reviewed to understand investor participation, trading activity, and regulatory changes that can influence platform usage and monetization.
We referenced non-paywalled sources such as SEC releases and enforcement updates, FINRA statistics and notices, Federal Reserve economic data (including rates that affect cash-sweep and margin economics), and U.S. Census and BEA series that help contextualize household financial activity. Supporting reads also included peer reviewed finance and fintech journals, company filings and investor presentations, association publications, and reputable financial press. Where needed, paid subscriptions were used only for company financials and intelligence, news and financials, and patent databases to check product direction and feature investment patterns. This list is illustrative and not exhaustive, and additional sources were used for collection, cross-checking, and clarification.
Primary Interviews and Surveys
Primary work focused on validating how platforms in the United States actually monetize, which price levers matter most, and how fast new features are being adopted across retail and institutional users. We spoke with a mix of product, compliance, operations, and commercial leaders, and the feedback was used to confirm key assumptions such as active account behavior, typical pricing logic for premium tools, and the pace of cloud migration and mobile usage.
Distribution of primary research fieldwork respondents
| Company type | Respondent position |
|---|---|
| Top tier: 27% | CXOs: 12% |
| Mid tier: 55% | Functional/Unit leaders: 36% |
| Smaller Players: 18% | Managers: 52% |
Market-Sizing & Forecasting
Sizing started with a top-down build that reconstructs the United States revenue pool for online trading platforms by mapping platform-linked income streams to the active investing base and transaction intensity, then adjusting for pricing and take-rate patterns observed in the market. Once the first cut was created, the totals were checked with selective bottom-up approximations, such as sampled platform revenue disclosures, channel checks on subscription tiers, and simple ASP times volume math for common service bundles, which were used to fine-tune outliers.
A few inputs mattered more than others when shaping the model, including retail participation and account opening momentum, trade frequency trends during high and low volatility periods, the share of activity occurring on mobile apps versus desktop, the mix shift toward advanced tools and premium analytics, and the impact of interest-rate conditions on cash management and margin related platform economics. Where disclosure gaps existed, missing values were handled through conservative peer benchmarking and then re-tested through primary feedback before being accepted.
Forecasts were produced using scenario analysis, since platform revenue can change quickly with sentiment, regulatory actions, and pricing changes. The scenarios were anchored to consensus views from interviewees on user growth, monetization per active account, and expected compliance and technology spending, and then translated into a single base case that stays consistent with observable demand signals.
Data Validation & Update Cycle
Outputs were validated through multiple checks to keep the final numbers consistent with real market signals. We compared the modeled totals against independent indicators such as investor participation trends, changes in trading activity, and visible pricing moves, then reviewed large variances at the segment level before final sign-off.
Anomalies triggered deeper review, including re-checking assumptions, revisiting source notes, and re-contacting selected respondents when a change could materially shift the estimate. Reports are refreshed annually, with interim updates when major events occur, and a final pre-delivery pass is completed to align the model with the most recent disclosures and regulatory developments.
Mordor Intelligence's United States Online Trading Platform Market Size Versus Other Published Estimates
Published market sizes for United States online trading platforms often do not match because different studies draw the line around what counts as platform revenue and how they treat adjacent brokerage and trading related income. Timing also matters, since fast changes in pricing, interest-rate driven cash economics, and feature launches can move the annual total even when user counts look stable.
In practice, the biggest gaps usually come from whether estimates include wider broker-dealer revenue, whether crypto and alternative asset functionality is counted as part of the same platform pool, and how subscription and premium tool pricing is annualized. Some figures also use aggressive participation assumptions without cross-checking them against trading activity patterns, and currency timing and refresh cadence can add another layer of drift when older baselines are carried forward.
Benchmark comparison
| Source | Market Size | Gaps in Research Methodology |
|---|---|---|
| Mordor Intelligence | USD 3.41 B (2025) | |
| Trade Journal A | USD 3.03 B (2023) | Uses an earlier base year and a shorter horizon, and it appears to treat platform monetization more narrowly by limiting revenue capture to core trading access and basic tools. |
| Industry Brief B | USD 4.35 B (2028) | Presents a faster path to growth by applying higher participation and monetization assumptions, and it likely blends broader brokerage-linked income with platform revenue in the same total. |
The spread across sources is mainly explained by year selection and how closely platform revenue is separated from broader brokerage income and adjacent services, and that separation is kept explicit in this model, including refresh checks tied to pricing and rate-sensitive income streams, before totals are finalized by Mordor Intelligence.
Key Questions Answered in the Report
What is the current size of the US online trading platform market?
The market stands at USD 3.61 billion in 2026 and is projected to reach USD 4.82 billion by 2031.
Which segment is growing fastest within the US online trading platform market?
Cloud deployment leads growth at a 9.27% CAGR as platforms migrate to scalable, compliance-ready infrastructure.
How are commission-free models funded?
Platforms rely on payment-for-order-flow rebates, net-interest income from cash balances, and premium subscription services to offset zero-commission execution.
Why is desktop usage rising after years of mobile dominance?
Serious traders favor larger displays and advanced analytics available on desktop platforms, which support multi-monitor setups and low-latency data feeds.
What regulatory changes will impact platforms most through 2031?
FINRA fee increases, SEC oversight of AI deployment, and T+1 post-trade settlement deadlines constitute the most significant cost and technology pressures.
How concentrated is the competitive landscape?
The top five firms control slightly above 70% of assets, indicating moderate concentration with room for specialized entrants that can navigate regulatory hurdles effectively.