
United States Oil And Gas Pipeline Maintenance, Repair, And Overhaul (MRO) Market Size and Share
Market Overview
| Study Period | 2021 - 2031 |
|---|---|
| Forecast Data Period | 2026 - 2031 |
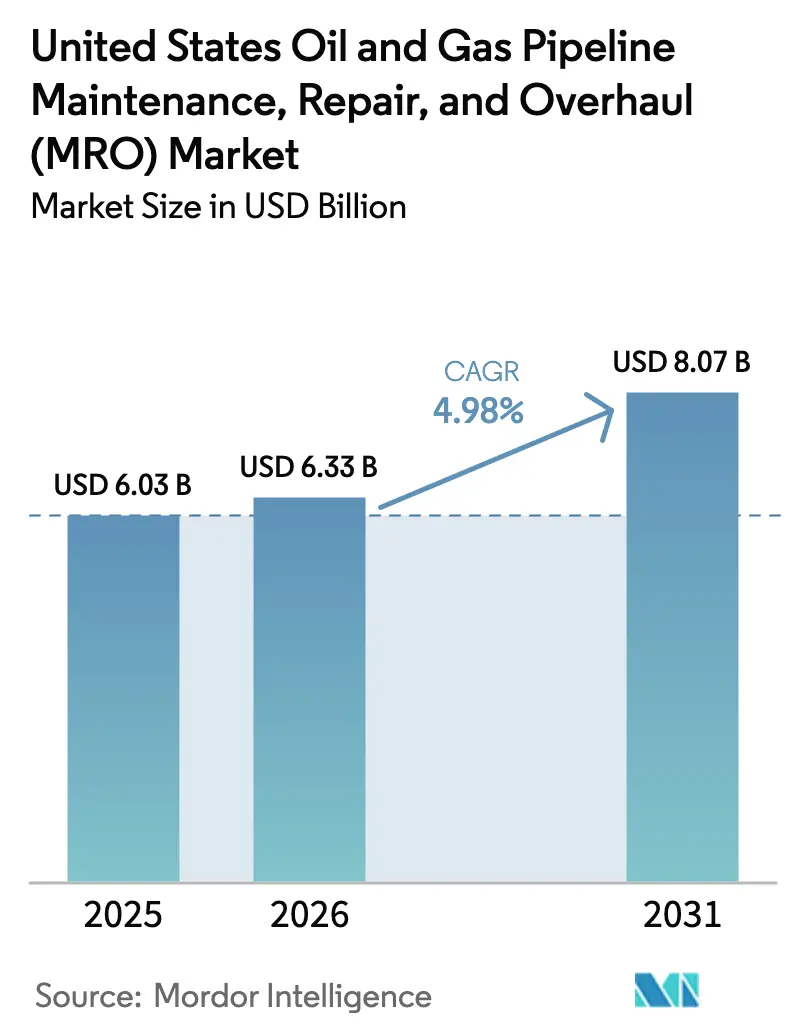
| Base Year Market Size (2025) | USD 6.03 Billion |
| Market Size (2026) | USD 6.33 Billion |
| Market Size (2031) | USD 8.07 Billion |
| Growth Rate (2026 - 2031) | 4.98 % |
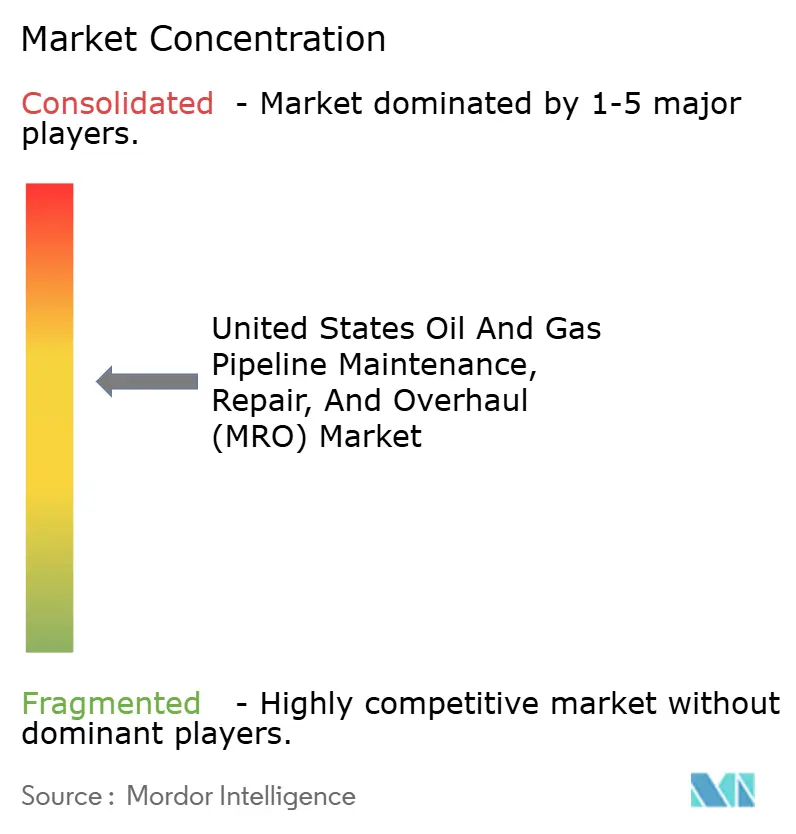
| Market Concentration | Medium |
Major Players *Disclaimer: Major Players sorted in no particular order Image © Mordor Intelligence. Reuse requires attribution under CC BY 4.0. | |
United States Oil And Gas Pipeline Maintenance, Repair, And Overhaul (MRO) Market Analysis by Mordor Intelligence
The United States Oil And Gas Pipeline Maintenance, Repair, And Overhaul Market size in 2026 is estimated at USD 6.33 billion, growing from 2025 value of USD 6.03 billion with 2031 projections showing USD 8.07 billion, growing at 4.98% CAGR over 2026-2031.
Robust growth stems from the convergence of aging transmission mileage, intensifying integrity mandates under the PHMSA “Mega Rule,” and the rapid digitalization of inspection workflows, collectively de-risking downtime and environmental incidents.[1] Operators are prioritizing condition-based maintenance enabled by smart-pigging data, while composite repair technologies reduce replacement costs and extend asset life. Federal grants worth USD 196 million, awarded in 2024, are accelerating safety-driven upgrades, particularly across rural gas distribution networks. Competitive intensity is rising as technology specialists leverage IoT sensors and predictive analytics that can trim unplanned outages by as much as 70% and reshape pricing models toward outcome-based contracts.[2]
Key Report Takeaways
- By service type, maintenance led with a 35.72% revenue share in 2025, and is projected to expand at a 5.62% CAGR through 2031.
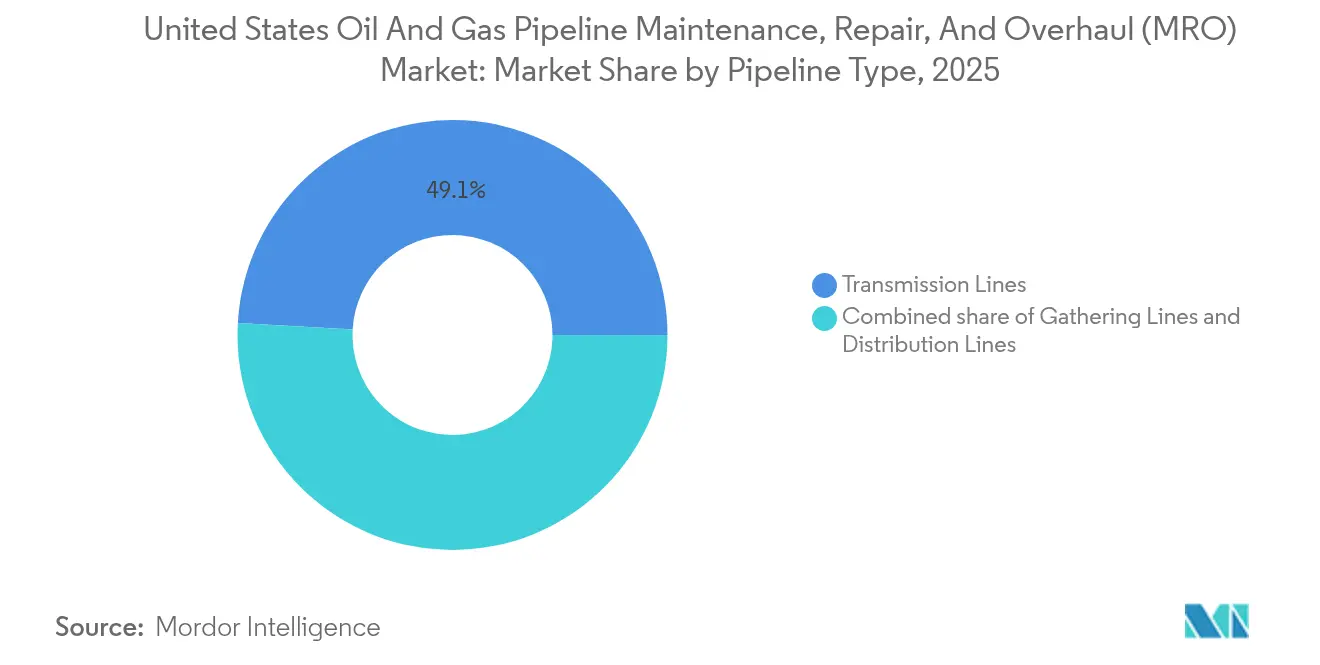
- By pipeline type, transmission lines held 49.12% of the US oil and gas pipeline MRO market share in 2025 and are expected to represent the fastest-growing pipeline class at a 5.18% CAGR through 2031.
- By location of deployment, onshore assets commanded 76.65% of value in 2025; offshore operations, however, deliver the highest growth at a 6.05% CAGR through the forecast window.
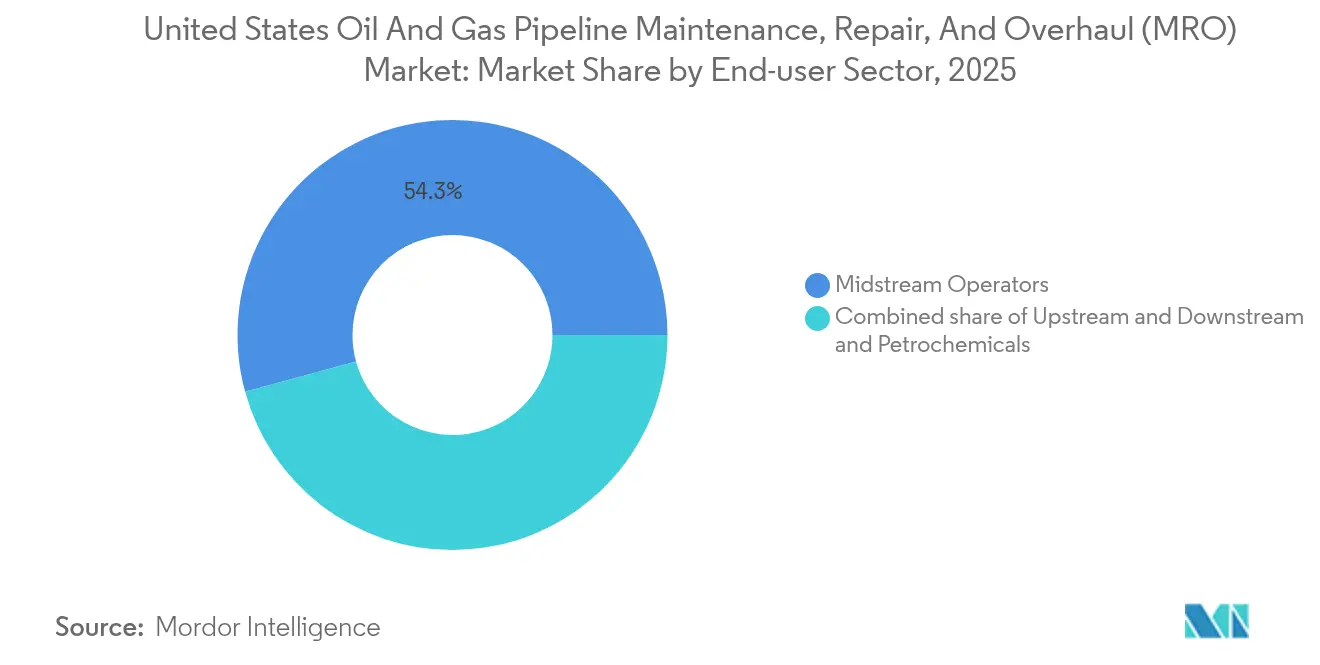
- By end-user sector, midstream operators accounted for 54.25% of revenues in 2025 and continue to register a resilient 5.12% CAGR, given their fee-based business models, which are insulated from crude price swings.
- By geography, the Gulf Coast contributed roughly 34.62% of 2025 spending, underpinned by the nation’s densest pipeline grid and steady petrochemical capacity additions.
Note: Market size and forecast figures in this report are generated using Mordor Intelligence’s proprietary estimation framework, updated with the latest available data and insights as of 2026.
Market Trends and Insights
Drivers Impact Analysis of United States Oil And Gas Pipeline Maintenance, Repair, And Overhaul (MRO) Market*
| Driver | (~) % Impact on CAGR Forecast | Geographic Relevance | Impact Timeline |
|---|---|---|---|
| Aging pipeline infrastructure & integrity mandates | 1.20% | Gulf Coast, Midwest | Long term (≥ 4 years) |
| Shale output growth raising throughput stress | 0.90% | Permian, Appalachian, Bakken | Medium term (2-4 years) |
| Adoption of smart pigging & IoT sensors | 0.80% | National | Medium term (2-4 years) |
| Federal funding for infrastructure modernization | 0.70% | National | Short term (≤ 2 years) |
| Emergence of composite repair technologies | 0.60% | National | Long term (≥ 4 years) |
| Regulatory compliance requirements | 0.80% | National | Short term (≤ 2 years) |
| Source: Mordor Intelligence | |||
Aging Pipeline Infrastructure & Integrity Mandates
Roughly 67% of US natural-gas transmission mileage predates 1970 standards, necessitating sustained inspection, recoating, and valve replacement schedules.[3] Operators now earmark 15-20% of annual capex for compliance-driven MRO, an allocation that underpins the long-run visibility of the US oil and gas pipeline MRO market. The 2025 Mega Rule deadline intensifies demand for Engineering Critical Assessments, a process that service providers monetize via multi-year master service agreements. Long-cycle integrity programs insulate maintenance budgets from commodity price fluctuations, supporting predictable order backlogs even during periods of reduced upstream spending. As regulatory scrutiny intensifies, suppliers offering bundled inspection-plus-repair packages gain market share by streamlining workflow handoffs and reducing permitting timelines.
Shale Output Growth Raising Throughput Stress
Permian Basin oil output at 5.7 million bpd in 2024 strains trunk lines originally engineered for lower volumes, elevating vibration loads and corrosion rates.[4] Parallel gas surges from Appalachia push multi-decade steel to its fatigue limits, spurring compressor station retrofits and pipe reinforcement campaigns. Because greenfield projects face permitting headwinds, midstream firms are maximizing existing corridors, thereby expanding the opportunity pool for flow-optimization and integrity services within the US oil and gas pipeline MRO market. Accelerated wear profiles result in higher call-out frequencies for weld overlays, sleeve installations, and cathodic protection tune-ups. Vendors versed in predictive analytics win contracts by demonstrating their ability to extend the intervals between digs while maintaining throughput.
Adoption of Smart Pigging & IoT Sensors
High-resolution magnetic-flux-leakage pigs now pinpoint sub-millimeter defects, and when paired with IoT pressure sensors, feed digital twins that forecast failure probability with machine-learning precision. Operators deploying these systems report up to a 70% reduction in unscheduled shutdowns, validating the ROI of condition-based maintenance. The pivot from calendar to risk-ranked maintenance reshapes service mix toward data analytics, firmware updates, and cloud infrastructure support, expanding revenue channels beyond traditional field labor. Early adopters in interstate transmission corridors set best-practice benchmarks that distribution utilities and gathering networks increasingly emulate, widening overall addressable spending in the US oil and gas pipeline MRO market.
Federal Funding for Infrastructure Modernization
PHMSA’s Natural Gas Distribution Infrastructure Safety and Modernization grants released USD 196 million in 2024, the first tranche of nearly USD 1 billion earmarked through 2028. Funds target leak-prone cast-iron and bare-steel segments in disadvantaged communities, accelerating work scopes for distribution contractors. The Infrastructure Investment and Jobs Act further channels money toward methane emissions reduction, boosting demand for advanced leak-detection equipment and low-bleed pneumatic replacements within the US oil and gas pipeline MRO market. Public dollars not only de-risk project finance but also impose performance metrics that favor technology-rich bidders capable of transparent reporting.
Restraints Impact Analysis of United States Oil And Gas Pipeline Maintenance, Repair, And Overhaul (MRO) Market*
| Restraint | (~) % Impact on CAGR Forecast | Geographic Relevance | Impact Timeline |
|---|---|---|---|
| Crude-price volatility curbing O&M budgets | -0.80% | Permian, Bakken | Short term (≤ 2 years) |
| Environmental opposition to work permits | -0.60% | Northeast, West Coast | Medium term (2-4 years) |
| Skilled labor shortage for specialty MRO | -0.70% | Rural corridors | Long term (≥ 4 years) |
| Cyber-risk in pipeline SCADA systems | -0.40% | National | Medium term (2-4 years) |
| Source: Mordor Intelligence | |||
Crude-Price Volatility Curbing O&M Budgets
WTI prices swung between USD 70 and USD 85 per barrel in 2024, prompting exploration firms to defer non-critical work and renegotiate service scopes. Although fee-based midstream revenue softens the blow, upstream austerity can ripple into gathering-line maintenance call-outs, dampening near-term order books across the US oil and gas pipeline MRO market. Suppliers counter volatility by diversifying into long-cycle compliance projects and offering subscription-style inspection services that flatten revenue variability.
Environmental Opposition to Work Permits
Legal interventions under NEPA and state-level reviews can stretch routine maintenance permits by 12-18 months, complicating crew scheduling and fragmenting mobilization efficiencies. In regions like the Northeast, public hearings and litigation risk add cost premiums, as contractors factor standby time into their bids. The uncertainty deters smaller firms and reinforces the role of large providers with in-house environmental-compliance teams.
*Our forecasts treat driver/restraint impacts as directional, not additive. The impact forecasts reflect baseline growth, mix effects, and variable interactions.
United States Oil And Gas Pipeline Maintenance, Repair, And Overhaul (MRO) Market Segment Analysis
By Service Type:
Maintenance Dominance Reflects Proactive Asset ManagementMaintenance captured 35.72% of the US oil and gas pipeline MRO market in 2025 and is projected to grow at a 5.62% CAGR, highlighting the industry’s shift from reactive repairs to predictive maintenance tied to integrity analytics. The segment benefits from grant-funded safety programs and PHMSA inspection cycles, ensuring recurring demand even during commodity downturns. Inspection and monitoring form the backbone of this proactive stance, driving cross-sales into chemical cleaning, valve lubrication, and cathodic protection tuning. Vendors that combine smart-pig analytics with field execution cut client downtime and are rewarded with multi-year blanket purchase agreements. Repair and rehabilitation remain a substantial tail, especially for legacy steel that fails hydro tests; nonetheless, composite wraps are steadily cannibalizing cut-and-replace work. Decommissioning, although still niche, is gaining visibility as operators retire redundant assets in line with methane-reduction pledges, thereby fostering a long-term layer of project work within the US oil and gas pipeline MRO market.
Second-order effects come from digital twins that sequence maintenance tasks into outage-centered clusters, squeezing greater output from limited crew capacity. Overhaul activities tend to focus on critical compressor stations, where centrifugal blades and gearboxes require OEM-grade rebuilds every five to seven years. As uptime metrics increasingly influence pipeline tariffs, service contractors with KPI-linked payment clauses capture premium margins. The rising use of autonomous inline inspection tools also shifts revenue toward data interpretation and software support retainers, further blurring lines between pure maintenance and tech services in the US oil and gas pipeline MRO industry.
By Pipeline Type:
Transmission Networks Drive Infrastructure InvestmentTransmission lines accounted for 49.12% of expenditure in 2025 and are expected to advance at a 5.18% CAGR, reflecting heavy-diameter, high-pressure assets where failure risk and regulatory scrutiny are highest. These arteries, often spanning state borders, are early adopters of machine-learning corrosion prediction and deploy multi-sensor pigs capable of measuring axial strain, reinforcing their centrality to the US oil and gas pipeline MRO market. Gathering networks, conversely, face rapid lateral expansion in shale plays; while individual diameters are smaller, the aggregate mileage fuels a sizeable maintenance sub-segment. Distribution pipelines focus on urban leak mitigation; grant flows accelerate plastic-pipe replacement, thereby boosting localized MRO spending. The emergence of hydrogen blending pilots inside gas distribution grids could expand material compatibility testing, adding an incremental revenue stream.
As interstate capacity utilization exceeds 90% on certain corridors, operators push deferred maintenance into accelerated schedules. Transmission owners prefer turnkey contractors who can mobilize composite wraps, hot taps, and hydrostatic testing fleets under a single umbrella. By contrast, gathering customers prize low-cost mobilization and quick-hit repairs. This segmentation splits competitive dynamics, yet the high-value transmission slice ultimately steers technology roadmaps and standard-setting within the US oil and gas pipeline MRO market.

By Location of Deployment:
Offshore Growth Outpaces Onshore MaturityOnshore corridors still account for 76.65% of 2025 revenue, sustained by 2.6 million miles of existing pipeline. Even so, offshore assets log the strongest 6.05% CAGR thanks to the Gulf of Mexico’s deepwater tie-backs and increasing subsea compression pilots. Subsea MRO demands ROV-deployed ultrasound and hyperbaric welding capabilities, as well as specialized composite sleeves rated for hydrostatic pressure, all of which carry service premiums two to four times those of onshore equivalents. Remote work scopes linked by digital twins and satellite communications help mitigate weather-related downtime, boosting crew productivity and data capture in harsh environments.
Onshore projects increasingly deploy drones and crawler robots for right-of-way surveillance, freeing scarce technicians for higher-value tasks. Meanwhile, ESG reporting is pushing green-field maintenance yards to electrify their fleets, initiating another capital expenditure stream for tool providers. Although offshore’s absolute spend is smaller, its technology intensity makes it disproportionately influential in shaping innovation paths across the broader US oil and gas pipeline MRO market.
By End-User Sector:
Midstream Leadership Reflects Infrastructure CriticalityMidstream entities represented 54.25% of 2025 spending and continue to outpace other sectors with a 5.12% CAGR. Their fee-based revenue insulates budgets, enabling consistent multi-year asset-integrity programs. Transmission-focused midstream operators also have larger right-of-way footprints, which translates into economies of scale for bundled inspection, maintenance, and repair frameworks. Upstream companies fluctuate with drilling cycles, but unconventional output volumes compel them to sustain gathering-line maintenance despite price dips, thereby anchoring a baseline revenue stream. Downstream and petrochemical players maintain steady, albeit slower, growth due to established turnaround calendars synchronized with plant outages.
Integrated majors blur sectoral lines by operating upstream wells, trunk lines, and export terminals, creating demand for end-to-end service contracts that span the full lifecycle. Suppliers familiar with multiple PHMSA sub-parts (B, O, W) gain a competitive edge by offering regulatory expertise across asset classes, thereby bolstering retention in the US oil and gas pipeline MRO market.
Geography Analysis
The Gulf Coast accounted for nearly 34.62% of 2025 expenditures and is expected to maintain robust growth as petrochemical expansions and LNG export terminals reinforce infrastructure complexity. Over 58,000 miles of interstate pipe in Texas alone require discernible maintenance cadences to satisfy both PHMSA and Railroad Commission oversight. High humidity accelerates external corrosion, pushing demand for advanced coatings and real-time cathodic monitoring. Frequent hurricane exposure prompts operators to stage rapid-response repair teams, a logistical niche that contractors with storm-hardening playbooks effectively capture. Digital surveillance via aerial LiDAR and near-real-time SCADA updates enhances anomaly triage, embedding software subscriptions into every new maintenance award in the region.
Midwest states collectively command roughly 25.18% of the US oil and gas pipeline MRO market. Illinois hubs funnel Canadian crude southward, while Ohio’s core role in NGL supply to chemical clusters drives sustained compressor overhauls and metering-station upgrades. Winter freeze cycles induce thermal stress, justifying the installation of seasonal sleeves and pipe supports rated for sub-zero brittleness thresholds. Regulatory coordination between PHMSA and state public utility commissions influences inspection windows, favoring regional service providers who are fluent in both federal and state codes. Planned renewable-diesel conversions at certain refineries could amplify pipeline cleaning jobs to ensure contamination-free flow paths.
The Northeast accounts for nearly 19.74% of MRO outlays, but growth lags due to contentious permitting climates. Dense population corridors impose stringent class-location standards, increasing record-keeping rigor and dig verification frequencies. Appalachian shale gas continues to drive expansions, yet environmental litigation extends project horizons and raises insurance costs. Operators proactively integrate leak-detection fiber optics to appease regulators, which in turn opens up specialist service niches in fiber splicing and sensor calibration. The region’s hilly terrain complicates the sourcing of water for hydrostatic tests, promoting the adoption of inert-gas pressure testing as an alternative method.
Rocky Mountain and West Coast corridors split the remaining share. Colorado’s regulatory restructuring has increased baseline inspection cycles, while California’s carbon-reduction targets accelerate the decommissioning and repurposing of legacy lines toward hydrogen blends. Seismic resilience retrofits on the West Coast generate bespoke MRO scopes, including slip-lining and flexible joint installation. Mountainous topography drives the delivery of helicopter-borne equipment, a sub-service that commands premium rates while ensuring compliance in remote zones.
Regulatory Landscape
Pipeline MRO activity in the United States is shaped largely by the Pipeline and Hazardous Materials Safety Administration (PHMSA) under the U.S. Department of Transportation, with state pipeline safety agencies acting as enforcement partners for intrastate assets. A key compliance anchor for integrity management is PHMSA's continued incorporation of voluntary consensus standards by reference, including ASME B31.8S for gas transmission integrity and ASME B31.4 for liquid pipelines. This approach influences inspection intervals, defect assessment methods, and repair qualification requirements across transmission, gathering, and distribution systems.
In August 2025, PHMSA issued a final rule updating its pipeline safety regulations by incorporating nine revised industry standards, including updates to ASME B31.4 and ASME B31.8S. The change tightens the technical baseline used for maintenance planning, inline inspection interpretation, and repair procedures. Industry bodies such as the American Petroleum Institute (API) and the Interstate Natural Gas Association of America (INGAA) continue to participate in standards and rulemaking, and that involvement shapes how new revisions filter into operator work programs and service-provider qualification requirements.
Competitive Landscape
The US oil and gas pipeline MRO market is moderately fragmented, with the five largest contractors capturing an estimated 28-30% combined share. Baker Hughes leverages its Panametrics sensor suite and Cordant software to lock in multi-year integrity management deals that bundle diagnostics with responsive repair crews. Oceaneering International, rooted in offshore robotics, now cross-sells ROV-deployed smart-pig retrieval and composite sleeve placement services, giving it an edge in deepwater assignments. MISTRAS Group differentiates itself with embedded acoustic-emission monitoring systems installed during overhauls, which shift revenue toward recurring data analytics subscriptions.
Consolidation momentum continues: ONEOK’s 2024 acquisition of EnLink Midstream enlarged a combined pipeline footprint exceeding 30,000 miles, which is now subject to network-wide maintenance harmonization—opportunities that integrated service houses are already pursuing. Technology entrants specializing in artificial-intelligence defect-classification algorithms form joint ventures with established mechanical contractors to penetrate operator preference lists. Barriers to entry remain high in composite repair, where ASME PCC-2 certification requires stringent performance proofs and audited quality manuals, effectively limiting competition to a dozen nationwide licensees.
Cybersecurity consultants are the newest competitive cohort, winning a share of OPEX that previously flowed exclusively to mechanical work. Firms offering turnkey compliance with TSA Security Directive Pipeline-2021-02 now bundle network hardening, anomaly detection, and incident-response playbooks into MRO contracts, creating cross-sell prospects for traditional service incumbents that partner rather than build capabilities in-house. Overall, price competition is intensifying in routine activities such as coating recoats and valve lube runs, whereas differentiated offerings in data analytics, deepwater robotics, and composite wraps maintain margin resilience.
United States Oil And Gas Pipeline Maintenance, Repair, And Overhaul (MRO) Industry Leaders
-
Oceaneering International, Inc.
-
Baker Hughes Company
-
Kinder Morgan Inc.
-
Aegion Corporation
-
T.D. Williamson Inc.
- *Disclaimer: Major Players sorted in no particular order
United States Oil And Gas Pipeline Maintenance, Repair, And Overhaul (MRO) Market Companies Covered in this Report
- Baker Hughes Company
- Kinder Morgan Inc.
- Oceaneering International Inc.
- Sulzer Ltd
- National Energy Services Reunited Corp.
- Linde plc
- EnerMech Ltd
- Oil States Industries Inc.
- Aegion Corporation
- T.D. Williamson Inc.
- ROSEN USA
- Team Inc.
- Shawcor Ltd (PPG)
- CRC-Evans Pipeline International
- STATS Group
- Pipergy Inc.
- Advanced FRP Systems
- Messer North America Inc.
- DNOW L.P.
- MISTRAS Group
- Denso North America Inc.
- SealforLife Industries
Market Opportunities and Future Outlook
Compliance-driven integrity programs and standards updates are widening the scope for bundled inspection, engineering assessment, and repair execution, particularly where operators need traceable, auditable workflows aligned with PHMSA's standards-by-reference framework. Service providers with ASME-qualified composite repair capabilities, access to high-resolution inline inspection tools, and the ability to connect digital outputs through dig execution and documentation are positioned to capture work that previously moved across multiple vendors. This dynamic is most evident for transmission corridors where inspection findings feed multi-year remediation backlogs.
Operator capital programs and network additions are also creating near-term whitespace for lifecycle MRO packages tied to new and optimized assets. Kinder Morgan's 2026 discretionary capital plan (USD 3.4 billion) emphasizes natural gas pipeline optimization and capacity expansion, which typically follows with commissioning support, baseline integrity assessments, and reliability-centered maintenance needs. The announced acquisition of the Monument Pipeline system (about 225 miles added to Kinder Morgan's Texas intrastate network) increases the population of assets requiring harmonized integrity plans, documentation alignment, and maintenance standardization, supporting demand for inspection, corrosion control, and anomaly remediation services across the Gulf Coast and Texas-heavy corridors.
Recent Industry Developments in United States Oil And Gas Pipeline Maintenance, Repair, And Overhaul (MRO) Market
- May 2026: Kinder Morgan initiated pipeline remediation for an anomaly on the GC #1 mainline south of Compressor Station 341 in South Texas, requiring temporary shutdown of receipt and delivery points. The operation shows continued MRO activity focused on midstream assets and supports long-term maintenance and anomaly remediation priorities in service contracts.
- March 2026: Baker Hughes Company signed a 60-month service agreement with Petrobras to provide maintenance, repairs, and engineering advisory services for up to 64 aeroderivative gas turbines. This extends long-duration turbomachinery integrity support for offshore assets.
- January 2026: Oceaneering International Inc. secured a four-year extension to its inspection support contract for Equinor assets in Norway, covering onshore installations and offshore assets. The extension adds durability to inspection-led MRO work with a major operator.
United States Oil And Gas Pipeline Maintenance, Repair, And Overhaul (MRO) Market Report Scope and Research Methodology
Market Definition and Coverage
This market covers paid services used to keep US oil and gas pipelines safe and operable, including routine maintenance, corrective repair work, integrity checks, and planned overhaul activities across onshore and offshore networks.
Scope exclusions: It excludes new pipeline construction and major expansion capex that is not booked as maintenance, repair, or overhaul service spend.
Segments Covered in This Report
- By Service Type
- Inspection and Monitoring
- Maintenance
- Repair and Rehabilitation
- Overhaul and Replacement
- Decommissioning
- By Pipeline Type
- Gathering Lines
- Transmission Lines
- Distribution Lines
- By Location of Deployment
- Onshore
- Offshore
- By End-user Sector
- Upstream (E&P)
- Midstream Operators
- Downstream & Petrochemicals
Data Sources, Market Sizing, and Validation
Desk Research
Desk work starts with building the installed base and operating context for US pipelines, then mapping what typically drives MRO spending over time. We rely on public data series and rulemaking documents to anchor the model, and we use company disclosures to understand service mix, margins, and demand timing.
Common reference points include PHMSA incident and safety statistics, the US Energy Information Administration for crude oil and natural gas throughput context, the Federal Energy Regulatory Commission for regulated pipeline filings, the Bureau of Labor Statistics for labor and wage inflation, and US International Trade Commission data for indicative import trends of relevant equipment categories. We review operator and contractor annual reports, investor presentations, association publications, and reputable press, and we selectively use paid subscriptions for company financials and intelligence, patent databases, and shipment level import or export checks when it helps validate assumptions. The sources listed here are not exhaustive, and many other public references were used for data collection, cross-checking, and clarification.
Primary Interviews and Surveys
Primary work is used to confirm what portion of spend is truly MRO, how budgets are split between planned integrity programs versus reactive work, and how pricing and labor availability are changing contract values. We covered a mix of pipeline operators, service contractors, inspection and integrity specialists, and procurement and maintenance teams, and then we rechecked assumptions with follow-up calls when desk indicators and interview inputs did not align.
Distribution of primary research fieldwork respondents
| Company type | Respondent position |
|---|---|
| Top tier: 37% | CXOs: 12% |
| Mid tier: 48% | Functional/Unit leaders: 31% |
| Smaller Players: 15% | Managers: 57% |
Market-Sizing & Forecasting
Sizing begins with a top-down rebuild of the addressable MRO demand pool by linking US pipeline miles and operating intensity to typical inspection, repair, and overhaul cycles, then adjusting for onshore versus offshore exposure. Results are corroborated with selective bottom-up approximations, where sampled contract values, service pricing bands, and activity volumes are rolled up to test whether the total looks reasonable.
Key inputs used in the model include regulated integrity management requirements and enforcement signals, incident and leak trends, pigging and inline inspection cadence, corrosion control and coating rehabilitation cycles, right-of-way maintenance intensity, and labor and materials inflation that affects service pricing. Where bottom-up data is thin, gaps are handled through conservative service frequency ranges validated in interviews, and then constrained so implied spend per mile stays within realistic bounds.
Forecasts are built using scenario analysis, because maintenance budgets tend to respond to a mix of safety compliance pressure, outage planning, and commodity-price driven operating activity. We set a base case and then stress test it with tighter or looser assumptions on inspection frequency, contractor utilization, and pricing escalation, before locking the final trajectory.
Data Validation & Update Cycle
Validation is done in several passes so one weak data point does not steer the full model. We compare outputs against independent signals such as incident rates, published capex and opex commentary, service utilization cues, and inflation indexes, then we review any large year-over-year jumps to confirm they are explainable.
Before sign-off, assumptions and calculations are checked by another analyst, and unusual variances trigger re-contact with sources and a rebuild of the specific driver that moved. Reports are refreshed annually, with interim updates when material events occur, and a final pre-delivery review is completed so clients receive the latest updated view.
Mordor Intelligence's United States Oil and Gas Pipeline Maintenance Repair Overhaul Market Size Measured Against Other Published Estimates
Published market sizes can differ even when the same market name is used, because the service boundary is often drawn differently and the line between maintenance spend and construction capex is not treated the same way. Differences also come from how firms handle inflation, how they treat offshore work, and whether they count integrity management activities as a core part of MRO or as a separate bucket.
By tracking integrity-management driven activity levels and refreshing the spend-per-mile and price escalation inputs each cycle, Mordor Intelligence keeps the model focused on service revenue tied to operating pipelines, rather than blending in large project work or broad process services that can inflate totals.
Benchmark comparison
| Source | Market Size | Gaps in Research Methodology |
|---|---|---|
| Mordor Intelligence | USD 6.03 B (2025) | |
| Global Consultancy A | USD 12.80 B (2026) | Often expands scope beyond pipeline MRO into wider midstream or process services, and may apply higher spend-per-mile assumptions without separating one-time remediation campaigns from recurring maintenance. |
| Industry Portal B | USD 1.51 B (2025) | Usually reflects a narrower service basket (for example, pipeline and process services only) and can undercount integrity programs, inspection, and overhaul work that sits outside the limited service definition. |
The spread in estimates is mainly explained by how wide the service boundary is drawn and whether large adjacent service categories are pulled into the total. Our approach stays traceable to pipeline operating activity, compliance-driven inspection cycles, and observable price and labor trends, which makes the final number easier to reconcile and repeat over time.
Key Questions Answered in the Report
How large is U.S. spending on pipeline maintenance today?
The US oil and gas pipeline MRO market size stood at USD 6.33 billion in 2026 and is projected to reach USD 8.07 billion by 2031.
Which service area grows fastest through 2031?
Maintenance services lead, expanding at a 5.62% CAGR as operators favor proactive, analytics-driven upkeep.
Why are transmission pipelines the biggest spending category?
They operate under high pressure across long distances, require sophisticated inspection tools, and face strict PHMSA oversight, resulting in 49.12% of 2025 outlays.
What role do federal grants play in future activity?
Programs such as PHMSA’s USD 196 million safety grants accelerate leak-prone pipe replacement and drive short-term MRO spend in distribution networks.
How does labor availability influence project timelines?
A looming retirement wave for certified technicians elevates wage costs and can delay specialty work, adding pressure to adopt automation and remote monitoring.