
Market Overview
| Study Period | 2021 - 2031 |
|---|---|
| Forecast Data Period | 2026 - 2031 |
| Base Year Market Size (2025) | USD 21.76 Billion |
| Market Size (2026) | USD 22.62 Billion |
| Market Size (2031) | USD 27.46 Billion |
| Growth Rate (2026 - 2031) | 3.95 % |
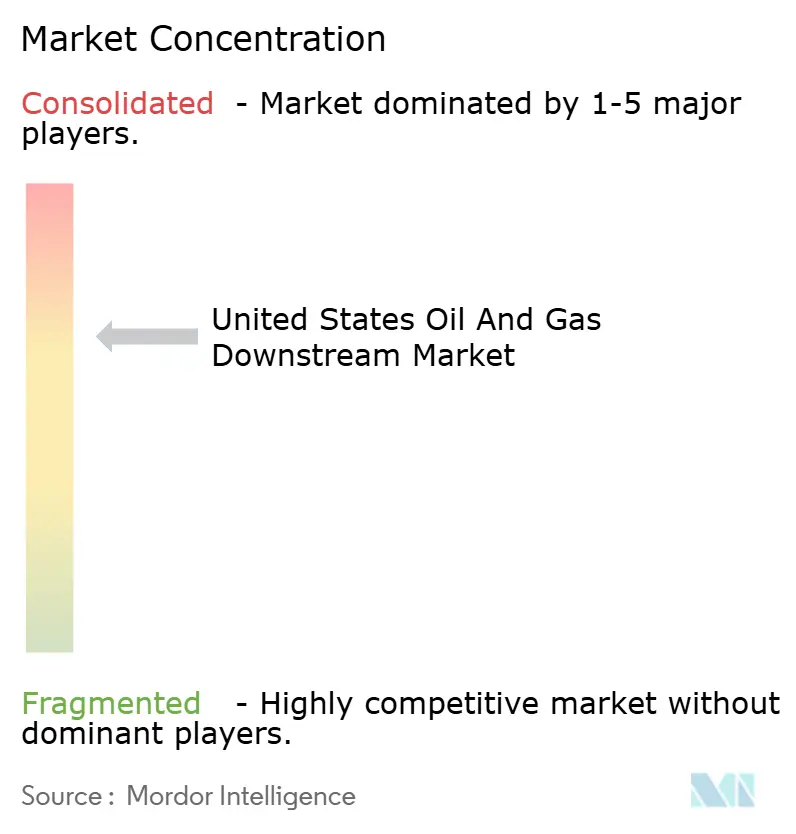
| Market Concentration | Medium |
Major Players *Disclaimer: Major Players sorted in no particular order Image © Mordor Intelligence. Reuse requires attribution under CC BY 4.0. | |
United States Oil And Gas Downstream Market Analysis by Mordor Intelligence
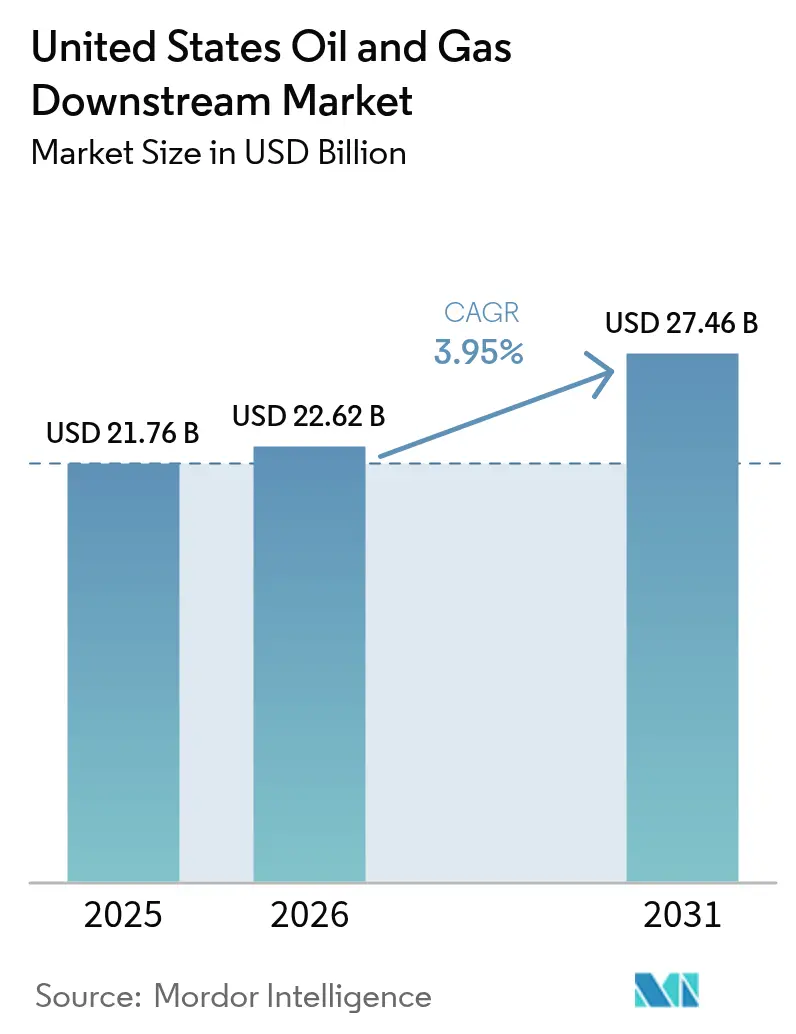
The United States Oil And Gas Downstream Market size in 2026 is estimated at USD 22.62 billion, growing from 2025 value of USD 21.76 billion with 2031 projections showing USD 27.46 billion, growing at 3.95% CAGR over 2026-2031.
Refinery modernization outlays exceeding USD 15 billion annually, a steady 2.1% rise in national vehicle-miles traveled (VMT) during 2023, and new petrochemical capacity anchored to advantaged ethane feedstock keep the United States' oil and gas downstream market on a growth footing despite intensifying energy-transition pressures. Operators are blending traditional fuels with renewable diesel and sustainable aviation fuel, installing digital twin platforms that raise utilization by up to 15%, and leveraging USD 85-per-ton carbon-capture tax credits to defend margins. Strategic investments in Gulf Coast complexes continue to draw capital toward integrated refining and petrochemical hubs, while West Coast facilities shift toward low-carbon products to offset stricter environmental mandates.
Key Report Takeaways
- By type, refineries led with a 56.75% revenue share of the United States' oil and gas downstream market size in 2025; petrochemical plants are projected to post the fastest growth at a 4.12% CAGR through 2031.
- By product category, refined petroleum products held 54.05% of the United States oil and gas downstream market share in 2025, whereas petrochemicals are poised to grow at a 4.25% CAGR to 2031.
- By distribution channel, direct and wholesale sales controlled 51.05% of revenue in 2025, while retail outlets integrating EV charging are forecast to register the steepest 4.45% CAGR through 2031.
- By geography, Gulf Coast facilities represented nearly 49.60% of national capacity in 2025, and the region is expected to outpace other PADDs with a 4.05% CAGR to 2031.
Note: Market size and forecast figures in this report are generated using Mordor Intelligence’s proprietary estimation framework, updated with the latest available data and insights as of 2026.
United States Oil And Gas Downstream Market Trends and Insights
Drivers Impact Analysis*
| Driver | (~) % Impact on CAGR Forecast | Geographic Relevance | Impact Timeline |
|---|---|---|---|
| Rising gasoline demand from sustained VMT growth | +0.80% | National; highest expansion in Sun Belt states | Medium term (2-4 years) |
| Planned refinery modernization & capacity additions | +1.20% | Gulf Coast PADD 3 and select Midwest assets | Long term (≥ 4 years) |
| Surging petrochemical feedstock demand | +0.90% | Gulf Coast and emerging Appalachian sites | Medium term (2-4 years) |
| Expansion of renewable diesel & SAF projects | +0.70% | Early adopters on West Coast and Gulf Coast | Long term (≥ 4 years) |
| Carbon-capture tax-credit-driven projects | +0.30% | Industrial corridors in Texas and Louisiana | Long term (≥ 4 years) |
| AI-based refinery optimization & margin gains | +0.50% | Nationwide, quickest uptake in integrated complexes | Short term (≤ 2 years) |
| Source: Mordor Intelligence | |||
Rising Gasoline Demand from Sustained VMT Growth
U.S. VMT reached 3.26 trillion miles in 2023, a 2.1% year-over-year increase, and this momentum anchors the baseline transportation fuel demand even as EV penetration accelerates. E-commerce fulfillment and last-mile logistics are lifting diesel and gasoline consumption at a pace that counterbalances slower passenger-car volumes. Sun Belt states lead with annual VMT increases above 3%, propelled by population inflows and construction activity. The U.S. Department of Transportation projects that commercial-vehicle mileage will grow at double the pace of passenger travel through 2027, providing refiners with a reliable user base for gasoline, diesel, and jet fuel production.(1) The predictable demand profile aids capacity-planning decisions and undergirds the 4.00% CAGR outlook for the United States oil and gas downstream market.
Planned Refinery Modernization & Capacity Additions
More than USD 15 billion in announced projects are revamping U.S. plants, with the Gulf Coast absorbing the largest share. ExxonMobil’s USD 2 billion Beaumont expansion adds 250,000 barrels per day (b/d) of throughput, while Chevron’s USD 475 million Pasadena revamp lifts capacity by 15% and equips the site to process heavier crudes.(2) Marathon Petroleum’s USD 2.5 billion renewable-diesel build-out exemplifies the dual path of investing in both legacy and low-carbon fuel lines. New hydrocrackers and fluid catalytic crackers raise middle-distillate yields, improve energy efficiency by up to 8%, and future-proof plants for shifting crude slates. The modernization cycle expands the installed base that feeds the United States oil and gas downstream market while nudging average operating costs downward.
Surging Petrochemical Feedstock Demand
Ethane demand increased by 9% in 2022, driven by both domestic and export-driven ethylene production. Refiners are integrating petrochemical units into existing operations to capitalize on this trend; ExxonMobil’s USD 2 billion Baytown upgrade and Chevron Phillips Chemical’s ethylene additions capture scale synergies and enhance cash margins.(3) Integrated complexes benefit from shared utilities and lower transport costs, allowing them to shift between fuels and chemicals as market signals dictate. Petrochemical-grade propylene has commanded premiums of 15-25% over refinery-grade supply, an incentive that accelerates investment in propylene recovery systems. These dynamics channel capital toward integrated energy and chemicals models that stabilize earnings across demand cycles.
Expansion of Renewable Diesel & SAF Projects
Diamond Green Diesel earmarked USD 315 million to retrofit Port Arthur for sustainable aviation fuel (SAF), and USA BioEnergy intends to spend USD 2.8 billion on a Texas SAF complex.(4) Shell redirected USD 1.5 billion to convert its Convent site into a 340,000 b/d renewable-diesel hub, signaling a decisive strategic shift. The Renewable Fuel Standard and California’s Low Carbon Fuel Standard underpin margins through RIN credits and carbon-credit premiums. Phillips 66’s Rodeo conversion retires 120,000 b/d of gasoline capacity but installs an equivalent volume of renewable diesel, illustrating portfolio rebalancing toward low-carbon output. Such projects expand the product palette available to the United States oil and gas downstream market and open high-value export lanes to regions with SAF mandates.
Restraints Impact Analysis*
| Restraint | (~) % Impact on CAGR Forecast | Geographic Relevance | Impact Timeline |
|---|---|---|---|
| Accelerating EV adoption curbing gasoline demand | -0.60% | West Coast early adoption, national expansion | Medium term (2-4 years) |
| Federal & state decarbonization compliance costs | -0.40% | California, Northeast states with strict standards | Long term (≥ 4 years) |
| Water-stress-driven effluent restrictions at refineries | -0.30% | Texas, California drought-prone regions | Medium term (2-4 years) |
| Skilled labor shortages for turn-arounds & projects | -0.20% | Gulf Coast, Midwest refining centers | Short term (≤ 2 years) |
| Source: Mordor Intelligence | |||
Accelerating EV Adoption Curbing Gasoline Demand
Electric-vehicle (EV) sales crossed 1.4 million units in 2023, taking 9.1% of total U.S. light-duty registrations. California leads with a 25% share, while Washington and Oregon account for over 15%, creating localized dips in gasoline demand. The USD 7.5 billion national charging-network rollout under the Infrastructure Investment and Jobs Act compresses adoption timelines, and purchase credits valid through 2032 keep consumer interest high. Fleet operators in dense urban corridors are electrifying vans and step-trucks to capture lifecycle savings, reducing diesel demand on specific routes.
Federal & State Decarbonization Compliance Costs
California’s Cap-and-Trade system and the Northeast’s Regional Greenhouse Gas Initiative impose carbon costs of USD 20-30 per metric ton, adding 3-5 cents per gallon to refinery operating expenses. EPA effluent-rule revisions will require USD 200 million upgrades at large facilities, while water-stress restrictions in Texas and California elevate utility charges. Annual compliance outlays between USD 50-100 million per plant erode margins and influence shutdown or conversion decisions, particularly at smaller West Coast sites.
*Our forecasts treat driver/restraint impacts as directional, not additive. The impact forecasts reflect baseline growth, mix effects, and variable interactions.
Segment Analysis
By Type: Rising Petrochemical Integration Strengthens Earnings
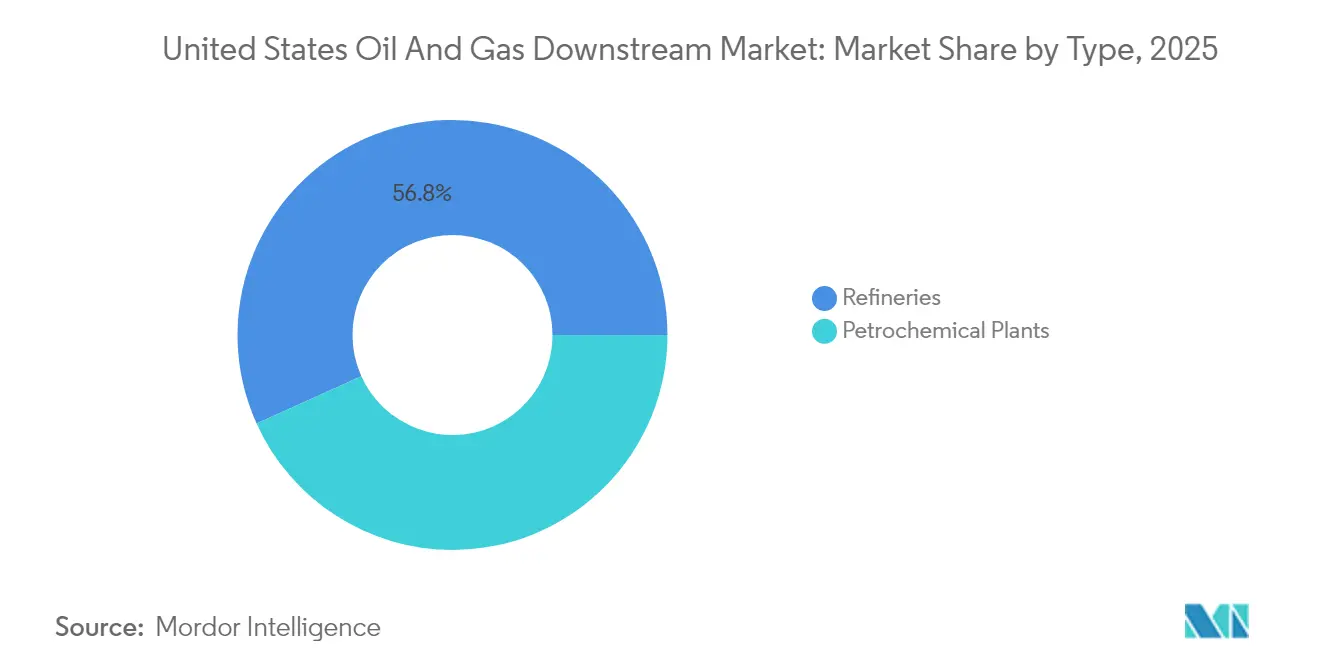
Plants classified as refineries generated 56.75% of 2025 revenue inside the United States oil and gas downstream market, but petrochemical facilities are expected to advance at a 4.12% CAGR to 2031, the fastest pace among asset types. ExxonMobil's USD 2 billion Baytown investment underscores the strategic migration toward integrated footprints that share utilities, lower feedstock transport costs, and unlock high-margin chemical streams.
Integrated complexes can divert naphtha, butane, and ethane toward ethylene or propylene production when crack spreads narrow, cushioning cash flow. Historical data indicate that petrochemical plants are expected to grow at a rate of 2.8% annually from 2019 to 2024; the acceleration to 4.12% is attributed to the advantages of North American natural-gas liquids and expanding exports to Asia. Independent refineries must decide whether to pursue similar upgrades or risk compressing profitability in fuel-only models. The shift bolsters the long-term competitiveness of diversified operators and enhances the depth of the United States' oil and gas downstream market.

By Product Type: Chemicals Earn Premium Margins
Refined petroleum products accounted for 54.05% of overall revenue in 2025; however, petrochemicals are projected to grow at a 4.25% CAGR from 2026 to 2031, outperforming fuels. Ethylene, propylene, and benzene derived from refinery streams trade at 15-25% premiums to fuel-grade equivalents, giving integrated sites a defensible advantage. In contrast, middle-distillate profits increasingly track renewable-diesel credit pricing, injecting volatility.
Traditional lubricants maintain a stable customer base in industrial equipment, even as synthetics gain popularity, supporting a USD 15 billion sub-segment that delivers predictable cash flow. Renewable diesel and SAF, while still a fraction of total output, now earn RIN and LCFS credits that narrow the cost gap with petroleum jet and diesel grades. A growing emphasis on "margin per barrel" rather than volume is shaping investment and operating decisions across the United States' oil and gas downstream market.
By Distribution Channel: Retail Sites Reinvent for Electrification
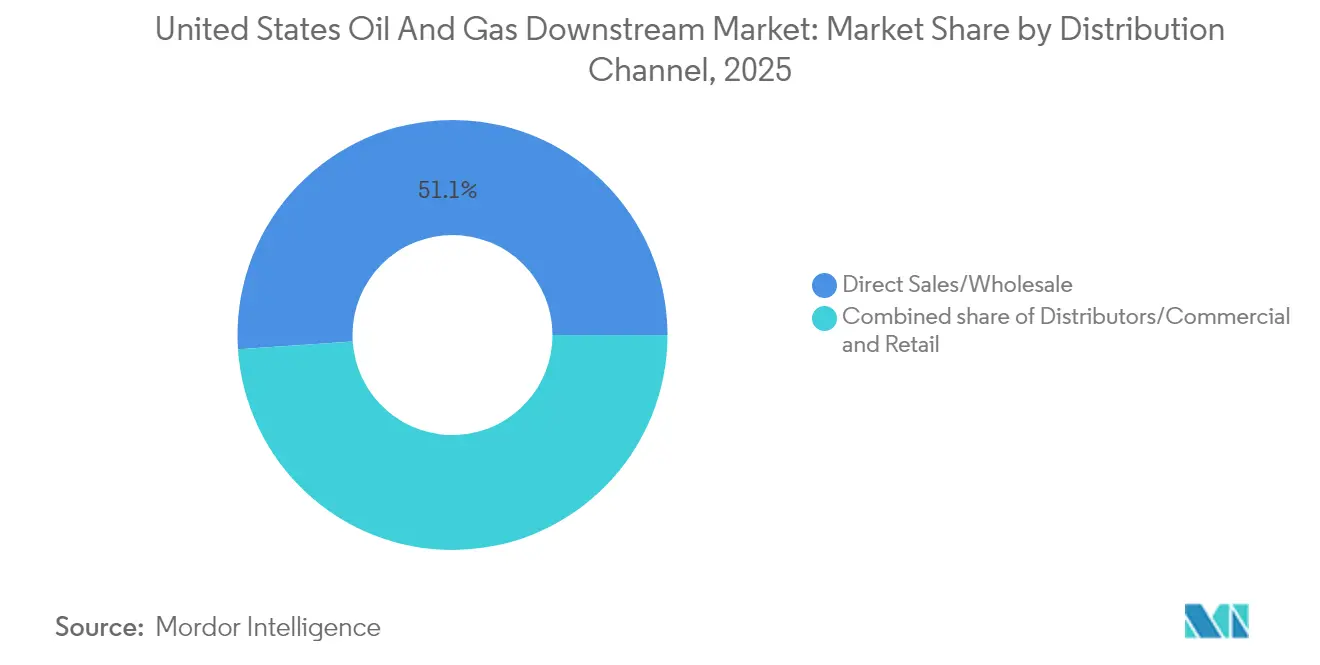
Direct and wholesale channels held a 51.05% share of revenue in 2025, achieved through long-term contracts with distributors, fleets, and industrial end-users. Their scale enables refiners to capture a significant downstream margin, but retail outlets, comprising both branded and unbranded service stations, are forecast to expand revenue at a 4.45% CAGR through 2031.
Roughly 145,000 retail stations remain, down from more than 150,000 a decade earlier, yet surviving sites post higher per-store volumes and differentiated services. Shell and BP are installing fast chargers alongside gasoline dispensers, monetizing dwell time through convenience retail and maintenance services. Retail’s ability to serve both combustion and EV customers positions it as a growth lever inside the United States oil and gas downstream market and illustrates how downstream infrastructure adapts to a mixed-energy future.
Geography Analysis
Gulf Coast facilities accounted for nearly 49.60% of the 2025 national capacity, benefiting from access to onshore shale crude, offshore imports, and natural gas liquids suitable for petrochemicals. Integrated refinery-petchem complexes in Texas and Louisiana generate economies of scope, reinforcing the region’s central role in the United States' oil and gas downstream market. Refiners here also capture export premiums by shipping diesel and gasoline to Latin America and Europe via deep-water ports.
West Coast sites confront elevated compliance costs, restricted local crude supply, and tougher air-quality rules. Valero’s planned Benicia closure and Phillips 66’s Rodeo conversion will remove sizable petroleum processing capacity, yet add renewable diesel and SAF output that captures California LCFS and Cap-and-Trade credits. Although these changes shrink traditional volume, they diversify revenue streams.
Midwest refineries act as swing suppliers, balancing Gulf Coast imports with demand in the Mid-Continent region. Pipeline connectivity to Cushing and Chicago ensures a stable supply of crude and efficient evacuation of products. East Coast facilities rely increasingly on waterborne product imports due to constrained local capacity, while Rocky Mountain plants operate as isolated mini-systems with regional pricing power.
Overall, regional revenue is expected to rise at a 3.66% CAGR to 2031, lifted by Gulf Coast expansions and tempered by West Coast conversions.
Regulatory Landscape
The United States downstream regulatory framework is primarily shaped by the US Environmental Protection Agency (EPA) under Clean Air Act programs that govern refinery emissions and gasoline distribution. In 2024, EPA finalized comprehensive updates to NESHAP for Gasoline Distribution Facilities (40 CFR Part 63, Subparts R and BBBBBB) and NSPS for Bulk Gasoline Terminals (40 CFR Part 60, Subparts XX and XXa). These updates tightened requirements for VOC and hazardous air pollutant controls, reinforcing investment needs for vapor recovery, leak detection, and monitoring across terminals and distribution assets.
In 2026, EPA actions underscored the same dual emphasis on emissions controls and fuel supply flexibility. EPA finalized Renewable Fuel Standard (RFS) volumes for 2026 and 2027, including a 70% reallocation of small refinery exemptions for 2023-2025, which changes compliance planning for smaller refiners and credit strategies. EPA also issued a national fuel waiver in June 2026 under Clean Air Act Section 211(c)(4)(C)(ii)(I), permitting 9%-15% ethanol at a common 10 psi RVP standard to address extreme fuel supply circumstances. This waiver highlights how emergency mechanisms can help manage downstream supply constraints as broader rulemaking continues (including April 2026 proposed NESHAP actions for the oil and natural gas sector and March 2026 technical revisions to 2024 NSPS/EG provisions).
Competitive Landscape
The top five operators—Marathon Petroleum, Valero Energy, Phillips 66, ExxonMobil, and Chevron—control about 40% of domestic refining capacity, signifying moderate concentration. Marathon leads with 3.0 million barrels per day (b/d) across 13 plants and complements this footprint with a retail network exceeding 6,000 branded stations. Valero operates 15 refineries that process 3.2 million barrels per day and co-owns the Diamond Green Diesel joint venture, which is scaling up renewable-diesel and SAF output.
Strategic focus increasingly rests on technology deployment and low-carbon offerings. Chevron’s alliance with Microsoft targets USD 500 million of AI-driven efficiency gains, while Phillips 66 allocates USD 850 million to repurpose Rodeo for renewable products. Independent players such as PBF Energy and HF Sinclair concentrate on niche geographies or specialty products to remain competitive.
Consolidation remains a plausible option as compliance costs rise and smaller plants struggle to fund necessary upgrades. Capital-intensive carbon-capture installations and renewable conversions favor operators with robust balance sheets. Public disclosures indicate that majors are steering 15-20% of their annual capital expenditures toward energy-transition projects, underscoring strategic hedging amid policy uncertainty.
United States Oil And Gas Downstream Industry Leaders
-
Marathon Petroleum Corp.
-
Chevron Corporation
-
Valero Energy Corporation
-
Exxon Mobil Corporation
-
Phillips 66
- *Disclaimer: Major Players sorted in no particular order
Market Opportunities and Future Outlook
Refinery reconfiguration and debottlenecking are creating whitespace in higher-margin products beyond traditional transport fuels, including base oils and petrochemical-linked streams. ExxonMobil’s January 2026 start of work on the Baytown Refinery Reconfiguration Project in Texas targets roughly 8,000 b/d of Group III base stocks capacity by 2028, which reflects a shift toward technical molecules where demand is less tied to gasoline volumes.
On capacity and reliability, the US refining system is operating at high utilization, with national operable atmospheric distillation capacity at 18.2 million b/cd on January 1, 2026 (about 250,000 b/cd lower than a year earlier). In this context, incremental throughput approvals and targeted expansions at existing sites carry more commercial weight, including the Mississippi Department of Environmental Quality final determination in March 2026 approving Chevron U.S.A. Inc. to increase Pascagoula refinery crude throughput from 361,000 b/d to 394,000 b/d. New-build proposals are also continuing to surface, such as America First Refining announcing FEED-related contracting activity for a proposed 164,300 b/d refinery at the Port of Brownsville, which signals interest in adding Gulf Coast-linked supply chains where export logistics and feedstock access can support downstream economics.
Recent Industry Developments
- May 2026: Phillips 66 announced two Gulf Coast expansion projects, the Zeus Gas Plant (300 MMcf/d) and a third Coastal Bend Fractionator (100,000 b/d) in Robstown, Texas. These assets strengthen natural gas liquids processing and fractionation needed to supply petrochemical and refining feedstock chains. The additions also deepen integration from the Permian Basin to coastal markets, supporting downstream throughput and flexibility.
- April 2026: Phillips 66 and Kinder Morgan advanced the Western Gateway Pipeline project after a successful open season, combining a new-build pipeline from Borger, Texas to Phoenix, Arizona with a planned reversal of Kinder Morgan’s SFPP, L.P. system to reach California. The project targets improved product flow optionality into the Southwest and West Coast, where logistics constraints can amplify price dislocations. Expanded pipeline connectivity can reduce reliance on longer-haul trucking and marine movements for refined products.
- February 2026: Baker Hughes and Marathon Petroleum signed a multiyear preferred provider agreement to supply downstream chemical technologies across Marathon’s 12 refineries and two renewable fuel facilities in the United States. Standardizing chemicals and technical support across a large network can improve reliability and turnaround performance while helping sites manage process and environmental requirements. The agreement also signals continued operating-efficiency investment alongside capital projects for renewable fuels.
Research Methodology Framework and Report Scope
Market Definition and Coverage
For this study, the United States oil and gas downstream market is defined as the value created from converting crude into refined fuels and related products, and then moving and selling those outputs through wholesale, distributor, and retail channels.
Scope exclusions: Upstream exploration and production, midstream pipeline and storage-only services, and crude oil trading that does not result in refined product sales are excluded.
Segmentation Overview
- By Type
- Refineries
- Petrochemical Plants
- By Product Type
- Refined Petroleum Products
- Petrochemicals
- Lubricants
- By Distribution Channel
- Direct Sales/Wholesale
- Distributors/Commercial
- Retail
Data Sources, Market Sizing, and Validation
Desk Research
Desk research sets the foundation for what the downstream system can physically produce and what products are being consumed. We used public energy and refinery statistics such as U.S. Energy Information Administration (EIA) refinery capacity, utilization, product supplied, and stock data, which helps link refining throughput to finished product availability.
To sanity check the operating environment, we also reviewed sources such as EPA fuel and emissions rulemaking, U.S. Census and BEA macro series tied to industrial output and transport activity, and trade and customs releases that show refined product import and export flows. Company annual filings and investor decks were reviewed for refining and marketing context, and we used paid subscriptions for company financials and news to keep major events and plant changes current. The sources listed here are not exhaustive, and additional references were used for data collection, validation, and clarification.
Primary Interviews and Surveys
Primary work focused on people who can confirm what moves volumes and margins in US refining and marketing, and how product mix is changing. We spoke with a balanced set of refining operations, supply and trading, distribution, and downstream commercial roles, which helped resolve questions on utilization behavior, channel share, and realistic price movement assumptions.
Distribution of primary research fieldwork respondents
| Company type | Respondent position |
|---|---|
| Top tier: 36% | CXOs: 16% |
| Mid tier: 48% | Functional/Unit leaders: 29% |
| Smaller Players: 16% | Managers: 55% |
Market-Sizing & Forecasting
The sizing starts from a top-down reconstruction where US refinery capacity, utilization, and implied throughput are translated into an addressable pool of refined outputs and downstream sales activity. We then corroborated totals with selective bottom-up checks, such as sampled product volumes by channel (wholesale, distributor, retail) and price-per-unit assumptions for key products, which are adjusted when implied totals look inconsistent.
Inputs used in the model include refinery capacity additions and closures, utilization rate ranges by cycle, refined product demand signals (product supplied), import and export balance for refined products, and product mix shifts across fuels, petrochemical feedstocks, and lubricants. When the model is finalized, these variables collectively keep the value estimate tied to observable throughput and consumption rather than only reported revenue claims.
For forecasting, scenario analysis was used, and the scenarios were anchored on expected utilization bands, product demand direction, and policy-driven fuel specification shifts, which were pressure-tested through primary feedback. Where data gaps appeared in channel splits or product-level price paths, conservative ranges were applied and then re-checked against the total implied market value.
Data Validation & Update Cycle
Model outputs are checked against independent signals such as utilization trends, product supplied movements, and visible trade balance shifts for refined products. If a result produces a sharp jump that does not align with these signals, assumptions are reopened and a second pass is completed before sign-off.
Reviews happen in steps, starting with analyst self-checks and followed by peer review for logic, units, and year-over-year reasonableness. Reports are refreshed annually, and interim updates are triggered when major refinery outages, capacity changes, or regulatory actions materially change market conditions. Before delivery, we perform a final current-events scan so the estimate reflects the latest public releases.
Mordor Intelligence's United States Oil and Gas Downstream Market Estimate Compared With Other Published Estimates
Published market sizes for US oil and gas downstream do not always match because authors define downstream differently and they also choose different value yardsticks. Some figures lean on broad revenue pools, while others stick closer to the value linked to refining and petrochemical output plus distribution and retail activity.
Key gap drivers usually come from what is counted inside the market, how product and channel mix is treated, and whether pricing is modeled as spot-heavy or as a blended average across customer types. The biggest spread here is explained by including end-user spending or broad petroleum value pools versus counting only refining plus petrochemical plants and the related sales channels, a scope choice applied by Mordor Intelligence.
Benchmark comparison
| Source | Market Size | Gaps in Research Methodology |
|---|---|---|
| Mordor Intelligence | USD 21.76 B (2025) | |
| Industry Publisher A | USD 256.42 B (2025) | This figure appears to use a much broader downstream value pool, likely capturing wider petroleum end-user spending and larger revenue layers beyond refining and petrochemical output plus channel operations, which inflates the addressable value. |
| Trade Article B | USD 19.60 B (2025) | This estimate seems narrower in practice, with limited visibility on channel splits and product mix treatment, and it may apply conservative pricing or exclude parts of petrochemical and lubricants-linked downstream value. |
Taken together, the comparison shows that scope and pricing logic drive most of the difference, not a single data point. By keeping variables traceable to capacity, utilization, demand signals, and channel activity, the market size stays repeatable and easier for decision-makers to audit year to year.
Key Questions Answered in the Report
What is the projected value of the United States oil and gas downstream market by 2031?
The United States oil and gas downstream market is forecast to reach USD 27.46 billion by 2031, supported by a 3.95% CAGR over 2026-2031.
Which segment is expected to register the fastest volume growth through 2031?
Petrochemical plants are set to expand at a 4.12% CAGR, the fastest among asset types, as refiners integrate chemical production for higher margins.
How are refiners responding to rising EV adoption?
Operators are blending renewable diesel, installing EV chargers at retail sites, and leveraging carbon-capture credits to mitigate gasoline-demand erosion.
Why is the Gulf Coast dominant in downstream capacity?
The Gulf Coast benefits from proximity to shale crude, natural-gas liquids, and deep-water ports, giving it about 49.60% of national capacity and a 4.05% CAGR outlook.
What role does artificial intelligence play in downstream operations?
AI-driven digital twins and predictive maintenance systems have reduced unplanned downtime by 20% and generated savings of up to USD 2 billion annually for leading refiners.