
Market Overview
| Study Period | 2020 - 2031 |
|---|---|
| Forecast Data Period | 2026 - 2031 |
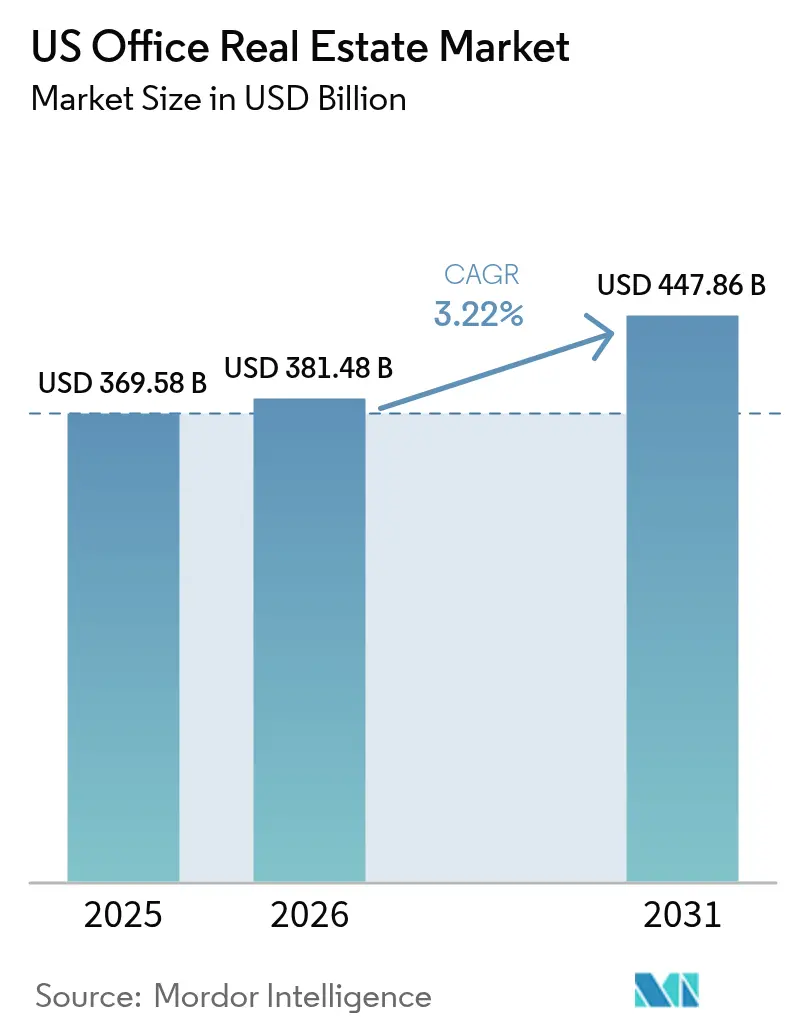
| Base Year Market Size (2025) | USD 369.58 Billion |
| Market Size (2026) | USD 381.48 Billion |
| Market Size (2031) | USD 447.86 Billion |
| Growth Rate (2026 - 2031) | 3.22% CAGR |
| Market Concentration | Medium |
Major Players *Disclaimer: Major Players sorted in no particular order Image © Mordor Intelligence. Reuse requires attribution under CC BY 4.0. | |
US Office Real Estate Market Analysis by Mordor Intelligence
The US Office Real Estate Market size was valued at USD 369.58 billion in 2025 and estimated to grow from USD 381.48 billion in 2026 to reach USD 447.86 billion by 2031, at a CAGR of 3.22% during the forecast period (2026-2031). Tenant “flight-to-quality” continues to reshape demand as premium, sustainable buildings absorb space while secondary assets struggle to retain tenants. Grade A properties already command 58% of occupied stock and capture nearly all positive net absorption, highlighting a decisive pivot from cost efficiency toward workplace experience. Flexible leasing, resilient demand from knowledge-intensive sectors, and infrastructure upgrades in transit-served districts further bolster the United States office real estate market despite elevated financing costs. At the same time, the bifurcation between prime and obsolete space widens as sustainability mandates accelerate retrofit requirements and hybrid work suppresses demand for outdated suburban offices.
Key Report Takeaways
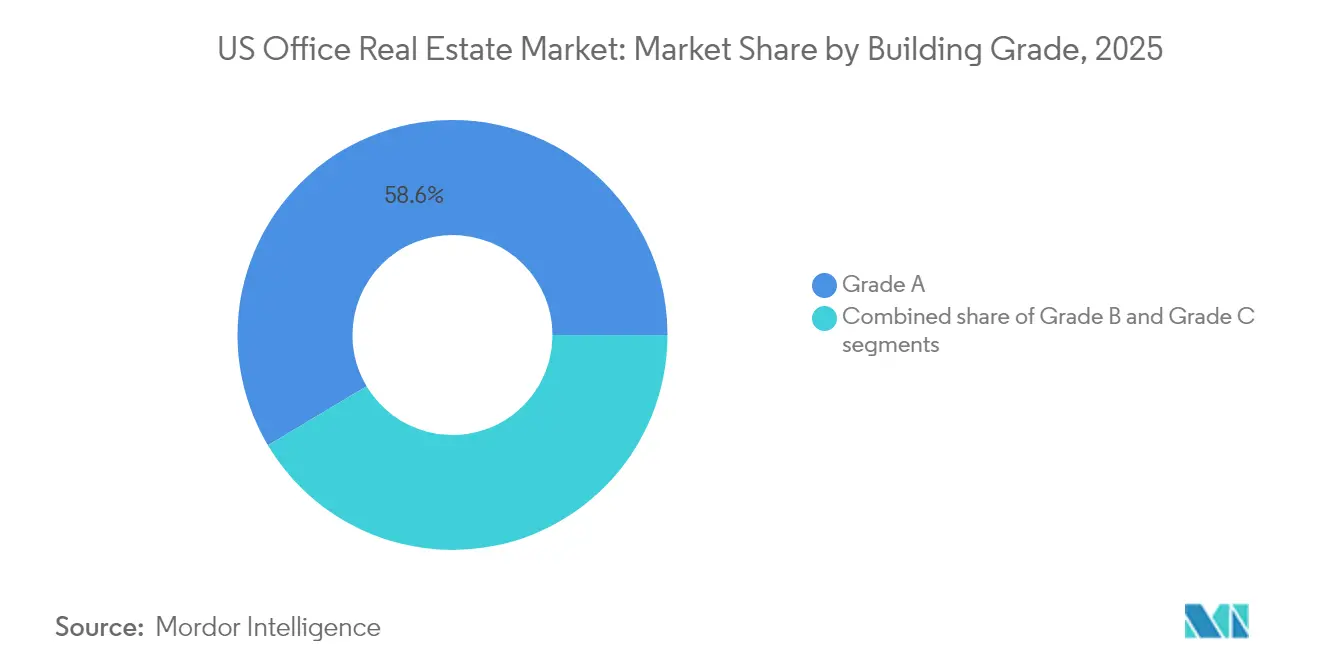
- By building grade, Grade A stock held 58.56% of the United States office real estate market share in 2025, while Grade A space is projected to expand at a 3.76% CAGR to 2031.
- By transaction type, the rental segment captured 68.21% revenue share in 2025; sales transactions recorded the fastest 3.66% CAGR through 2031.
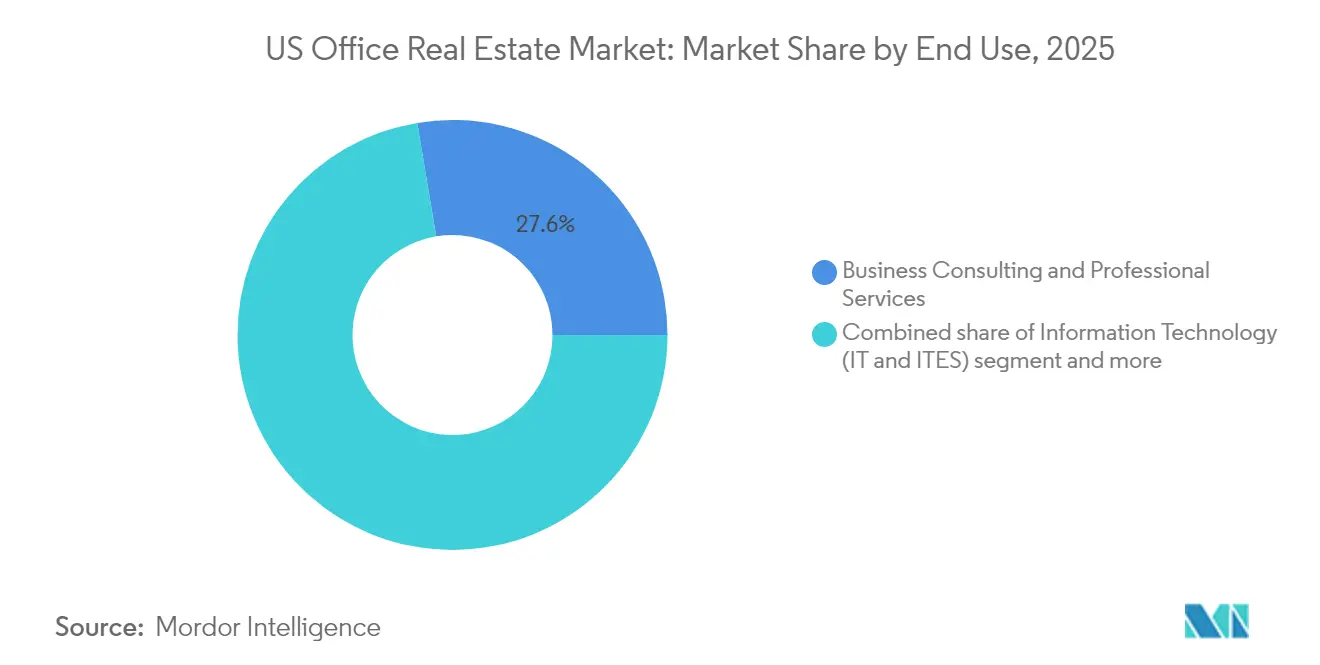
- By end use, Business Consulting & Professional Services accounted for 27.62% share of the United States office real estate market size in 2025, whereas Information Technology advances at a 3.88% CAGR between 2026-2031.
- By state, New York led with a 23.65% share in 2025, while Texas posts the highest forecast growth at 4.15% CAGR through 2031.
Note: Market size and forecast figures in this report are generated using Mordor Intelligence’s proprietary estimation framework, updated with the latest available data and insights as of 2026.
US Office Real Estate Market Trends and Insights
Drivers Impact Analysis*
| Driver | (%) Impact on CAGR Forecast | Geographic Relevance | Impact Timeline |
|---|---|---|---|
| Tenant preference for Class A and sustainable buildings | +0.8% | National, strong in New York, San Francisco, Austin | Medium term (2-4 years) |
| Leasing demand from tech, healthcare & finance | +0.7% | Major metropolitan areas | Short term (≤ 2 years) |
| Sustainability mandates and green retrofits | +0.6% | Federal assets set the tone nationwide | Long term (≥ 4 years) |
| Growth of flexible and short-term leases | +0.5% | Secondary markets show higher uptake | Medium term (2-4 years) |
| Urban infrastructure upgrades | +0.4% | Transit-connected CBDs | Long term (≥ 4 years) |
| Source: Mordor Intelligence | |||
Growing Tenant Preference for Class A and Sustainable Buildings
Premium offices now serve as recruitment tools that enhance productivity, pushing occupiers to prioritize building quality over rent savings. The General Services Administration’s requirement for LEED Gold certification in new federal projects signals a market-wide baseline for quality and sustainability. Owners of certified assets realize stronger rent growth because tenants view environmental credentials as integral to corporate ESG targets. Prime urban buildings with energy-efficient systems and proximity to transit record higher occupancy and command longer lease commitments. Obsolete assets lacking these features face value erosion, reinforcing the bifurcation within the United States office real estate market.
Leasing Demand Supported by Resilient Sectors
Technology, healthcare, and finance collectively drove more than half of 2024 leasing activity, dispelling fears of structural office demand collapse. Amazon’s 141,000 sq ft Silicon Valley lease with WeWork underscores selective tech expansion in premium space. Financial institutions maintain physical footprints to satisfy regulatory and client interaction needs. Healthcare providers require specialized office layouts to integrate telehealth with in-person services, sustaining demand even as other sectors downsize. The United States office real estate market thus benefits from a resilient core of industries that continue to lease high-specification space.
Increased Adoption of Flexible and Short-Term Lease Structures
Corporate real estate heads seek agility, replacing decade-long leases with terms that include contraction and expansion clauses. In 2024, 42% of occupiers incorporated flexible space into their portfolios, a structural shift rather than a pandemic-era anomaly. Landlords offering turnkey suites and plug-and-play floors capture higher occupancy and can charge rent premiums for optionality. The trend is especially pronounced in secondary markets where tenants value flexibility to scale as local labor pools grow. This leasing innovation underpins stable cash flows for adaptable landlords across the United States office real estate market.
Infrastructure Upgrades Improving Office Accessibility
Transit investments in New York, Chicago, and Austin enhance last-mile connectivity and raise the desirability of adjacent office blocks. Accessibility is paramount in a hybrid work setting where employees commute fewer days but expect convenience when they do. Districts tied into upgraded subway stations or bus rapid transit lines post noticeably faster rent growth and absorption than car-dependent submarkets. City governments increasingly bundle office permits with mobility upgrades, aligning public and private capital to rejuvenate downtowns. These synergies reinforce location premiums in the United States office real estate market.
Restraints Impact Analysis*
| Restraint | (%) Impact on CAGR Forecast | Geographic Relevance | Impact Timeline |
|---|---|---|---|
| Elevated vacancy in outdated & suburban stock | -0.9% | Suburban & secondary CBDs | Medium term (2-4 years) |
| High interest rates & tight financing | -0.8% | National, leveraged deals | Short term (≤ 2 years) |
| Delayed return-to-office enforcement | -0.6% | Gateway cities most affected | Short term (≤ 2 years) |
| Source: Mordor Intelligence | |||
Elevated Vacancy Rates in Outdated and Suburban Offices
Functional obsolescence accelerates for buildings with inefficient layouts, limited technology infrastructure, or poor ESG credentials. National vacancy hit record highs in early 2025, with Class C suburban parks posting double-digit vacancy premiums over downtown Class A stock. Reduced daily commuting weakens footfall that once supported suburban retail amenities, further depressing tenant demand. Landlords face difficult investment decisions: undertake expensive upgrades or accept declining cash flows. The drag from obsolete space tempers overall growth in the United States office real estate market[1]Lawrence Yun, “Commercial Real Estate Market Insights January 2025,” National Association of Realtors, nar.realtor.
Delayed Return-to-Office Trends Hindering Space Absorption
Only 17% of firms enforce attendance rules despite 80% having formal policies, keeping average physical occupancy below 50%. This “shadow vacancy” delays lease restructurings as tenants hesitate to commit to long-term footprints[2]Thomas Bisacquino, “Office Space Demand Forecast Q2 2025,” NAIOP Research Foundation, naiop.org. Landlords must recalibrate revenue forecasts, stretching payback periods on capital projects. The uncertainty also weighs on investor sentiment, widening bid-ask spreads for transactions. These dynamics restrain short-term momentum within the United States office real estate market.
*Our forecasts treat driver/restraint impacts as directional, not additive. The impact forecasts reflect baseline growth, mix effects, and variable interactions.
Segment Analysis
By Building Grade: Premium Assets Consolidate Power
Grade A buildings represented 58.56% of occupied stock in 2025, underscoring their dominance within the United States office real estate market. Prime assets posted 3.76% forecast CAGR through 2031—well above the broader market—due to a decisive flight-to-quality by tenants. Positive net absorption for Grade A space surpassed 2 million sq ft in Q1 2025, even as overall market absorption remained flat. The United States office real estate market size for Grade A assets is therefore positioned to expand faster than any other grade category over the forecast horizon.
Superior HVAC systems, touchless technologies, and wellness amenities turn premium workplaces into strategic talent-retention tools. Public-sector standards such as the GSA’s LEED Gold requirement converge with private-sector ESG targets to cement Grade A credentials as the default specification for large occupiers. Investors harness this momentum, funneling capital into trophy towers and core-plus refurbishments, while pricing discounts for secondary assets widen. Consequently, premium stock is likely to seize a larger United States office real estate market share as obsolete buildings exit competitive inventory.


By Transaction Type: Rental Dominance Sustained
Rental agreements controlled 68.21% of transaction value in 2025, affirming their preeminence in the United States office real estate market. Despite that dominance, sales transactions exhibit a stronger 3.66% CAGR through 2031 as opportunistic investors hunt value. The United States office real estate market size attached to rental contracts continues to grow steadily because corporate balance-sheet flexibility outweighs ownership allure in a volatile economic backdrop.
Large renewal deals—68 of the 100 biggest transactions in 2024—illustrate tenant preference for known buildings, upgraded amenities, and landlord concessions over relocation risk. Meanwhile, well-capitalized real estate investment trusts issue unsecured notes, such as BXP’s USD 850 million bond, to fund acquisitions during price dislocations. The coexistence of dominant rentals and accelerating sales highlights a maturing United States office real estate market where leasing and investing serve complementary strategic purposes.
By End Use: Professional Services Anchor Demand
Business Consulting & Professional Services held the largest 27.62% share in 2025, reinforcing the sector’s pivotal role in the United States office real estate market. Information Technology, the fastest-growing end-user segment, is projected to expand at a 3.88% CAGR to 2031 as tech giants selectively add premium space in innovation hubs. The United States office real estate market size attributable to professional services remains stable because these firms rely on client-facing collaboration that favors central locations.
Professional-services occupiers optimize layouts by integrating flexible meeting zones and digital collaboration suites, keeping footprints lean yet high quality. Tech firms, by contrast, consolidate secondary locations while expanding downtown hubs, as shown by Google’s pivot from One Market Plaza to 345 Spear Street. Banking, insurance, and asset-management companies maintain steady leasing tied to compliance requirements and client interactions. Together, these knowledge-based industries underpin revenue stability for landlords in the United States office real estate market.
Geography Analysis
New York retained a commanding 23.65% share in 2025, reflecting its magnetic pull as a global finance and media capital. Twenty-four of the 100 largest office leases last year took place in Manhattan, underscoring sustained appetite for centrally located, transit-rich space even as hybrid work endures. Prime buildings near Penn Station and Grand Central secure the highest rentals because employees value short commute times and abundant neighborhood amenities. Still, elevated operating costs and tax burdens are prompting some firms to explore lower-cost alternatives, pressuring New York landlords to invest aggressively in amenities and ESG upgrades.
Texas charts the fastest 4.15% CAGR through 2031, propelled by corporate relocations to Austin, Dallas, and Houston. Advantageous tax structures, affordable housing, and deep engineering talent pools attract both financial services and technology firms seeking to scale efficiently. Infrastructure investments like Austin’s Project Connect light-rail system further boost office demand by improving access to emerging districts. As a result, the United States office real estate market in Texas is likely to close a portion of the share gap with coastal gateways over the forecast period.
California remains a heavyweight, its performance linked closely to technology sector fortunes in Silicon Valley and media expansion in Los Angeles. Although several tech companies trimmed excess suburban campuses, demand for top-tier collaboration hubs in downtown San Francisco and Sunnyvale persists. Florida leverages favorable tax policy and Miami’s status as a Latin American finance gateway to attract new investment, while Illinois capitalizes on Chicago’s logistics network and diversified economy to retain occupiers. Collectively, these dynamics point to a geographic rebalancing where Sun Belt growth complements the enduring appeal of legacy coastal centers, shaping a more polycentric United States office real estate market.
Regulatory Landscape
Federal workspace and building standards increasingly shape tenant requirements and capital plans for office assets, especially where government is the occupier or where federal rules set wider market norms. The General Services Administration (GSA) continues to anchor design and performance expectations through its Facilities Standards for the Public Buildings Service (P100) and the revised PBS Interim Core Building Standards (updated April 2025). These standards apply to federal projects in design or under 50% completion and focus on energy efficiency and cost outcomes. Separately, the Department of Energy (DOE) stayed the compliance date for provisions of its Clean Energy Rule for new federal buildings (10 CFR Part 433) until May 1, 2026, creating a defined near-term pause in some federal energy compliance timing while policy review proceeds.
Space utilization policy is also tightening for federal office portfolios, affecting how agencies plan renewals and how landlords underwrite federal tenancies. The USE IT Act (signed January 2025) requires utilization monitoring for covered agencies and directs GSA action to reduce space after two consecutive years below 60% utilization, while OMB Memorandum M-25-25 (April 2025) adds implementation direction, including a 150 square feet per person design standard for new federal office acquisitions. In June 2026, GSA Order OAS 7005.1B reinforced internal targets with an 80% utilization goal, which is pushing adoption of occupancy sensing and reporting workflows that can also carry into private-sector operating practices and leasing packages.
Value Chain Analysis
The US office real estate value chain runs from land acquisition and entitlement through development or major renovation, leasing, and ongoing asset operations, and then into capital markets execution (refinancing, recapitalization, and sale). Developers and owners typically use architects and engineers to translate tenant requirements (HVAC, wellness, digital infrastructure, and ESG documentation) into base-building and tenant-improvement scopes, while general contractors and specialty trades execute retrofit-heavy projects that dominate current investment decisions. Construction and commissioning then feed into brokerage and leasing, property management, and facilities operations, where measured performance (energy, indoor air quality, and utilization) supports tenant retention and reporting needs.
Market conditions are also shifting where value is created across the chain. With new office construction starts in 2024 falling to about 9.8 million square feet and 2024 deliveries at roughly 43.2 million square feet (down sharply year over year), the pipeline has contracted. Activity is concentrating on repositioning, selective Class A upgrades, and conversions of obsolete stock. This change increases the role of capital providers and restructuring specialists as office values have declined materially in recent years, while also raising dependence on top-tier contractors for complex occupied-building work, including firms such as Turner Construction, Bechtel, Kiewit, Whiting-Turner, and STO Building Group. On the demand side, occupier downsizing and shorter commitments are reinforcing broker-led flexibility solutions and owner-operated turnkey suites, strengthening the link between space product and cash flow stability.
Competitive Landscape
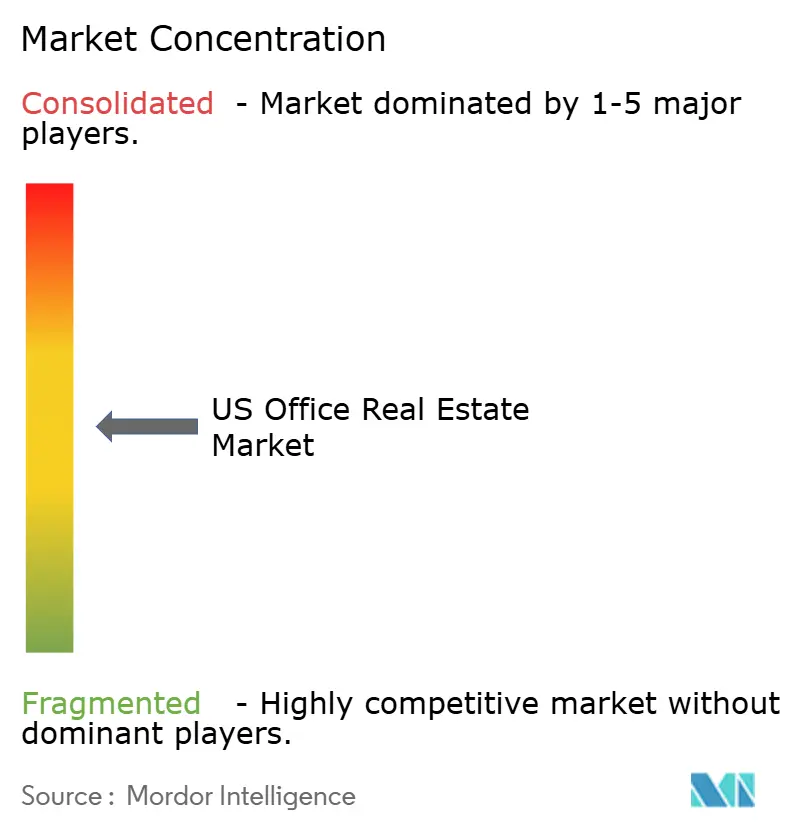
The US office real estate market is moderately concentrated, with a mix of national REITs, regional developers, and private equity funds vying for tenants through amenity upgrades and sustainability credentials. Large listed landlords such as BXP, SL Green, and Vornado dominate core coastal markets, whereas regionally focused operators maintain an edge in fast-growing Sun Belt cities. Differentiation hinges less on headline rent and more on tenant experience, ranging from smart-building technologies to hospitality-grade services that entice staff back on site.
A clear “flight-to-quality” strategy shapes portfolio actions: BXP’s USD 850 million unsecured note issue funds core acquisitions while divestments target non-core suburban holdings. Blackstone’s USD 4 billion all-cash purchase of ROIC illustrates institutional appetite for repositioning edge-city assets into mixed-use complexes. Meanwhile, flexible-workspace providers partner with owners to operate turnkey floors, enabling landlords to meet tenant agility demands without cannibalizing long-term leases.
Technology is now a decisive battleground. Sensors that monitor air quality, desk occupancy, and energy consumption deliver data-driven optimization and ESG reporting, giving tech-forward buildings a marketing edge. Sustainability retrofits also influence refinancing terms; Office Properties Income Trust renegotiated USD 340 million in notes partly by showcasing its green-building roadmap. As capital gravitates toward premium, future-ready assets, weaker owners of obsolete stock face strategic crossroads—either pursue capital-intensive upgrades or exit at discounts, thereby reinforcing a two-tier competitive structure across the United States office real estate market.
US Office Real Estate Industry Leaders
BXP, Inc.
SL Green Realty Corp.
Brookfield Properties
Vornado Realty Trust
Kilroy Realty Corp.
- *Disclaimer: Major Players sorted in no particular order

Market Opportunities and Future Outlook
The market opportunity set is being shaped by two observable shifts: tighter standards around building performance and a more explicit utilization and efficiency push in large portfolios. Federal actions provide near-term structure and visibility. The USE IT Act (signed January 2025) and OMB M-25-25 (April 2025) require agencies to monitor utilization and introduce a 150 square feet per person design standard for new federal office acquisitions; GSA Order OAS 7005.1B (June 2026) adds an 80% internal utilization goal. Together, these measures expand demand for building systems and operating models that can document real usage, including occupancy sensing, access-control analytics, and asset-level reporting. That creates a clearer pathway for landlords and service providers to package compliant, measurable office environments for government and government-adjacent occupiers.
A second opportunity is emerging from the widening performance gap between prime and secondary assets, alongside a shrinking new-supply pipeline. Industry data indicate national vacancy stabilizing in early 2026, while prime submarkets continue to transact at the top end of rents, including Midtown Manhattan reporting very low prime vacancy (2.9%) and over 4 million square feet of leasing in Q1 2026 at rents above USD 100 per square foot. At the same time, construction contraction and inventory reduction through redevelopment and conversions are changing competitive supply. That environment favors owners with well-located Grade A buildings and those able to execute targeted upgrades (HVAC, wellness, and digital) aligned with tenant flight-to-quality. For weaker assets, the vacancy and pricing pressure is increasingly tied to repositioning and alternate uses that remove obsolete stock from competitive office inventory, supporting clearer pricing and leasing narratives for the remaining stabilized office set.
Recent Industry Developments
- July 2026: SL Green announced an agreement to expand the SUMMIT immersive observatory experience to Tokyo, extending the SUMMIT platform beyond New York. While not a core leasing transaction, it broadens a high-visibility revenue stream tied to flagship assets like One Vanderbilt and reinforces the owner-operator approach to monetizing prime locations.
- June 2026: BXP reported executing a 150,000 sq ft lease with McDermott Will & Schulte at 343 Madison Avenue in New York. The deal highlights continued demand for well-located, amenity-forward space among professional services tenants, supporting the broader flight-to-quality dynamic in top CBD corridors.
- January 2025: BXP finalized a 246,000 sq ft 20-year renewal and expansion with KnitWell Group at 7 Times Square in New York. The long-duration commitment underscores the value of upgraded, transit-served Class A buildings in retaining large tenants and stabilizing cash flows amid elevated vacancy in lower-quality stock.


Research Methodology Framework and Report Scope
Market Definition and Coverage
We define the market as the annual USD value tied to completed, income-producing office buildings in the United States that are leased, re-leased, or sold during the year, based on observable transaction and leasing activity.
Scope exclusions: The sizing excludes offices under construction, owner-occupied headquarters, medical or life-science office stock, and assets already converted to residential use.
Segmentation Overview
- By Building Grade
- Grade A
- Grade B
- Grade C
- By Transaction Type
- Rental
- Sales
- By End Use
- Information Technology (IT & ITES)
- BFSI (Banking, Financial Services and Insurance)
- Business Consulting & Professional Services
- Other Services (Retail, Life-science, Energy, Legal)
- By States
- Texas
- California
- Florida
- New York
- Illinois
- Rest of US
Data Sources, Market Sizing, and Validation
Desk Research
Desk research was used to set the market guardrails and build a consistent demand and pricing story before modeling started. We relied on public market indicators, including the US Bureau of Labor Statistics (office-using employment), US Census Bureau construction and economic series, and the Bureau of Economic Analysis for macro variables and price deflators that keep the dollar series comparable across years. For property market pulses, we referenced open releases from groups such as Nareit and public materials from the Federal Reserve (rate and credit conditions), since office values and leasing decisions are sensitive to financing costs.
To translate activity into market value, we reviewed company filings, REIT supplemental packages, investor presentations, and reputable press for disclosed leasing spreads, occupancy moves, cap rate commentary, and disposition pricing ranges. We also used paid database subscriptions for company financials and news, plus an import-export shipment-level database only when fit-out and renovation trade flows were useful as a directional check. These desk sources are illustrative, and many other public and paid references were also used for data collection, validation, and research clarification.
Primary Interviews and Surveys
Primary work focused on testing assumptions that desk sources cannot settle cleanly, especially where leasing terms and effective rents differ from quoted rents. We spoke with a mix of asset managers, brokers, occupier-side advisors, and property operators across major US metros so our vacancy, absorption, concession, and pricing inputs reflected what was actually being seen in deals. Follow-ups were done when model outputs moved outside normal ranges for a given year, which helped tighten the final sizing.
Distribution of primary research fieldwork respondents
| Company type | Respondent position | Region |
|---|---|---|
| Top tier: 39% | CXOs: 20% | |
| Mid tier: 40% | Functional/Unit leaders: 35% | |
| Smaller Players: 21% | Managers: 45% |
Market-Sizing & Forecasting
Sizing starts with a top-down build where US office stock activity is reconstructed through leasing and sales signals, and then converted into annual market value using rent levels, typical lease structures, and observed pricing benchmarks. We then corroborate the result with selective bottom-up approximations, such as sampling disclosed REIT leasing volumes and dispositions, plus metro-level channel checks, and we adjust the totals if the two views drift too far.
Key inputs treated as decision drivers include net absorption direction, vacancy movement, effective rent change (including concessions), cap rate direction, refinancing pressure from interest rates, and the pace of flight-to-quality leasing into better buildings. For forecasting, scenario analysis was used so the model could flex around differing assumptions on hybrid work normalization, office-using employment growth, and the timing of rate relief, which were also discussed in primary conversations. Where bottom-up disclosures were missing, gaps were handled using proxy metrics from similar property profiles and by applying conservative interpolation across years rather than forcing a full roll-up.
Data Validation & Update Cycle
Outputs are checked against independent market signals so obvious mismatches are caught early, including whether modeled value direction aligns with vacancy, absorption, rent trend, and transaction volume narratives for the same period. Anomaly checks are run at multiple steps, followed by an internal review where assumptions are stress-tested and key calculations are re-performed before sign-off.
The study is refreshed on an annual cycle, and interim updates are triggered when there are material shifts such as sharp rate moves, major leasing rebounds, or sudden transaction freezes. Before delivery, we do a fresh pass on the newest public releases and recent primary notes so clients receive an updated view rather than an older snapshot.
Mordor Intelligence's United States Office Real Estate Market Size Compared With Other Published Estimates
Published market size figures can look far apart in office real estate because authors are not always counting the same dollar pool, and the timing of resets to rents and pricing can also differ. In our work, the market is tied to measurable leasing and sales activity, which makes it easier to audit the logic year to year.
The main gap comes from whether a study counts development pipeline and owner-occupied office value. Here, Mordor Intelligence treats the market as completed, income-producing office buildings tied to leasing, re-leasing, or sales activity, and it leaves out under-construction space and owner-occupied headquarters. Differences also show up when effective rents are not adjusted for concessions, when cap rate assumptions are taken from a narrow set of gateway cities, or when currency timing and inflation treatment are not made consistent across the time series.
Benchmark comparison
| Source | Market Size | Gaps in Research Methodology |
|---|---|---|
| Mordor Intelligence | USD 369.58 B (2025) | |
| Global Brokerage Research A | USD 510.00 B (2025) | Estimate appears to fold in a broader office value pool that can include owner-occupied assets and development value, and it may rely more on appraisal-style stock valuation rather than activity-linked leasing and sales value for the year. |
| Industry Data Publisher B | USD 300.00 B (2025) | Figure likely leans on a narrower transaction-only lens, which can undercount leasing-driven value in slower sales years, and it may use headline asking rents without consistently adjusting for concessions and effective rent shifts. |
The spread across the three values is best explained by what is counted and when pricing inputs get refreshed, not by small math differences. By keeping the scope anchored to completed, income-producing office activity and then cross-checking it with leasing and pricing signals, the final number stays traceable to inputs a client can understand and replicate.


Key Questions Answered in the Report
What is the current size of the United States office real estate market?
The market reached USD 381.48 billion in 2026 and is forecast to rise to USD 447.86 billion by 2031.
Which building grade captures the most demand?
Grade A buildings hold 58.56% of market share and are projected to grow at a 3.76% CAGR through 2031, underscoring sustained tenant flight-to-quality.
Which state is the fastest-growing office market?
Texas leads with a forecast 4.15% CAGR to 2031, driven by corporate relocations to Austin, Dallas, and Houston.
How are flexible leases influencing landlord strategies?
Forty-two percent of occupiers now use flexible space, prompting landlords to offer shorter terms, expansion rights, and turnkey suites to capture demand.
What role do sustainability mandates play in office demand?
Federal and corporate ESG requirements accelerate green retrofits and concentrate demand in certified buildings, enhancing pricing power for owners of sustainable assets.
Are high interest rates deterring investment?
Transaction volumes dipped amid tighter financing, but well-capitalized REITs and private equity funds continue to acquire and reposition quality assets during the dislocation.
Page last updated on:






