Market Overview
| Study Period | 2020 - 2031 |
|---|---|
| Base Year For Estimation | 2025 |
| Forecast Data Period | 2026 - 2031 |
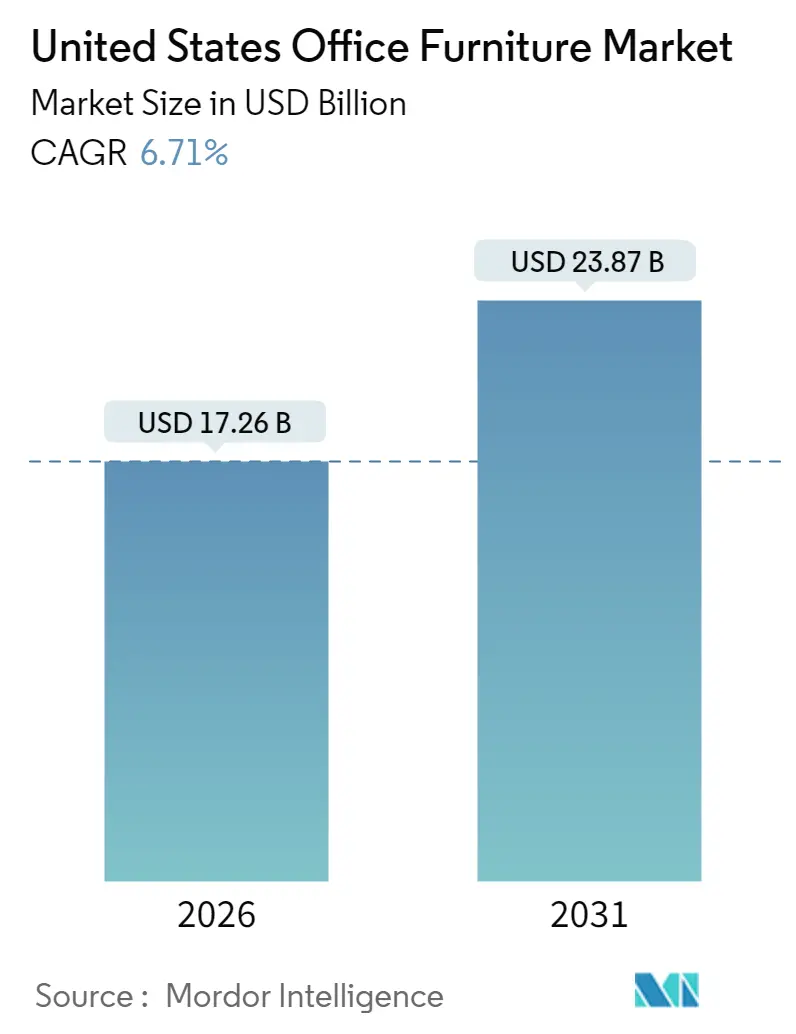
| Market Size (2026) | USD 17.26 Billion |
| Market Size (2031) | USD 23.87 Billion |
| Growth Rate (2026 - 2031) | 6.71% CAGR |
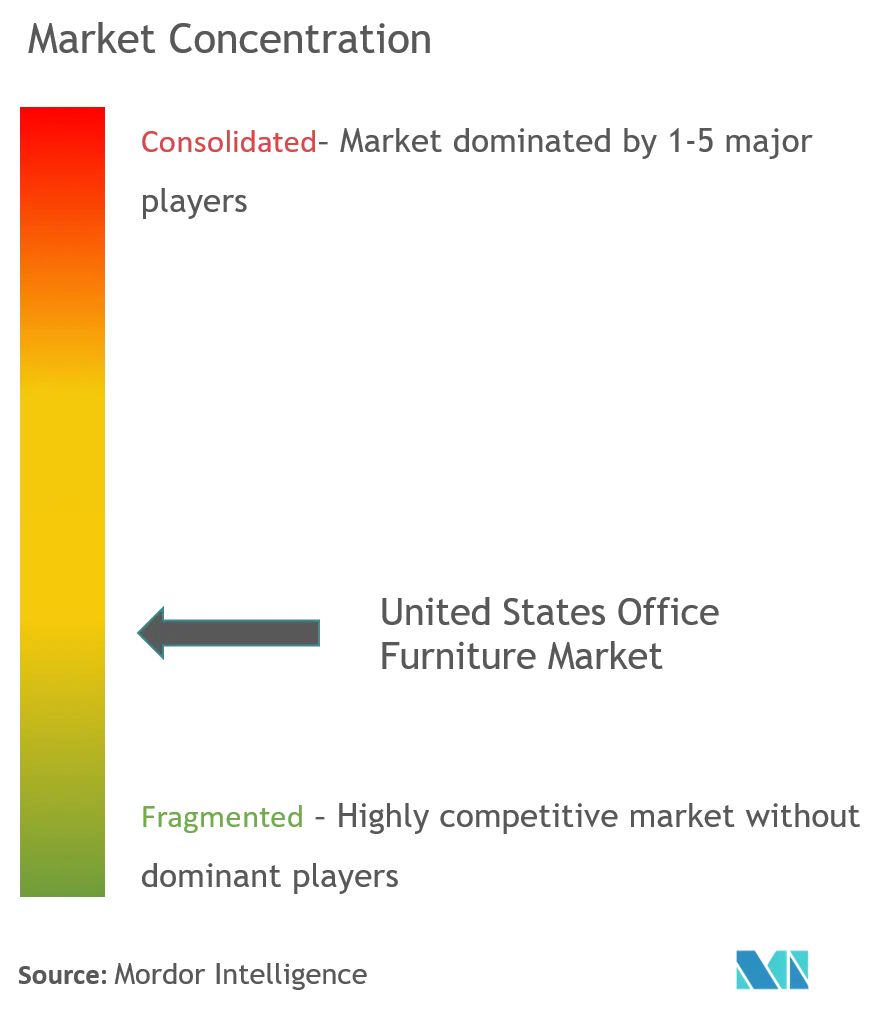
| Market Concentration | Medium |
Major Players *Disclaimer: Major Players sorted in no particular order Image © Mordor Intelligence. Reuse requires attribution under CC BY 4.0. | |
United States Office Furniture Market Analysis by Mordor Intelligence
The United States office furniture market is expected to grow from USD 16.18 billion in 2025 to USD 17.26 billion in 2026 and is forecast to reach USD 23.87 billion by 2031 at 6.71% CAGR over 2026-2031. Growth is powered by hybrid work, which reshapes offices into smaller, flexible zones built for teamwork rather than rows of fixed desks. This change lifts demand for modular pieces that move easily and for privacy solutions that reduce noise. Companies also pay more for health-focused chairs and desks because they see these items as an investment in talent retention. That willingness to spend more up front works like insurance against staff turnover, turning furniture into a people-strategy tool rather than a simple capital expense. In short, the United States office furniture market now sits where workplace strategy, real-estate planning, and employee experience meet.
Key Report Takeaways
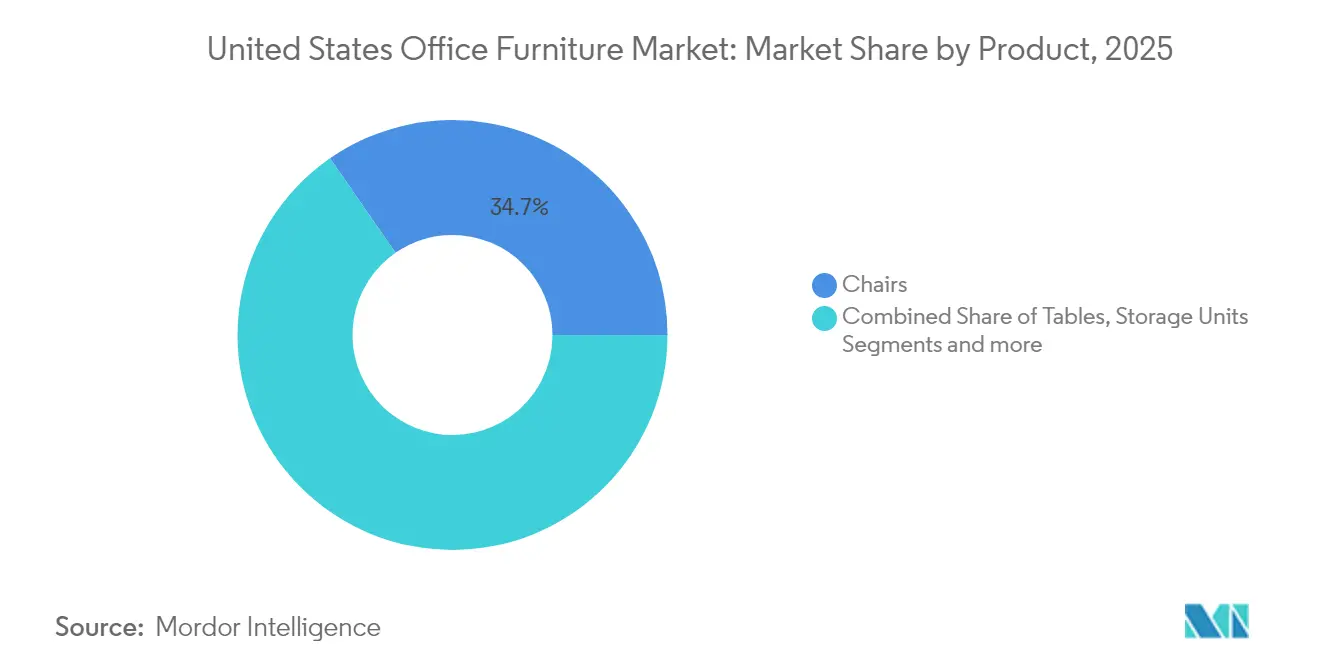
- By product, chairs hold the biggest 2025 product share at 34.65%, but privacy-focused booths and dividers are the breakout category, forecast to lead growth at 8.12 %CAGR through 2031.
- By material, wood remains the dominant material with a 44.55% share in 2025, yet plastic and polymer lines expand fastest at 7.28 % CAGR, thanks to recycled and bio-based blends.
- By price range, mid-range price points capture 54.40% of 2025 revenue, but premium pieces climb at 6.9% CAGR as employers pay extra for statement design and built-in tech.
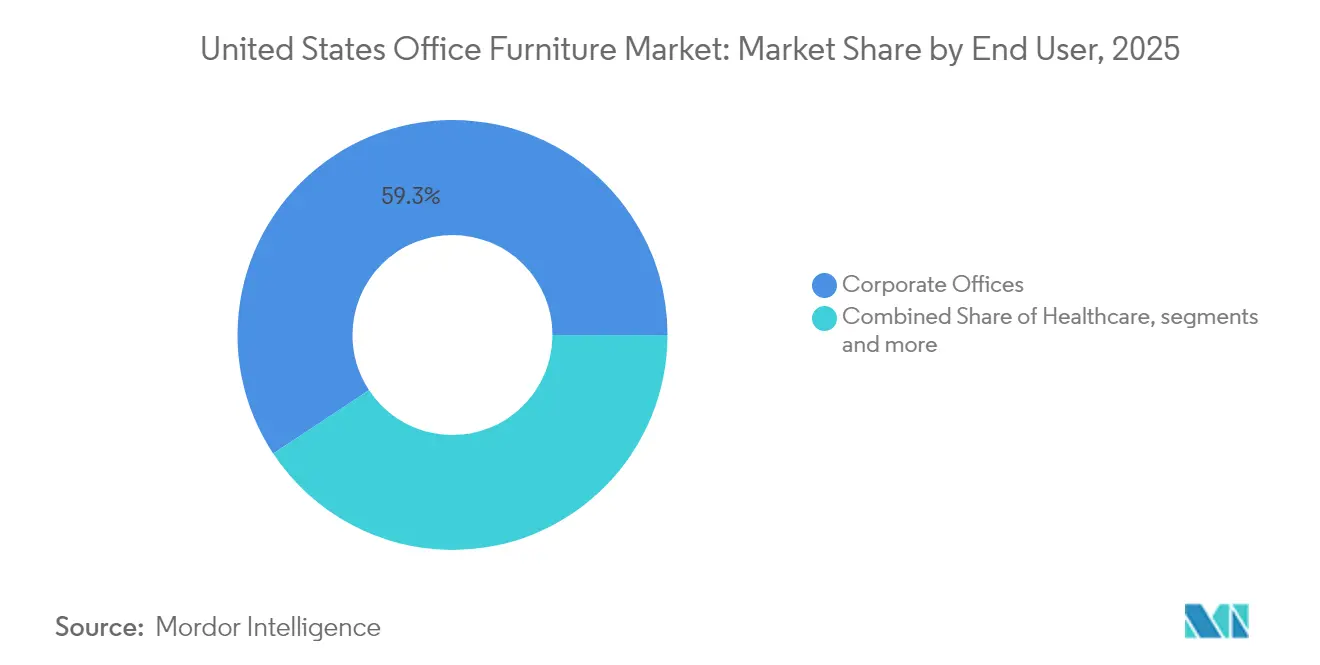
- By end-user, corporate offices account for 59.30% of end-user demand, while hospitality and retail back-office spaces rise at 8.05% CAGR as hotels and stores upgrade support areas.
- By distribution channel, traditional B2B direct sales command 74.20% share, though online channels grow quickest at 9.05% CAGR as buyers shift to self-serve digital portals.
- By geography, the Northeast is the single-largest demand center, holding 33.60% of United States office furniture sales in 2025, yet the West is on track to outpace every other region with a 6.92% CAGR through 2031.
Note: Market size and forecast figures in this report are generated using Mordor Intelligence’s proprietary estimation framework, updated with the latest available data and insights as of January 2026.
United States Office Furniture Market Trends and Insights
Drivers Impact Analysis
| Drivers | (~) % Impact on CAGR Forecast | Geographic Relevance | Impact Timeline |
|---|---|---|---|
| Hybrid work-led corporate renovations | +1.8% | Tech hubs nationwide | Medium term (3-4 yrs) |
| Ergonomic & health-focused design demand | +1.2% | Northeast, West Coast | Medium term (3-4 yrs) |
| Co-working chain expansion | +0.9% | Large urban centers in the South & West | Short term (≤2 yrs) |
| Commercial construction in the Sun Belt | +0.7% | Texas, Florida, Arizona | Medium term (3-4 yrs) |
| IoT-enabled smart desking adoption | +1.1% | Innovation clusters | Long term (≥5 yrs) |
| Source: Mordor Intelligence | |||
Hybrid Work Models Reviving Corporate Renovations
Investment in renovation is accelerating because U.S. workers prefer hybrid schedules, and employers are racing to create environments that justify commutes. Most U.S. adults still want at least some time in the office. In a Workforce Monitor® poll released in January 2024 by the American Staffing Association and The Harris Poll, 2,094 adults weighed in: 39 % said a hybrid mix of home and office would be ideal, 32 % leaned toward staying fully remote, and 29 % preferred being on-site every day [1]American Staffing Association, “Hybrid or In-Person Schedule,” American Staffing Association, americanstaffing.net. Companies are moving walls, adding acoustic booths, and shifting to benching solutions that can be rearranged overnight, highlighting the premium placed on flexibility. One outcome of this push is that fit-out spending per square meter has risen, even as many tenants are downsizing footprints, illustrating that quality is replacing quantity as the key decision variable. A fresh inference is that renovation spending is becoming less sensitive to floor-area metrics and more correlated with head-count retention goals, a mindset that bodes well for sustained furniture demand in high-performing labor markets.
Rising Demand for Ergonomic and Health-Focused Designs
Ergonomic seating, adjustable desks, and biophilic accents have graduated from optional perks to strategic imperatives as firms link well-being directly to output and retention. Premium ergonomic chairs command significant mark-ups because buyers view them as an insurance policy against musculoskeletal claims and absenteeism. Furniture incorporating natural materials and higher daylight penetration is proving to raise productivity by 15% and well-being by 20%, according to peer-reviewed design studies. This paragraph implies that health-centric products are turning what was a cost center into a quantifiable value driver, enabling suppliers to defend pricing power even in cost-sensitive negotiations.
Rapid Expansion of Co-working Chains Across the US
Co-working providers order furniture in bulk yet demand rapid lead times, causing domestic manufacturers to redesign supply chains around modular stock that can be finished just-in-time. Their preference for aesthetics that appeal to multiple demographics encourages the creation of neutral color palettes and durable surface treatments. An unexpected effect is that corporate buyers are copying co-working aesthetics, which means that trends validated in flexible offices quickly ripple into mainstream procurement. This migration indicates that co-working chains now serve as real-world laboratories for the United States office furniture industry, effectively crowd-sourcing new design standards.
Rise in Commercial Space Construction
Despite a 19% national vacancy rate in Q1 2024, selective new projects in the South and West proceed because tenants are relocating to business-friendly jurisdictions, bringing fresh furniture demand with them. Construction accounts for the majority of solid-wood consumption, meaning that building activity has an outsized influence on wood-based furniture orders. A counterintuitive inference is that high vacancy in legacy stock accelerates demand for new furniture because tenants vacate obsolete properties and target premium space equipped with the latest amenities. This dynamic amplifies the United States office furniture market growth in metros where “flight to quality” is most pronounced.
Restraints Impact Analysis
| Restraints | (~) % Impact on CAGR Forecast | Geographic Relevance | Impact Timeline |
|---|---|---|---|
| Lumber price volatility & higher tariffs | -1.2% | Wood-heavy production states | Short term (≤2 yrs) |
| Low-cost ASEAN import competition | -0.8% | Price-sensitive segments nationwide | Medium term (3-4 yrs) |
| Longer replacement cycles from ESG refurb policies | -0.6% | Cities with strict sustainability mandates | Long term (≥5 yrs) |
| Source: Mordor Intelligence | |||
Inflation-Driven Raw Material Price Volatility Compressing Margins
The lumber story is less upbeat. The U.S. Department of Commerce plans to more than double duties on Canadian softwood lumber, from about 14.5 % to roughly 34.5 % later this year once a final review is done [2]Florida Building Material Association, “Canada’s Lumber Tariff and Its Impact on U.S. Supply,” fbma.org.. Because Canada supplies eight out of every ten boards the U.S. imports and nearly a quarter of the nation’s overall lumber needs, higher tariffs are likely to ripple through construction costs. The National Association of Home Builders is already bracing for the increase [3]National Association of Home Builders, “Lumber Reciprocal Tariffs,” National Association of Home Builders, nahb.org. Manufacturers are responding with hedging contracts and diversified sourcing, but smaller firms lack the scale to absorb the shock, which could trigger consolidation waves. A telling inference is that larger vertically integrated players are set to gain United States office furniture market share because their procurement leverage transforms cost volatility into a barrier for new entrants.
Import Competition from Low-Cost ASEAN Manufacturers
Lower labor expenditures and modernized factories allow suppliers in Vietnam, Malaysia, and Indonesia to undercut domestic prices in the economy and mid-range categories. United States trade deficits in furniture surpassed, underscoring import penetration. Domestic firms stay competitive via customization, faster delivery, and sustainability certifications that resonate with ESG-minded buyers. The emergent insight is that “speed to floor” and eco-labelling now constitute defensible differentiators against purely price-driven imports.
Segment Analysis
Product Type: Privacy Solutions Drive Growth
The booths and office dividers sub-segment is forecast to expand at an 8.12% CAGR between 2026-2031, outpacing chairs, which hold the largest United States office furniture market share at 34.65% in 2025. Companies prioritize visual and acoustic privacy as hybrid policies put greater emphasis on in-office collaboration, making flexible partitions an essential purchase rather than an ancillary accessory. Fresh evidence suggests that investment in dividers is treated as a substitute for costly architectural renovations, demonstrating that product lines can cannibalize construction budgets. In parallel, chairs remain critical for individual ergonomics, and demand is further lifted by renewed corporate focus on musculoskeletal health.
Market size in height-adjustable tables is also expanding as employers reward employees with standing options, a shift that sees tables migrate from commodity status to wellness enabler. Storage units are integrating power outlets and IoT sensors to support security and mobile work, hinting that historically static products are becoming active components of digital office ecosystems. Sofas and soft seating grow steadily because firms want lounges that resemble residential spaces, a style proven to entice staff back. The other office furniture category, including reception counters and stools, benefits from the same aesthetic shift, suggesting a holistic design mindset that propels full-suite purchases rather than isolated items.
Note: Segment shares of all individual segments available upon report purchase
Get Detailed Market Forecasts at the Most Granular Levels
Download PDF
Material: Sustainability Reshapes Preferences
Wood commands a 44.55% United States office furniture market share in 2025, yet recycled and bio-based polymers are scheduled to grow at a 7.28% CAGR during 2026-2031. This pattern reflects an accelerated pivot toward circular materials that satisfy both compliance requirements and employee expectations. A meaningful inference is that polymer innovation is no longer limited to cost reduction; it is a reputational asset that employers leverage in talent branding. Metals, including lightweight alloys, help reduce freight emissions, indicating that material choice is intertwined with scope-three carbon accounting.
Composite materials combining glass, fabrics, and resins gain traction as designers look for differentiators that marry aesthetics with durability. MillerKnoll’s pledge to eliminate PFAS chemicals from its North American portfolio by May 2025 exemplifies how chemical safety is joining recyclability as a procurement criterion. Removing hazardous substances widens acceptable material options for healthcare and education clients that operate under strict guidelines. Consequently, suppliers achieving these compliance milestones can access segments previously dominated by niche players.
Price Range: Premium Segment Accelerates
The premium tier is projected to advance at a 6.9% CAGR through 2031, even though the mid-range holds 54.40% United States office furniture market share in 2025, proving that executives value differentiated design and embedded technology. Buyers adopt a “pay once, benefit daily” mentality, aligning capital expenses with productivity metrics that justify higher outlays. One inference is that premiumization is less cyclical than traditional furniture spending because it is tied to strategic transformation, not discretionary décor updates. Concurrently, the economic tier retains traction in education and government contracts where budget ceilings are rigid.
Manufacturers defend margins against raw-material inflation through dynamic pricing algorithms that track spot indices and adjust quotes accordingly. Premium buyers absorb such adjustments more readily because procurement criteria emphasize longevity and total cost of ownership. Mid-range vendors respond by offering modular upgrade paths, allowing clients to add smart features post-installation, thus blurring the boundary between tiers. This scenario suggests that price segmentation is evolving from static categories into a life-cycle continuum.
End-User: Hospitality Sector Emerges
Hospitality and retail back offices are expected to grow at an 8.05% CAGR from 2026-2031, reflecting brand expansion that relies on compact yet stylish administrative zones. Although corporate offices retain 59.30% United States office furniture market share in 2025, hotels and restaurants now demand furniture that doubles as décor and durable workspace, pushing suppliers to elevate design for non-corporate settings. A distinct takeaway is that office furniture aesthetics are permeating hospitality, confirming convergence across commercial interiors. Healthcare offices add niche growth anchored in infection-control features that command premium pricing.
Educational institutions allocate budgets to flexible learning hubs that mimic workplace collaboration zones, an investment driven by pedagogical shifts toward project-based learning. Government procurement remains significant thanks to GSA schedules that streamline large-volume orders and stabilize supplier cash flow. Non-profits and specialized facilities fall into the “others” bracket but often place bespoke orders that carry healthy margins due to customization. The hybrid-work narrative influences every end-user, ensuring that adaptability and well-being remain universal purchase triggers irrespective of vertical.
Note: Segment shares of all individual segments available upon report purchase
Get Detailed Market Forecasts at the Most Granular Levels
Download PDF
Distribution Channel: Digital Transformation Accelerates
Online channels in the B2C arena are forecast to rise at a 9.05% CAGR between 2026-2031, despite B2B/direct channels holding 74.20% United States office furniture market share in 2025. Procurement teams favor e-commerce platforms for their transparent pricing and rapid configuration tools, shortening decision cycles and compressing negotiation windows. A fresh observation is that online buying normalizes premium selections because algorithms surface higher-spec options alongside economy models, nudging buyers toward value-added features. Brick-and-mortar dealers emphasize tactile trials where buyers test chairs or view finishes in natural light.
Home centers and specialty stores adapt by offering showroom experiences coupled with digital quoting, an omnichannel play that mitigates return concerns associated with color variation or assembly complexity. Contract dealers and design firms, listed under other channels, continue to win turnkey projects that combine space planning, installation, and after-sales service. The resulting distribution landscape signals that digital convenience and human advisory are converging rather than competing, forming an ecosystem that keeps transaction friction low while preserving expert input.
Geography Analysis
The United States office furniture market exhibits distinct regional patterns, with the Northeast region commanding the largest market share at 33.60% in 2025, driven by sustained population migration, business relocations, and robust commercial construction activity. The Northeast maintains its significance as a premium market, particularly in financial and professional services sectors concentrated in urban centers like New York and Boston, where higher fit-out costs reflect a willingness to invest in quality furnishings.
Meanwhile, the West is projected to grow at 6.92% CAGR from 2026-2031, the fastest of any region. Technology clusters in California and Washington are upgrading space to lure staff back with advanced ergonomics, data-enabled desks, and higher sustainability standards, thereby lifting furniture spend per square foot. Venture-backed firms in Silicon Valley and Seattle often prioritize rapid, design-forward revamps, shortening replacement cycles despite smaller overall footprints. State and municipal green-building incentives further reinforce demand for recycled polymers and low-VOC finishes, giving Western buyers an outsized influence on future product specifications. The Midwest market is characterized by pragmatic purchasing decisions that emphasize durability and value, reflecting the region's manufacturing.
Competitive Landscape
The United States office furniture market is positioned as moderately concentrated yet open to niche challengers. MillerKnoll leads the revenue and leverages the combined design heritage of Herman Miller and Knoll. Its PFAS elimination pledge elevates sustainability to a brand promise and compels peers to accelerate chemical-safety roadmaps. The competitive inference is that environmental leadership is transitioning from compliance checkbox to value proposition, influencing contract awards in highly regulated industries.
HNI Corporation’s acquisition of Kimball International delivered operating-margin synergies that underscore the scale advantage derived from consolidation. However, regional specialists differentiate through rapid customization and short lead times, proving that agility offsets size in segments requiring bespoke solutions. Technology-centric startups offer smart furniture as a service, often via subscription, challenging incumbents to rethink ownership models. This tug-of-war implies a dynamic equilibrium in which both scale and specialization coexist, each carving out defensible niches within the United States office furniture industry.
Circular-economy pioneers such as NORNORM introduce subscription plans that decouple revenue from one-time sales, aligning furniture lifecycles with ESG goals. Their presence forces traditional manufacturers to deploy refurbishment programs, thereby broadening service portfolios. The battlefield is shifting from product differentiation alone to holistic workplace solutions encompassing analytics, maintenance, and sustainability services. As these ecosystems mature, companies that integrate design, digital, and circularity are poised to command pricing premiums and cement long-term client loyalty.
United States Office Furniture Industry Leaders
MillerKnoll, Inc.
Steelcase Inc.
Haworth Inc.
HNI Corporation
Teknion Group
- *Disclaimer: Major Players sorted in no particular order
Need More Details on Market Players and Competitors?
Download PDF
Recent Industry Developments
- May 2025: NORNORM expanded its subscription-based circular model across Europe. The move demonstrates the growing international appetite for rental furniture solutions that prioritize reuse.
- August 2024: Humanscale launched the first branded online store devoted to refurbished office furniture. The initiative positions the company as a leader in circular-economy practices while creating a new revenue stream focused on sustainability.
- July 2024: MOI acquired Harris Office Furniture. The deal strengthens MOI’s east-coast presence and follows sector-wide consolidation after the Herman Miller–Knoll merger.
Research Methodology Framework and Report Scope
Market Definitions and Key Coverage
Our study defines the United States office furniture market as revenue generated from new chairs, desks, workstations, tables, storage units, soft seating, screens, and ancillary accessories that are installed in commercial, institutional, and co-working workplaces across all fifty states. Revenue from installation services is counted; yet resale, refurbished, rental, and household-only pieces are excluded to keep the scope consistent with corporate capital-expenditure budgets.
Scope Exclusion: Residential furniture that occasionally doubles as a home-office desk or chair is out of scope.
Segmentation Overview
- By Product
- Chairs
- Employee Chairs
- Meeting Chairs
- Guest Chairs
- Tables
- Conference Tables
- Desks
- Other Tables
- Storage Units
- Filing Cabinets
- Bookcases & Shelving
- Sofas/Soft Seating
- Booths and Office Dividers
- Other Office Furniture (Stools, Reception Area Furniture, Accessories, Others)
- Chairs
- By Material
- Wood
- Metal
- Plastic & Polymer
- Other Materials
- By Price Range
- Economy
- Mid-range
- Premium
- By End-user
- Corporate Offices
- Healthcare Offices
- Educational Institutions
- Government & Public Offices
- Hospitality & Retail Back-office
- Others
- By Distribution Channel
- B2C/Retail
- Home Centers
- Specialty Furniture Stores
- Online
- Other Distribution Channels
- B2B/Directly from Manufacturers
- B2C/Retail
- By Geography
- Northeast
- Southeast
- Midwest
- Southwest
- West
Detailed Research Methodology and Data Validation
Primary Research
Our analysts interviewed workplace designers, facilities managers, regional dealers, and material suppliers across the Northeast, Midwest, Sun Belt, and Pacific clusters. These conversations validated utilization rates, average selling prices, and emerging preferences for height-adjustable systems; then filled data gaps left by public sources.
Desk Research
We began with federal data sets from the U.S. Census Bureau's Annual Survey of Manufactures, Bureau of Labor Statistics producer-price files, and the Energy Information Administration's Commercial Buildings Energy Consumption Survey. Trade flows were captured from U.S. International Trade Commission customs codes, while import partner splits were double-checked through Volza shipment logs. Industry viewpoints were drawn from BIFMA white papers, peer-reviewed ergonomics journals, and corporate 10-K filings. Subscription databases such as D&B Hoovers and Dow Jones Factiva enriched company revenue splits and plant capacities. The sources cited illustrate, not exhaust, the range mined for numbers and context.
A second sweep targeted regional construction permits, healthcare facility certifications, and state procurement portals, allowing us to benchmark furniture demand triggers that traditional statistics often miss. This layered reading ensured early anomaly detection before primary outreach began.
Market-Sizing & Forecasting
A top-down demand pool was built from corporate floorspace inventory and fit-out cycles, which are aligned with employment growth and vacancy trends. Select bottom-up checks, dealer sales roll-ups, and sampled ASP x volume for seating and benching refined the totals. Key model drivers include commercial starts, remote-work penetration, import share of metal frames, LEED-certified office completions, and BIFMA LEVEL certification uptake. Forecasts rely on multivariate regression mixed with scenario analysis so we can stress-test shifts in hybrid attendance or raw-material costs. Data gaps in sub-categories were bridged by ratio imputation anchored to verified company disclosures.
Data Validation & Update Cycle
Outputs pass two rounds of peer review; outlier flags trigger re-contact with experts, and every published figure is refreshed annually, with interim updates whenever material events alter the demand baseline.
Why Mordor's United States Office Furniture Baseline Commands Reliability
Published numbers vary because firms choose distinct product baskets, refresh cadences, and forecast horizons.
Key gap drivers include whether home-office goods are blended with corporate spend, if institutional segments such as education are folded in, the currency conversion year selected, and the cadence at which dealer price lists are refreshed.
Benchmark comparison
| Market Size | Anonymized source | Primary gap driver |
|---|---|---|
| USD 16.18 B (2025) | Mordor Intelligence | - |
| USD 16.64 B (2024) | Regional Consultancy A | Includes ready-to-assemble home desks and uses a one-year older price deck |
| USD 14.73 B (2023) | Industry Association B | Excludes soft seating and relies on shipment counts without ASP adjustment |
| USD 15.30 B (2024) | Global Consultancy C | Blends institutional furniture and applies constant 2022 exchange rates |
Differences shown above underline why clients trust the disciplined variable selection and annual refresh that Mordor Intelligence applies, giving decision-makers a balanced, transparent baseline they can retrace with ease.
Need A Different Region or Segment?
Customize Now
Key Questions Answered in the Report
What is the current size of the United States office furniture market?
The United States office furniture market size is USD 17.26 billion in 2026.
How fast is the market expected to grow?
The market is projected to rise to USD 23.87 billion by 2031, registering a CAGR of 6.71% from 2026 to 2031.
Which product segment is growing the fastest?
Booths and office dividers are forecast to expand at an 8.12% CAGR because companies seek acoustic and visual privacy in hybrid workspaces.
Why is the premium price segment gaining traction?
Employers view premium furniture as a tool for wellness, technology integration, and talent retention, making higher upfront costs acceptable under total-value reasoning.
How is sustainability shaping material choices?
Recycled and bio-based polymers, along with PFAS-free finishes, are gaining momentum as organizations align purchasing with ESG mandates.
What role does online distribution play?
Online channels are the fastest-growing distribution route, with a 9.05% CAGR, driven by transparent pricing, rapid configuration, and integration with digital procurement workflows.


