United States Spectator Sports Market Size and Share
Market Overview
| Study Period | 2021 - 2031 |
|---|---|
| Forecast Data Period | 2026 - 2031 |
| Historical Data Period | 2021 - 2024 |
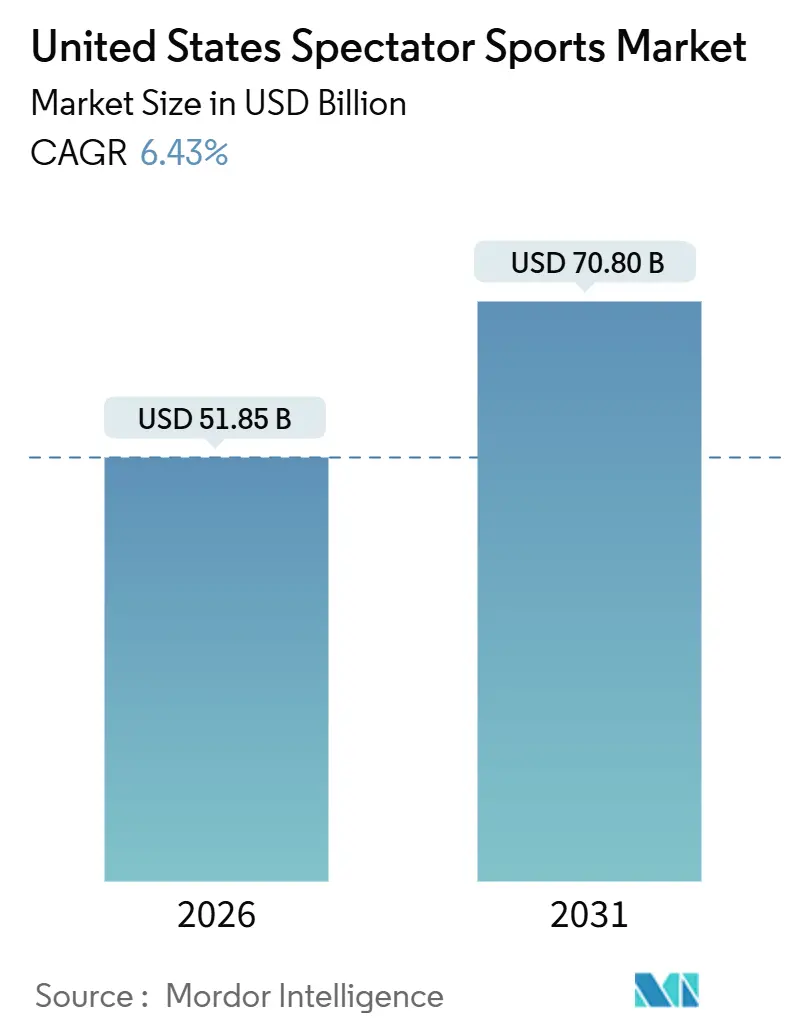
| Market Size (2026) | USD 51.85 Billion |
| Market Size (2031) | USD 70.80 Billion |
| Growth Rate (2026 - 2031) | 6.43% CAGR |
| Market Concentration | Medium |
Major Players *Disclaimer: Major Players sorted in no particular order Image © Mordor Intelligence. Reuse requires attribution under CC BY 4.0. | |
United States Spectator Sports Market Analysis by Mordor Intelligence
The United States spectator sports market reached a market size of USD 51.85 billion in 2026 and is projected to reach USD 70.8 billion by 2031 at a 6.43% CAGR. Momentum reflects an expanding sponsorship base and rising media rights values that reinforce premium placement for live sports in brand plans despite ongoing cord-cutting. Legalized sports betting and fantasy play add new monetization layers across advertising, data partnerships, and in-app wagering that deepen engagement loops around live events. Streaming-first distribution is elevating marquee properties as platforms compete for premium windows and shoulder programming that hold users inside subscription bundles. Large-scale venue projects and mixed-use districts expand non-gameday revenue, while venue technology upgrades support higher per-capita spend and smoother in-venue journeys that keep the United States spectator sports market on a stable growth path.
Key Report Takeaways
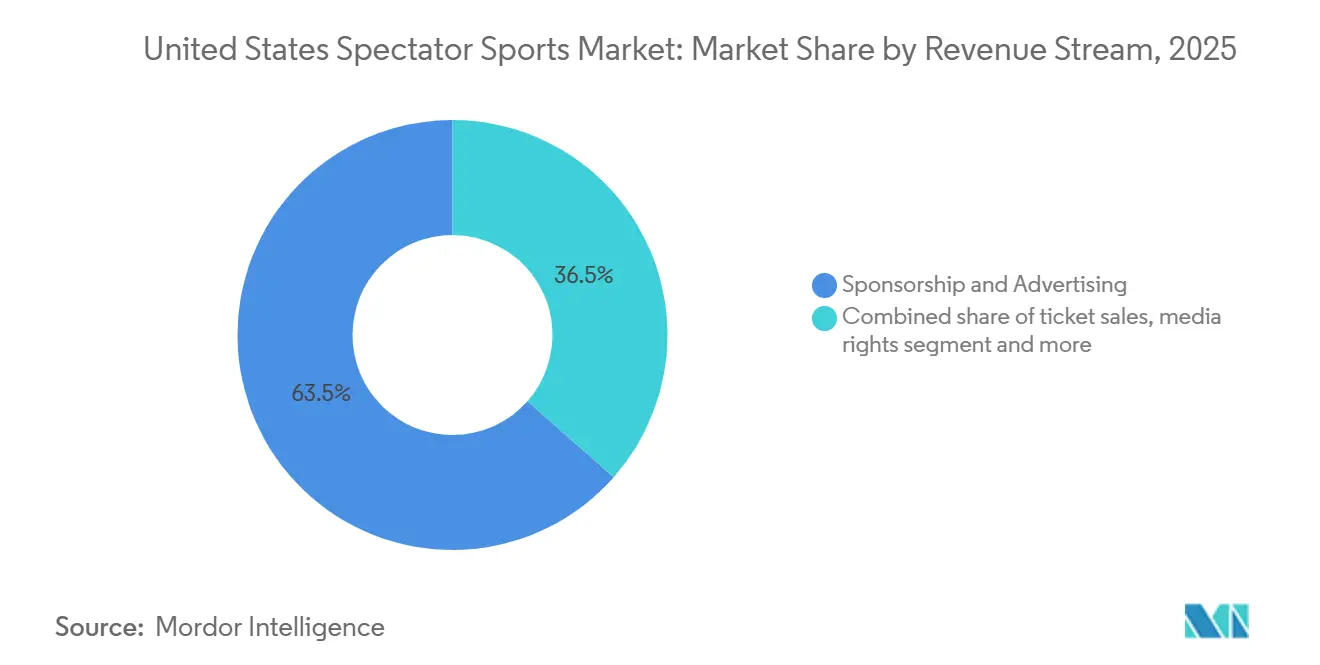
- By revenue stream, Sponsorship & Advertising held 63.50% revenue share of the United States spectator sports market size in 2025, while Merchandising & Licensing is projected to expand at a 7.84% CAGR through 2031.
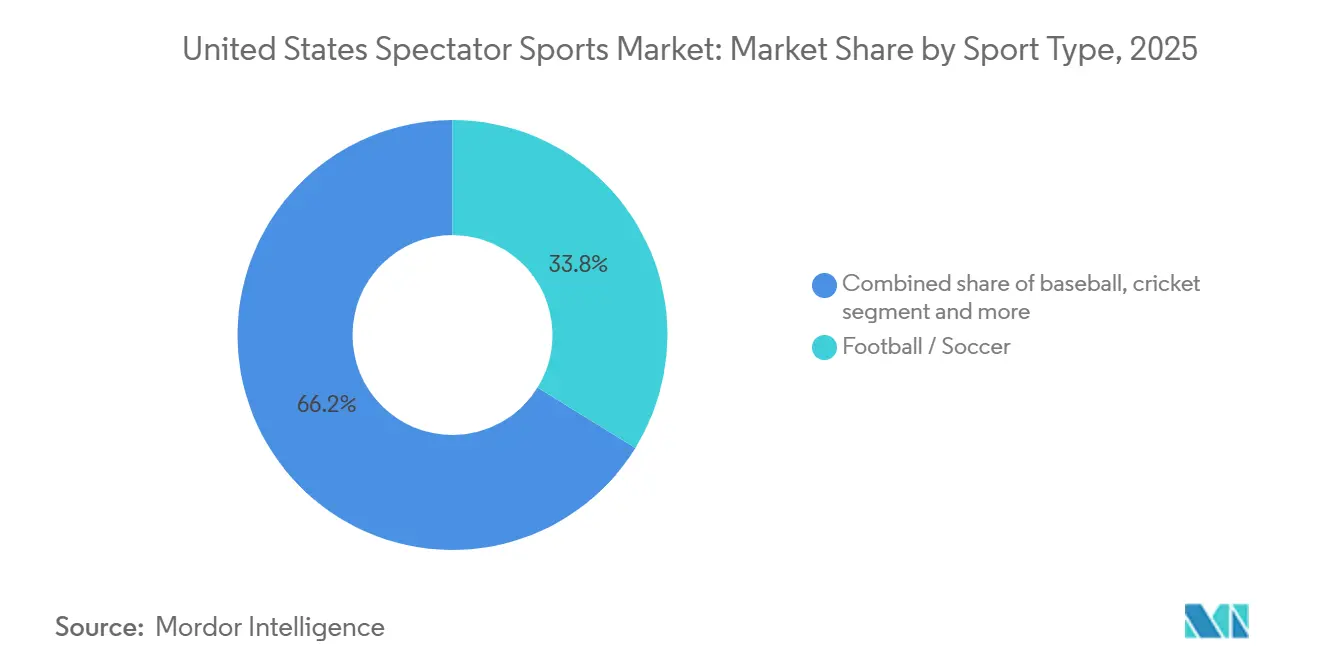
- By sport type, Football/Soccer captured 33.80% share of the United States spectator sports market size in 2025, and Motorsports is projected to post a 6.54% CAGR through 2031.
- Major leagues, including the NFL, NBA, MLB, NHL, and NCAA, dominate the United States spectator sports market, capturing media rights, sponsorship revenue, and fan attention, even as a myriad of smaller sports and events vie for recognition.
- Strategic ownership consolidation, international games, and overseas media distribution are expanding addressable audiences and sponsorship pools, strengthening long-term revenue visibility for leading United States spectator sports franchises.
Note: Market size and forecast figures in this report are generated using Mordor Intelligence’s proprietary estimation framework, updated with the latest available data and insights as of January 2026.
United States Spectator Sports Market Trends and Insights
Drivers Impact Analysis
| Driver | (~) % Impact on CAGR Forecast | Geographic Relevance | Impact Timeline |
|---|---|---|---|
| Increasing disposable incomes are boosting spending on tickets, merchandise, and events | +1.2% | Global, with the strongest gains in major metros (NY, LA, Chicago) | Medium term (2-4 years) |
| Advancements in streaming, VR/AR, and data analytics are enhancing fan engagement | +1.5% | National, with early adoption in tech-forward markets (SF Bay Area, Seattle) | Long term (≥ 4 years) |
| Growth in media rights agreements and corporate sponsorship revenues | +2.1% | National, spill-over to international markets via the Global Markets Program | Short term (≤ 2 years) |
| Rising adoption of fantasy sports, online betting, and digital platforms | +0.9% | National, concentrated in legalized betting states (25 states + DC as of 2025) | Medium term (2-4 years) |
| Expansion of sports tourism, esports, and women's leagues | +0.7% | National, with the strongest concentration in major metros and coastal markets | Long term (≥ 4 years) |
| Infrastructure upgrades and recovery in live events supporting attendance growth | +1.1% | National, acute in markets with new stadium development (Buffalo, Nashville, DC, Cleveland) | Medium term (2-4 years) |
| Source: Mordor Intelligence | |||
Increasing Disposable Incomes Boosting Spend on Tickets, Merchandise, and Events
Employment remains solid going into 2026, which supports household incomes and discretionary spending on tickets and live experiences that are core to the United States spectator sports market[1]U.S. Bureau of Labor Statistics, “The Employment Situation, December 2025,” U.S. Bureau of Labor Statistics, bls.gov.. Consumer outlays for sports and recreational goods and related services have held at elevated levels within personal consumption accounts, signaling ongoing demand for both in-venue and lifestyle sports products. As inflation moderates relative to 2023 peaks, teams and venues can tier price points and bundle benefits to sustain conversion without eroding premium pricing, a pattern that underpins steady attendance and merchandise flows in 2025 and 2026 for the market. Integrated retail and e-commerce fulfillment at arenas, along with licensed merchandise drops aligned to tentpole events, convert fan energy into higher attach rates on gameday and during key calendar moments. The breadth of live and digital touchpoints from leagues and teams broadens spend categories, including concessions, premium seating, licensed gear, and subscription services, which strengthens baseline growth across the market.
Advancements in Streaming, VR/AR, and Data Analytics Enhancing Fan Engagement
Streaming is pushing record reach for premium games, as platforms realize that exclusive windows drive subscriber acquisition and engagement, which raises content carry value for the United States spectator sports market. Nielsen recorded a historic month for broadcast and streaming in 2025, and the NFL’s streaming audience on Thursday night rose strongly, underscoring how digital access sustains national attention on live sports[2]Nielsen Editorial Team, “Broadcast and Streaming Serve Up a Historic Month of TV in Nielsen’s The Gauge,” Nielsen, nielsen.com.. Immersive venues such as Cosm, backed by an NBA partnership for nationally televised games, add a new shared-reality category that can capture fans who seek premium viewing without the full commitment of season tickets. Teams, rights holders, and sportsbooks are also using real-time data and analytics to personalize offers, enable micro-betting, and tune content feeds, which increases watch time and cross-sell rates in the United States spectator sports market. Together, these technology shifts support higher engagement per fan and open additive revenue lines across rights, subscriptions, sponsorship activation, and commerce.
Growth in Media Rights Agreements and Corporate Sponsorship Revenues
Media rights escalators remain the strongest short-cycle driver after the NBA’s 11-year USD 76 billion domestic deal with Disney, NBCUniversal, and Amazon, which resets benchmarks across windows and shoulder programming. The value of United States media rights continues to rise as streamers intensify competition, while analysts and executives highlight the prospect of further optimization within the NFL’s long-term contracts as early as 2026, a signal that the United States spectator sports market could unlock additional upside from renegotiations. Sponsorship and advertising remain the single largest revenue stream, accounting for 63.50% of the 2025 value, driven by the scarcity of live reach and the depth of activation inventory at league and team levels. Regulated gaming brands emerged as a core sponsor category in 2024 and 2025 on the back of expanding legal betting, which further inflates demand for premium in-game and on-premise integration in the[3]American Gaming Association Research Team, “State of the States 2025,” American Gaming Association, americangaming.org. . As multi-platform rights and brand partnerships scale, properties can invest in content extensions, local activations, and international initiatives that amplify the total lifetime value of each season’s media slate.
Rising Adoption of Fantasy Sports, Online Betting, and Digital Platforms
By late 2025, mobile sports betting will be legal across 25 states and Washington D.C., producing substantial cumulative revenue that funds both state programs and product innovation on the operator side. The commercial casino industry’s United States sports betting revenue grew 24.8% year over year, which created stronger sponsor cohorts and broadened data partnerships between rights holders and operators in the United States spectator sports market. DraftKings reported USD 4.77 billion in 2024 revenue and its first profitable year on an Adjusted EBITDA basis, which reflects improving unit economics for legal betting and a growing addressable audience across sports schedules. Integrations across streaming, team apps, and operator platforms enable live micro-betting and personalized offers that raise session frequency and deepen the relationship between watching and wagering. As more states debate legislation in 2026, the market is positioned to benefit from higher legal penetration that stabilizes sponsor demand and broadens fan monetization channels.
Restraints Impact Analysis
| Restraint | (~) % Impact on CAGR Forecast | Geographic Relevance | Impact Timeline |
|---|---|---|---|
| High ticket prices and escalating operational costs | -0.8% | National, acute in major markets with new stadium debt service | Short term (≤ 2 years) |
| Competition from alternative entertainment and streaming platforms | -0.6% | National, pronounced among Gen Z demographics | Long term (≥ 4 years) |
| Economic slowdowns are impacting discretionary consumer spending | -0.7% | National, more pronounced in price-sensitive and lower-income consumer segments | Short to Medium term (1–3 years) |
| Health, safety, player injury risks, and labor disputes | -0.5% | League-specific, higher impact in contact sports and unionized leagues | Medium to Long term (≥ 3 years) |
| Source: Mordor Intelligence | |||
High Ticket Prices and Escalating Operational Costs
Admission prices rose 13.5% from January 2023 to January 2024, and climbed an additional 6.5% through January 2025, which constrained discretionary budgets for younger fans and price-sensitive households. Venue operators face higher labor, energy, and security costs alongside rising debt service for new facilities, which tightens operating margins even as teams push for premiumization in the United States spectator sports market. Programming rights fees continue to escalate on the distribution side, with Disney’s domestic sports networks entering higher-cost windows that lift expenses faster than advertising growth in certain periods[4]The Walt Disney Company, “Form 10-K for the Fiscal Year Ended Sept. 28, 2024,” U.S. Securities and Exchange Commission, sec.gov.. In hockey, salary cap increases compound P&L pressure for smaller-market teams when ticketing growth lags, which forces more reliance on sponsorship uplifts and venue monetization to balance budgets. Although premium seating, clubs, and dynamic pricing help teams protect revenue, maintaining accessibility for families while serving premium demand is an ongoing trade-off in the market.
Competition from Alternative Entertainment and Streaming Platforms
Seven national partners carried NFL games in 2025, which reflects broad distribution but also diffuses attention across services as households weigh subscription stacks and time budgets. Audience habits are fragmenting into highlights, social clips, and short formats that compete with full-game viewing, a shift that requires properties to package content for multiple platforms without cannibalizing core windows in the United States spectator sports market. MLB’s regional media landscape remains fluid as RSN bankruptcies and direct-to-consumer pivots reshape local distribution strategies, which can suppress reach in the near term before new models re-aggregate audiences. Consumer trade-offs between gaming, creator content, and traditional live broadcasts intensify in peak seasons, making consistent cross-platform storytelling and community engagement critical to maintain share of attention. Rights holders are responding with tailored digital programming, flexible subscriptions, and unique venue experiences to defend frequency and duration in the United States spectator sports market.
Segment Analysis
By Revenue Stream: Sponsorship Sustains While Merchandising Surges
Sponsorship and advertising held 63.50% of the 2025 United States spectator sports market share as brands concentrated budgets on live inventory that delivers scarce reach and higher attention quality. Financial services, automotive, and alcohol remained anchor categories, while gaming and casinos increased their presence as regulated sports betting scaled nationwide in 2024 and 2025. Media rights continue to be powered by marquee renewals and new streaming windows, including the NBA’s 11-year USD 76 billion domestic package and expanding digital-only simulcasts that broaden reach across demographics in the United States spectator sports market. Ticket sales remain vital for game-day atmosphere and community engagement, although price inflation and fewer seats in some new builds create mix-management challenges for teams. Ancillary revenue lines, including concessions and parking, are being modernized with frictionless retail that boosts throughput and per-capita spend, which raises contribution from in-venue operations.
Merchandising and licensing is the fastest-growing stream with a 7.84% CAGR outlook through 2031, as teams and leagues expand direct-to-consumer channels, limited-edition drops, and player-driven programs that extend engagement beyond the arena or stadium, supporting the market. Operators are linking online and in-stadium fulfillment to shorten delivery windows and capture impulse demand during high-attention moments such as playoffs, opening day, and rivalry fixtures. Sponsorship activations are becoming more integrated with commerce and content, with brands using data from streaming, apps, and on-premise interactions to personalize offers and measure conversion, which sustains the largest revenue stream for the United States spectator sports market. Media rights upside remains tied to platform competition and marquee schedules, while ticketing strategies balance premium seating growth with accessible entry points for families and younger fans. The industry is also aligning brand partnerships with digital experiences and youth participation pathways, which strengthens long-term fan pipelines and licensed merchandise demand.
Note: Segment shares of all individual segments available upon report purchase
By Sport Type: Football Commands, Motorsports Accelerates
Football and soccer captured 33.80% of the 2025 United States spectator sports market share, anchored by the NFL’s scale and the continued expansion of MLS, as the NFL generated more than USD 23 billion in revenue and soccer positioned for a World Cup uplift. The NFL’s long-term rights agreements with broadcast and streaming partners lock in national reach while preserving optionality around opt-outs and global initiatives, which consolidates leadership in the United States spectator sports market. MLS raised expansion fees in recent years and is benefiting from international star power, new venues, and a global streaming structure that elevates discoverability ahead of 2026. The United States spectator sports market size for motorsports is projected to expand at a 6.54% CAGR through 2031 as NASCAR, Formula 1, and other series lean into split-rights models and digital engagement to reach younger cord-cutting audiences. Streaming-first events and new formats, such as street circuits and sprint races, help motorsports grow outside legacy markets and unlock fresh sponsorship categories.
Basketball remains a top revenue engine as the NBA’s new domestic media pact lifts annual rights income and raises visibility across multiple platforms that serve different viewers with tailored coverage. The WNBA’s expansion and 2024 audience growth point to a widening fan base that supports national partners, local sponsors, and licensed merchandise in the market. Baseball is navigating a restructuring of regional media, with direct-to-consumer experiments and new national arrangements designed to stabilize reach and rebuild local monetization in key markets. Tennis, golf, and other sports continue to command premium event windows, and 2026 is poised to benefit from World Cup scheduling that adds incremental demand around official broadcast windows and sponsor activations in the United States spectator sports market. Across sports, data-informed content, flexible ticketing, and integrated sponsorships keep engagement diverse and resilient across demographic cohorts.
Geography Analysis
Major markets in the United States concentrate the largest audiences and corporate spend, while expanding legalized betting across 25 states, plus Washington D.C., adds fresh engagement and tax revenue streams that support growth in the United States spectator sports market. New York alone generated USD 7.45 billion in revenue and USD 3.79 billion in tax receipts since launch, demonstrating the scale of spend in high-population states with full mobile access. National streaming reach and multi-partner distribution kept the NFL’s regular season at historic viewership levels in 2025, which spreads attention across urban and suburban geographies for the United States spectator sports market. League and operator partnerships tie localized offers, watch parties, and retail activations to marquee events, building regional depth that complements national schedules.
Infrastructure spending patterns diverge across metros, with smaller or mid-sized markets relying more on public funding while large coastal cities lean on private capital, reflecting differences in commercial leverage and media market depth. Washington D.C. advanced a USD 3.8 billion redevelopment of the RFK site for the Commanders, while Ohio cleared permitting for a new domed stadium for the Browns near Cleveland Hopkins International Airport, anchoring mixed-use plans that boost non-gameday flows in the market. Tennessee’s new stadium integrates frictionless checkout across dozens of points of sale to improve throughput and raise concession revenue, a playbook that other markets intend to follow. Oklahoma City’s new arena for the Thunder, with more than 90% public funding, shows how civic priorities vary by market size and economic base within the United States spectator sports market.
International events create geographic catalysts in 2026 as the FIFA World Cup schedules 11 United States host venues, stimulating travel, hospitality, and local sponsorship that radiates regionally beyond match days. MLB teams and city partners are also expanding mixed-use amenity sets that convert foot traffic from ballparks into year-round economic activity, which supports tax bases and venue reinvestment. Meanwhile, MLB’s local media realignment is playing out differently by geography, as some clubs move to over-the-air and direct-to-consumer offerings while others retain RSN structures, creating a patchwork approach to reach and revenue in the United States spectator sports market. Across regions, immersive venues and community programming provide new gathering points for fans who may not attend games in person but still want shared, high-quality viewing experiences.
Competitive Landscape
Top properties retain long-term media partnerships that secure distribution and financial visibility, as seen in the NBA’s 11-year domestic pact and the NFL’s multi-partner arrangements that extend into the 2030s for the US spectator sports market. These contracts embed options and protections that balance revenue certainty for leagues with strategic latitude to adjust windows and formats as consumption evolves. Streaming-first rights, such as exclusive nights and expanded simulcasts, have become a competitive lever for platforms and are now a central element of rights renewals that shape the market. In parallel, sponsorship remains the largest revenue stream, underscoring the importance of category diversification and activation innovation to defend growth.
Strategic moves by rights owners and operators are reshaping distribution and monetization. The NBA’s tri-party alignment with Disney, NBCUniversal, and Amazon reflects a pivot toward a hybrid broadcast-plus-streaming model that ensures national reach and digital depth for the United States spectator sports market. TKO Group secured a seven-year, USD 7.7 billion exclusive with Paramount for UFC domestic rights starting in 2026 and a five-year WWE premium live events pact with ESPN, illustrating a bundled subscription posture over transactional models. MLS’s global streaming package continues to integrate content, community, and commerce, and the league’s venue pipeline and team-led developments expand local economies within the market.
Capital reallocation is active across gaming and media ecosystems adjacent to sports. Boyd Gaming sold its 5% FanDuel equity stake to Flutter for USD 1.755 billion, which simplifies the cap table and signals continued investor appetite for scaled sports betting platforms engaged in the United States spectator sports market. Disney consolidated Hulu ownership in 2025 and restructured streaming assets, moves that embed sports within broader entertainment bundles to sustain time spent and advertising yield. New venue formats such as Cosm, backed by an NBA partnership for national games, add a differentiated shared-reality layer that properties can use for experiential depth and incremental ticketing while protecting the core live event in the United States spectator sports market.
United States Spectator Sports Industry Leaders
National Football League (NFL)
Major League Baseball (MLB)
National Basketball Association (NBA)
National Hockey League (NHL)
Major League Soccer (MLS)
- *Disclaimer: Major Players sorted in no particular order
Recent Industry Developments
- October 2025: ESPN and Disney finalized a deal with fuboTV, merging Hulu Live TV assets into fuboTV and giving Disney a 70% controlling stake. Disney, FOX, and Warner Bros. Discovery settled Fubo's antitrust claims for USD 220 million, resolving litigation from the proposed Venu Sports joint venture.
- December 2025: The WNBA planned to expand to 18 teams by 2030, granting franchises to Cleveland, Detroit, and Philadelphia. The league reported significant momentum, with 2024 attendance increasing 48% to 9,807 fans per game and viewership growing 170% year-over-year
- October 2025: The NFL and Cosm have partnered through 2030 to deliver live NBA and NFL games in immersive, shared-reality venues. Cosm operates domed theaters in Los Angeles and Dallas, with new locations planned in Atlanta, Detroit, and Cleveland by 2027, offering unique viewing angles like behind-the-bench and under-the-rim perspectives
- September 2025: Washington Commanders received D.C. City Council approval to return to the RFK Stadium site, advancing a USD 3.8 billion redevelopment project with a 2030 opening and 65,000-seat capacity. The team committed over USD 2.7 billion, with surrounding land planned for housing and retail development.
United States Spectator Sports Market Report Scope
A spectator sport is one in which spectators, or observers, attend matches such as American football, association football, baseball, basketball, field hockey, Formula 1, ice hockey, rugby league, rugby union, team handball, and volleyball.
The United States spectator sports market is segmented by revenue stream (ticket sales, media rights, sponsorship & advertising, merchandising & licensing, other ancillary revenues) and sport type (football/soccer, basketball, baseball, cricket, motorsports, tennis, golf, other sports). Market forecasts are provided in value terms (USD).
| Ticket Sales |
| Media Rights |
| Sponsorship & Advertising |
| Merchandising & Licensing |
| Other Ancillary Revenues |
| Football / Soccer |
| Basketball |
| Baseball |
| Cricket |
| Motorsports |
| Tennis |
| Golf |
| Other Sports |
| By Revenue Stream | Ticket Sales |
| Media Rights | |
| Sponsorship & Advertising | |
| Merchandising & Licensing | |
| Other Ancillary Revenues | |
| By Sport Type | Football / Soccer |
| Basketball | |
| Baseball | |
| Cricket | |
| Motorsports | |
| Tennis | |
| Golf | |
| Other Sports |
Key Questions Answered in the Report
What is the size and growth outlook for the US spectator sports market by 2031
The United States spectator sports market reached USD 51.85 billion in 2026 and is projected to hit USD 70.8 billion by 2031, reflecting a 6.43% CAGR that is supported by rising media rights values, strong sponsorship demand, and venue modernization.
Which revenue stream contributes the most to the US spectator sports market
Sponsorship and advertising are the largest stream, accounting for 63.50% in 2025, as brands prioritize the scarce reach of live sports and multi-platform activation opportunities.
Which sport leads and which segment is growing the fastest in the United States spectator sports market
Football and soccer together lead with 33.80% share in 2025, while motorsports shows the fastest growth pace with a projected 6.54% CAGR through 2031 on the back of split-rights models and digital engagement.
How are streaming and immersive technologies changing fan engagement in the United States spectator sports market
Exclusive streaming windows are lifting audience reach, and shared-reality venues like Cosm backed by NBA partnerships, add premium group experiences, while data analytics enable micro-betting and personalized content that keep fans engaged.
What role does legalized sports betting play in United States spectator sports
Legal betting generated USD 13.78 billion in 2025 revenue for the commercial sector and is live in 25 states plus D.C., which strengthens sponsorship demand and integrates interactive features that increase watch time and engagement.
Which recent developments are most likely to shape the United States spectator sports market in 2026
The NBA’s long-term media deals, TKO’s UFC and WWE rights pacts, Disney’s streaming asset consolidation, mixed-use stadium projects, and the 2026 FIFA World Cup are the most consequential dynamics for growth and distribution.


