
| Study Period | 2018 - 2030 |
| Base Year For Estimation | 2024 |
| Forecast Data Period | 2025 - 2030 |
| Market Size (2025) | USD 5.7 Billion |
| Market Size (2030) | USD 7.23 Billion |
| CAGR (2025 - 2030) | 4.88 % |
| Market Concentration | High |
Major Players*Disclaimer: Major Players sorted in no particular order |


US Ready to Drink Coffee Market Analysis
The US Ready to Drink Coffee Market size is estimated at 5.7 billion USD in 2025, and is expected to reach 7.23 billion USD by 2030, growing at a CAGR of 4.88% during the forecast period (2025-2030).
The US Ready-to-Drink (RTD) coffee market continues to evolve, driven by shifting consumer preferences and lifestyle changes. In 2022, a remarkable 87% of US consumers identified themselves as having a strong affinity for coffee, highlighting the beverage's integral role in American culture. The 19-29 age demographic has emerged as a particularly influential consumer segment, with the West Coast leading in gourmet coffee consumption. Regional preferences vary significantly, with cold brew being nearly 50% more prevalent on the West Coast compared to the South, while Southerners demonstrate a 25% higher preference for frozen blended coffee than Northeasterners.
The retail landscape for RTD coffee has undergone significant transformation, adapting to modern consumer shopping habits. With 311.3 million internet users in 2023, representing 92% of the total population, digital commerce has become increasingly important for RTD coffee sales. This shift is evidenced by the fact that 68 million US households engaged in online shopping through various modes including delivery, pickup, or shipping-to-home in 2022. The convenience factor has become paramount, with 55% of consumers preferring drive-thru options in 2023, leading major chains to adapt their service models accordingly.
Health consciousness and product innovation are reshaping the industry's trajectory. In 2022, 92% of coffee lovers in the United States emphasized the importance of coffee's health benefits, driving manufacturers to develop products with functional ingredients and clean labels. The market has witnessed a surge in products featuring natural ingredients, reduced sugar content, and added functional benefits such as collagen, electrolytes, and adaptogens. Premium and specialty offerings have gained prominence, with manufacturers focusing on unique flavor profiles and sustainable sourcing practices.
The competitive landscape has intensified with the expansion of retail presence and distribution networks. As of 2023, the United States boasted 40,000 branded coffee shop outlets, with 23% of consumers frequenting coffee shops daily. Major chains are actively expanding their footprint, with companies like Scooter's Coffee and Dutch Bros demonstrating aggressive growth by opening 224 and 167 net new stores respectively in 2023. This expansion has been accompanied by innovations in packaging and service delivery, with retailers implementing advanced temperature control systems and sustainable packaging solutions to enhance product quality and meet environmental concerns.
US Ready to Drink Coffee Market Trends
The ease of consumption is the key factor driving the increasing sales of RTD coffee in the market
- RTD coffee consumption in the United States is majorly consumed by the young generation. In 2022, Gen Z coffee drinkers preferred cold coffee over hot coffee and lean to bottled or canned over brewing their own.
- The flavor is one of the most significant attributes when it comes to buying RTD coffee. Some of the popular RTD coffee flavors include vanilla, mocha, caramel, hazelnut, and others.
- Consumers in the country majorly prefer to buy RTD coffee in many retail stores, and cafes of coffee shops for lower prices. In 2022, 54% of consumers in the United States paid for coffee from cafes or coffee shops.
- Coffee contains a variety of compounds, including antioxidants and polyphenols, which have been linked to potential protective effects against chronic diseases such as cardiovascular disease, type 2 diabetes, and certain types of cancer.
Understand The Key Trends Shaping This Market
Download PDF
OTHER KEY INDUSTRY TRENDS COVERED IN THE REPORT
- Companies are incorporating functional ingredients which offer health and wellness benefits beyond caffeine
- Starbucks's ability to create a premium coffeehouse experience that transcends the traditional notion of coffee consumption and establishes itself as a lifestyle brand
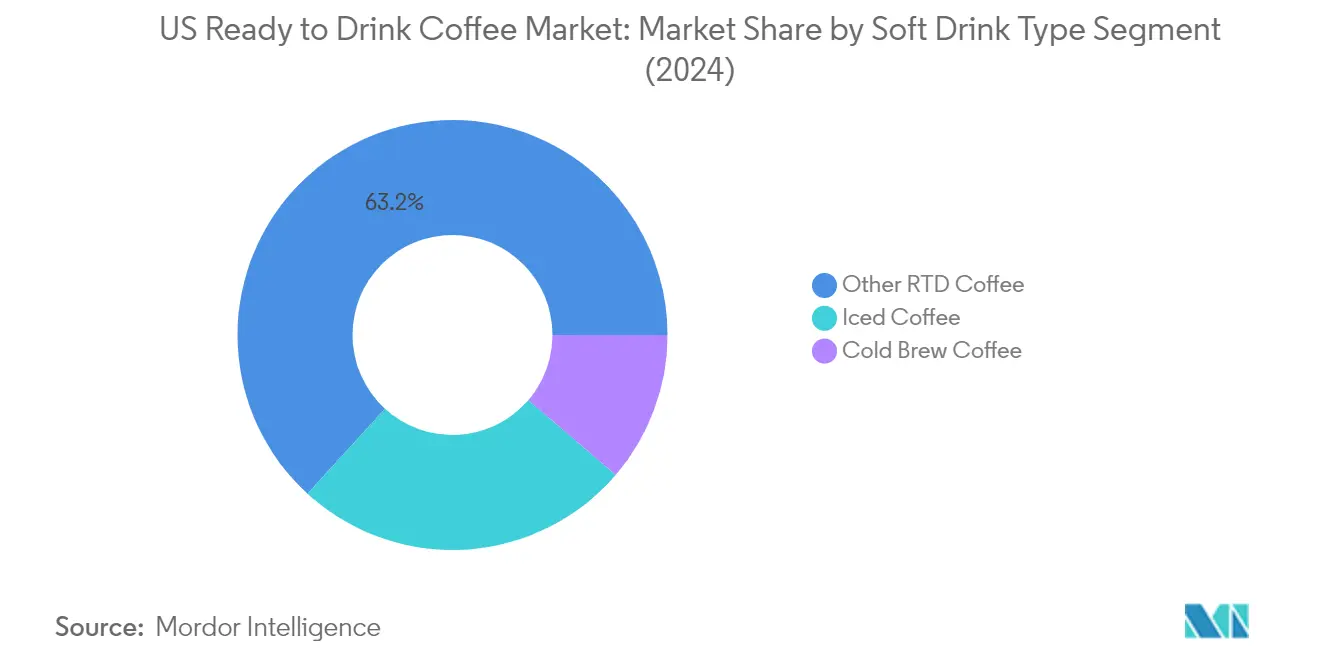
Segment Analysis: Soft Drink Type
Other RTD Coffee Segment in US Ready to Drink Coffee Market
The Other RTD Coffee segment, which includes innovative variants like guarana, acai berry, ginseng, taurine, and protein-fortified beverages, dominates the US ready-to-drink coffee market with approximately 63% market share in 2024. This segment's prominence is driven by increasing consumer awareness of the health benefits associated with these enhanced coffee beverages. The segment has gained significant traction particularly among health-conscious consumers who are seeking RTD coffee with added functional ingredients like collagen, which aids in preventing age-related bone loss. Additionally, the rising popularity of RTD coffee with electrolytes has contributed to the segment's dominance, as these products offer both refreshment and hydration benefits while maintaining low caloric content, typically around 15 calories per serving.
Cold Brew Coffee Segment in US Ready to Drink Coffee Market
The cold brew coffee market is experiencing remarkable growth in the US RTD coffee market, with a projected CAGR of approximately 6% during 2024-2029. This growth is primarily attributed to shifting consumer preferences from traditional hot beverages to more refreshing cold options. The segment's expansion is further fueled by its smoother, sweeter, and less acidic profile, which particularly appeals to millennial consumers seeking healthier alternatives to sodas and artificially sweetened drinks. Manufacturers are actively innovating within this space, with notable developments including nitrogen-infused cold brews stored in kegs and served on draft, creating a unique drinking experience with a foamy head and creamy texture. The customization potential of cold brew coffee, allowing for various sweeteners, milk options, and flavor additions, continues to drive its growing popularity across diverse consumer demographics.
Remaining Segments in Soft Drink Type
The Iced Coffee segment represents a significant portion of the US ready-to-drink coffee market, offering a diverse range of flavors including iced coffee macchiato, iced coffee mocha, and iced espresso. This segment has maintained its strong market position through continuous innovation in unsweetened variants and sugar-free options, particularly appealing to health-conscious consumers and those managing diabetes. The segment's success is further supported by strategic pricing strategies and widespread availability across various retail channels, making it accessible to a broad consumer base. The versatility of iced coffee products, combined with their refreshing qualities and the wide array of flavors available nationwide, continues to make this segment a crucial component of the overall RTD coffee market.
Segment Analysis: Packaging Type
Glass Bottles Segment in US RTD Coffee Market
Glass bottles have emerged as the dominant packaging format in the US ready-to-drink coffee market, commanding approximately 40% of the market share in 2024. This leadership position can be attributed to glass packaging's premium image and superior product preservation capabilities. Glass bottles are particularly favored for their ability to maintain the flavor integrity and freshness of coffee products, as they are impermeable to oxygen and do not interact with the beverage contents. Major brands like Starbucks, Dunkin' Donuts, and International Delight have embraced glass bottles as their preferred packaging choice, reinforcing consumer trust in this format. The segment's popularity is further bolstered by growing environmental consciousness among US consumers, with studies showing that 70% of consumers prefer glass for preserving beverage flavors.
Aseptic Packages Segment in US RTD Coffee Market
The aseptic packaging segment is demonstrating remarkable momentum in the US RTD coffee market, projected to achieve approximately 5% growth annually from 2024 to 2029. This accelerated growth is driven by several key advantages, including extended shelf life without refrigeration and significant cost efficiencies in shipping and storage. The segment's expansion is further supported by strong consumer preference, with about 57% of US consumers favoring aseptic packaging for online beverage deliveries. The format's appeal is enhanced by its environmental credentials, with consumers particularly valuing its recyclability, compostability, and incorporation of recycled content. The elimination of preservative requirements in aseptic packaging aligns perfectly with the growing clean-label trend in the RTD coffee market.
Remaining Segments in Packaging Type
Metal cans and PET bottles constitute significant segments in the US RTD coffee packaging landscape. Metal cans have established themselves as a reliable packaging solution, particularly valued for their portability and excellent temperature retention properties. The segment benefits from aluminum's superior recyclability and its ability to maintain product freshness. PET bottles, meanwhile, have gained traction due to their convenience and customization potential, offering manufacturers flexibility in design and sizing options. Both formats continue to evolve with technological advancements, addressing consumer demands for sustainability and convenience while maintaining product quality and shelf life.
Segment Analysis: Distribution Channel
Supermarket/Hypermarket Segment in US RTD Coffee Market
Supermarkets and hypermarkets continue to dominate the RTD coffee market distribution landscape in the United States, commanding approximately 47% of the total market value in 2024. This commanding position is attributed to their extensive retail network and strategic product placement, with RTD coffee beverages prominently displayed in high-traffic areas such as entrances, checkout lines, and dedicated beverage sections. Major retail chains like Walmart, with its 4,632 stores nationwide, and Kroger, operating 1,237 locations, offer a comprehensive range of RTD coffee options spanning various flavors, sizes, and brands including Nescafe, Starbucks, Dunkin' Donuts, and Costa. These retailers have successfully implemented competitive pricing strategies, with RTD coffee products ranging from $2.64 to $8.35, catering to diverse consumer preferences and budgets. Additionally, their ability to offer seasonal promotions, bulk purchase discounts, and loyalty programs has strengthened their position as the preferred destination for RTD coffee purchases.
Specialty Stores Segment in US RTD Coffee Market
Specialty stores are experiencing remarkable growth in the RTD coffee market, with a projected growth rate of approximately 5% during 2024-2029. This growth is driven by their unique positioning and focus on premium RTD coffee offerings. Leading specialty retailers like Starbucks, Illy Caffe, Blue Bottle, and Costa Coffee have established a strong market presence by offering exclusive RTD coffee varieties and innovative packaging formats. These stores have enhanced their appeal by providing complementary products alongside RTD coffee, including juices, snacks, and various carbonated beverages, creating a comprehensive beverage retail experience. The success of emerging brands like La Colombe, which began as a high-end specialty coffee shop in Philadelphia, along with Super Coffee and Califia Farms, demonstrates the segment's potential for continued expansion. Furthermore, specialty stores are differentiating themselves through expert product knowledge, customized recommendations, and creating unique shopping experiences that resonate with discerning coffee consumers.
Remaining Segments in Distribution Channel
The RTD coffee market's distribution landscape is further diversified through several other significant channels. Convenience stores serve as crucial points of sale, particularly benefiting from their strategic locations at gas stations, highway stops, and transport hubs. The online retail segment has gained prominence through major e-commerce platforms and direct-to-consumer sales, offering convenience and a wide product selection. On-trade channels, including cafes, restaurants, and food service establishments, play a vital role in reaching consumers through immediate consumption opportunities. The market is also served through other channels such as vending machines, discount stores, and wholesale establishments, each catering to specific consumer preferences and shopping patterns. These diverse distribution channels collectively ensure comprehensive market coverage and accessibility of RTD coffee products across different consumer segments and occasions.
US Ready to Drink Coffee Industry Overview
Top Companies in US Ready to Drink Coffee Market
The ready-to-drink coffee brands market in the United States is characterized by continuous product innovation and strategic expansion initiatives by major players. Companies are focusing on developing unique flavors, incorporating plant-based alternatives, and introducing premium offerings to cater to evolving consumer preferences. Operational agility is demonstrated through investments in production capacity enhancement and the adoption of sustainable packaging solutions. Strategic partnerships, particularly between beverage manufacturers and coffee chains, have become increasingly common to leverage brand recognition and distribution networks. Companies are also expanding their presence through acquisitions and joint ventures, while simultaneously investing in research and development to create differentiated products. The emphasis on digital transformation and direct-to-consumer channels has further strengthened market positions, with companies developing omnichannel strategies to reach consumers effectively.
Consolidated Market Led By Global Players
The US RTD coffee market exhibits a high level of consolidation, dominated by global beverage conglomerates with established distribution networks and strong brand portfolios. These major players leverage their extensive resources, manufacturing capabilities, and marketing expertise to maintain market leadership. The competitive landscape is characterized by a mix of traditional beverage companies and specialized coffee brands, with global giants like PepsiCo, Danone, and Coca-Cola maintaining significant market presence through strategic partnerships and brand acquisitions. The market also features specialty coffee players who focus on premium offerings and innovative formulations to carve out their niche.
The industry has witnessed significant merger and acquisition activity, particularly involving larger companies acquiring smaller, innovative brands to expand their product portfolios and reach new consumer segments. These acquisitions have primarily targeted companies with strong positions in premium and specialty segments, as well as those with innovative product formulations or sustainable practices. The trend of strategic partnerships between established beverage companies and coffee chains has reshaped the competitive landscape, creating powerful combinations of brand strength and distribution capability. The RTD coffee market share is significantly influenced by these strategic moves, allowing companies to consolidate their positions.
Innovation and Sustainability Drive Future Success
For incumbent players to maintain and expand their US coffee market share, a focus on product innovation, sustainability initiatives, and digital transformation will be crucial. Companies need to continuously develop new flavors and formulations while investing in sustainable packaging solutions and responsible sourcing practices. Building strong direct-to-consumer relationships through digital platforms and expanding distribution networks through strategic partnerships will be essential. Additionally, maintaining operational efficiency through technology adoption and supply chain optimization will help companies respond quickly to changing market dynamics and consumer preferences.
New entrants and challenger brands can gain ground by focusing on specialized market segments and innovative product offerings. Success factors include developing unique value propositions through premium ingredients, functional benefits, or sustainable practices. Companies must also consider potential regulatory changes regarding packaging materials and labeling requirements, while addressing the growing consumer demand for transparency in sourcing and production processes. Building strong relationships with retailers and investing in marketing initiatives to build brand awareness will be crucial for market success. The ability to adapt to changing consumer preferences and maintain product quality while scaling operations will determine long-term success in this competitive market. The emergence of private label ready-to-drink coffee options also presents opportunities for differentiation and capturing niche segments.
US Ready to Drink Coffee Market Leaders
-
Califia Farms, LLC
-
Danone S.A.
-
Keurig Dr Pepper, Inc.
-
PepsiCo, Inc.
-
The Coca-Cola Company
- *Disclaimer: Major Players sorted in no particular order

Need More Details on Market Players and Competiters?
Download PDF
US Ready to Drink Coffee Market News
- July 2023: Keurig Dr. Pepper Inc. announced a strategic partnership with La Colombe, including a long-term sales and distribution agreement for La Colombe's ready-to-drink coffee. Keurig Dr Pepper will also make an equity investment in La Colombe, enabling KDP to participate in the value creation upside expected from the partnership.
- April 2023: Chamberlain Coffee, in collaboration with Walmart, rolled out a new line of plant-based cold brew lattes, ready to drink (RTD) and conveniently available at Walmart stores.
- February 2023: Danone North America planned to invest up to USD 65 million over the next two years to increase ready-to-drink (RTD) coffee and creamer and oat milk production in the US. The investment will cover several of Danone's coffee brands, including coffee creamer International Delight, oat milk brand Silk, and cold brew range SToK.
Free With This Report
We provide a comprehensive and exhaustive set of data pointers for global, regional, and country-level metrics that illustrate the fundamentals of the soft drinks industry. With the help of 45+ free charts, clients can access in-depth market analysis based on price trend analysis of per capita spending on various soft drinks, through granular-level segmental information supported by a repository of market data, trends, and expert analysis. Data and analysis on soft drink category, packaging type, distribution channel insights into consumer preferences and purchasing patterns, an overview of key market players, etc., are available in the form of comprehensive reports as well as excel-based data worksheets.


US Ready to Drink Coffee Market Report - Table of Contents
1. EXECUTIVE SUMMARY & KEY FINDINGS
2. REPORT OFFERS
3. INTRODUCTION
- 3.1 Study Assumptions & Market Definition
- 3.2 Scope of the Study
- 3.3 Research Methodology
4. KEY INDUSTRY TRENDS
- 4.1 Consumer Buying Behaviour
- 4.2 Innovations
- 4.3 Brand Share Analysis
- 4.4 Regulatory Framework
5. MARKET SEGMENTATION (includes market size in Value in USD and Volume, Forecasts up to 2030 and analysis of growth prospects)
-
5.1 Soft Drink Type
- 5.1.1 Cold Brew Coffee
- 5.1.2 Iced coffee
- 5.1.3 Other RTD Coffee
-
5.2 Packaging Type
- 5.2.1 Aseptic packages
- 5.2.2 Glass Bottles
- 5.2.3 Metal Can
- 5.2.4 PET Bottles
-
5.3 Distribution Channel
- 5.3.1 Off-trade
- 5.3.1.1 Convenience Stores
- 5.3.1.2 Online Retail
- 5.3.1.3 Specialty Stores
- 5.3.1.4 Supermarket/Hypermarket
- 5.3.1.5 Others
- 5.3.2 On-trade
6. COMPETITIVE LANDSCAPE
- 6.1 Key Strategic Moves
- 6.2 Market Share Analysis
- 6.3 Company Landscape
-
6.4 Company Profiles
- 6.4.1 BRC Inc.
- 6.4.2 Califia Farms, LLC
- 6.4.3 Chamberlain Coffee Inc.
- 6.4.4 Costco Wholesale Corporation
- 6.4.5 Danone S.A.
- 6.4.6 Keurig Dr Pepper, Inc.
- 6.4.7 La Colombe Holdings, Inc.
- 6.4.8 Luigi Lavazza S.p.A.
- 6.4.9 Nestle S.A.
- 6.4.10 Peak Rock Capital LLC
- 6.4.11 PepsiCo, Inc.
- 6.4.12 The Central America Bottling Corporation
- 6.4.13 The Coca-Cola Company
- *List Not Exhaustive
7. KEY STRATEGIC QUESTIONS FOR SOFT DRINK CEOS
8. APPENDIX
-
8.1 Global Overview
- 8.1.1 Overview
- 8.1.2 Porter’s Five Forces Framework
- 8.1.3 Market Dynamics (DROs)
- 8.2 Sources & References
- 8.3 List of Tables & Figures
- 8.4 Primary Insights
- 8.5 Data Pack
- 8.6 Glossary of Terms
You Can Purchase Parts Of This Report. Check Out Prices For Specific Sections
Get Price Break-up Now
List of Tables & Figures
- Figure 1:
- CONSUMER BUYING BEHAVIOUR
- Figure 2:
- INNOVATIONS
- Figure 3:
- BRAND SHARE ANALYSIS
- Figure 4:
- VOLUME OF US READY TO DRINK COFFEE MARKET, LITRES, UNITED STATES, 2018 - 2030
- Figure 5:
- VALUE OF US READY TO DRINK COFFEE MARKET, USD, UNITED STATES, 2018 - 2030
- Figure 6:
- VOLUME OF US READY TO DRINK COFFEE MARKET BY SOFT DRINK TYPE, LITRES, UNITED STATES, 2018 - 2030
- Figure 7:
- VALUE OF US READY TO DRINK COFFEE MARKET BY SOFT DRINK TYPE, USD, UNITED STATES, 2018 - 2030
- Figure 8:
- VALUE SHARE OF US READY TO DRINK COFFEE MARKET SPLIT BY SOFT DRINK TYPE, %, UNITED STATES, 2018 VS 2024 VS 2030
- Figure 9:
- VOLUME SHARE OF US READY TO DRINK COFFEE MARKET SPLIT BY SOFT DRINK TYPE, %, UNITED STATES, 2018 VS 2024 VS 2030
- Figure 10:
- VOLUME OF COLD BREW COFFEE MARKET, LITRES, UNITED STATES, 2018 - 2030
- Figure 11:
- VALUE OF COLD BREW COFFEE MARKET, USD, UNITED STATES, 2018 - 2030
- Figure 12:
- VALUE SHARE OF COLD BREW COFFEE MARKET SPLIT BY PACKAGING TYPE, %, UNITED STATES, 2023 VS 2030
- Figure 13:
- VOLUME OF ICED COFFEE MARKET, LITRES, UNITED STATES, 2018 - 2030
- Figure 14:
- VALUE OF ICED COFFEE MARKET, USD, UNITED STATES, 2018 - 2030
- Figure 15:
- VALUE SHARE OF ICED COFFEE MARKET SPLIT BY PACKAGING TYPE, %, UNITED STATES, 2023 VS 2030
- Figure 16:
- VOLUME OF OTHER RTD COFFEE MARKET, LITRES, UNITED STATES, 2018 - 2030
- Figure 17:
- VALUE OF OTHER RTD COFFEE MARKET, USD, UNITED STATES, 2018 - 2030
- Figure 18:
- VALUE SHARE OF OTHER RTD COFFEE MARKET SPLIT BY PACKAGING TYPE, %, UNITED STATES, 2023 VS 2030
- Figure 19:
- VOLUME OF US READY TO DRINK COFFEE MARKET BY PACKAGING TYPE, LITRES, UNITED STATES, 2018 - 2030
- Figure 20:
- VALUE OF US READY TO DRINK COFFEE MARKET BY PACKAGING TYPE, USD, UNITED STATES, 2018 - 2030
- Figure 21:
- VALUE SHARE OF US READY TO DRINK COFFEE MARKET SPLIT BY PACKAGING TYPE, %, UNITED STATES, 2018 VS 2024 VS 2030
- Figure 22:
- VOLUME SHARE OF US READY TO DRINK COFFEE MARKET SPLIT BY PACKAGING TYPE, %, UNITED STATES, 2018 VS 2024 VS 2030
- Figure 23:
- VOLUME OF US READY TO DRINK COFFEE MARKET SOLD VIA ASEPTIC PACKAGES, LITRES, UNITED STATES, 2018 - 2030
- Figure 24:
- VALUE OF US READY TO DRINK COFFEE MARKET SOLD VIA ASEPTIC PACKAGES, USD, UNITED STATES, 2018 - 2030
- Figure 25:
- VALUE SHARE OF US READY TO DRINK COFFEE MARKET SOLD VIA ASEPTIC PACKAGES, SPLIT BY SOFT DRINK TYPE %, UNITED STATES, 2023 VS 2030
- Figure 26:
- VOLUME OF US READY TO DRINK COFFEE MARKET SOLD VIA GLASS BOTTLES, LITRES, UNITED STATES, 2018 - 2030
- Figure 27:
- VALUE OF US READY TO DRINK COFFEE MARKET SOLD VIA GLASS BOTTLES, USD, UNITED STATES, 2018 - 2030
- Figure 28:
- VALUE SHARE OF US READY TO DRINK COFFEE MARKET SOLD VIA GLASS BOTTLES, SPLIT BY SOFT DRINK TYPE %, UNITED STATES, 2023 VS 2030
- Figure 29:
- VOLUME OF US READY TO DRINK COFFEE MARKET SOLD VIA METAL CAN, LITRES, UNITED STATES, 2018 - 2030
- Figure 30:
- VALUE OF US READY TO DRINK COFFEE MARKET SOLD VIA METAL CAN, USD, UNITED STATES, 2018 - 2030
- Figure 31:
- VALUE SHARE OF US READY TO DRINK COFFEE MARKET SOLD VIA METAL CAN, SPLIT BY SOFT DRINK TYPE %, UNITED STATES, 2023 VS 2030
- Figure 32:
- VOLUME OF US READY TO DRINK COFFEE MARKET SOLD VIA PET BOTTLES, LITRES, UNITED STATES, 2018 - 2030
- Figure 33:
- VALUE OF US READY TO DRINK COFFEE MARKET SOLD VIA PET BOTTLES, USD, UNITED STATES, 2018 - 2030
- Figure 34:
- VALUE SHARE OF US READY TO DRINK COFFEE MARKET SOLD VIA PET BOTTLES, SPLIT BY SOFT DRINK TYPE %, UNITED STATES, 2023 VS 2030
- Figure 35:
- VOLUME OF US READY TO DRINK COFFEE MARKET BY DISTRIBUTION CHANNEL, LITRES, UNITED STATES, 2018 - 2030
- Figure 36:
- VALUE OF US READY TO DRINK COFFEE MARKET BY DISTRIBUTION CHANNEL, USD, UNITED STATES, 2018 - 2030
- Figure 37:
- VALUE SHARE OF US READY TO DRINK COFFEE MARKET SPLIT BY DISTRIBUTION CHANNEL, %, UNITED STATES, 2018 VS 2024 VS 2030
- Figure 38:
- VOLUME SHARE OF US READY TO DRINK COFFEE MARKET SPLIT BY DISTRIBUTION CHANNEL, %, UNITED STATES, 2018 VS 2024 VS 2030
- Figure 39:
- VOLUME OF US READY TO DRINK COFFEE MARKET SOLD VIA OFF-TRADE CHANNELS, LITRES, UNITED STATES, 2018 - 2030
- Figure 40:
- VALUE OF US READY TO DRINK COFFEE MARKET SOLD VIA OFF-TRADE CHANNELS, USD, UNITED STATES, 2018 - 2030
- Figure 41:
- VALUE SHARE OF US READY TO DRINK COFFEE MARKET SOLD VIA OFF-TRADE CHANNELS, %, UNITED STATES, 2018 VS 2024 VS 2030
- Figure 42:
- VOLUME SHARE OF US READY TO DRINK COFFEE MARKET SOLD VIA OFF-TRADE CHANNELS, %, UNITED STATES, 2018 VS 2024 VS 2030
- Figure 43:
- VOLUME OF US READY TO DRINK COFFEE MARKET SOLD VIA CONVENIENCE STORES, LITRES, UNITED STATES, 2018 - 2030
- Figure 44:
- VALUE OF US READY TO DRINK COFFEE MARKET SOLD VIA CONVENIENCE STORES, USD, UNITED STATES, 2018 - 2030
- Figure 45:
- VALUE SHARE OF US READY TO DRINK COFFEE MARKET SOLD VIA CONVENIENCE STORES SPLIT BY SOFT DRINK TYPE, %, UNITED STATES, 2023 VS 2030
- Figure 46:
- VOLUME OF US READY TO DRINK COFFEE MARKET SOLD VIA ONLINE RETAIL, LITRES, UNITED STATES, 2018 - 2030
- Figure 47:
- VALUE OF US READY TO DRINK COFFEE MARKET SOLD VIA ONLINE RETAIL, USD, UNITED STATES, 2018 - 2030
- Figure 48:
- VALUE SHARE OF US READY TO DRINK COFFEE MARKET SOLD VIA ONLINE RETAIL SPLIT BY SOFT DRINK TYPE, %, UNITED STATES, 2023 VS 2030
- Figure 49:
- VOLUME OF US READY TO DRINK COFFEE MARKET SOLD VIA SPECIALTY STORES, LITRES, UNITED STATES, 2018 - 2030
- Figure 50:
- VALUE OF US READY TO DRINK COFFEE MARKET SOLD VIA SPECIALTY STORES, USD, UNITED STATES, 2018 - 2030
- Figure 51:
- VALUE SHARE OF US READY TO DRINK COFFEE MARKET SOLD VIA SPECIALTY STORES SPLIT BY SOFT DRINK TYPE, %, UNITED STATES, 2023 VS 2030
- Figure 52:
- VOLUME OF US READY TO DRINK COFFEE MARKET SOLD VIA SUPERMARKET/HYPERMARKET, LITRES, UNITED STATES, 2018 - 2030
- Figure 53:
- VALUE OF US READY TO DRINK COFFEE MARKET SOLD VIA SUPERMARKET/HYPERMARKET, USD, UNITED STATES, 2018 - 2030
- Figure 54:
- VALUE SHARE OF US READY TO DRINK COFFEE MARKET SOLD VIA SUPERMARKET/HYPERMARKET SPLIT BY SOFT DRINK TYPE, %, UNITED STATES, 2023 VS 2030
- Figure 55:
- VOLUME OF US READY TO DRINK COFFEE MARKET SOLD VIA OTHER DISTRIBUTION CHANNEL, LITRES, UNITED STATES, 2018 - 2030
- Figure 56:
- VALUE OF US READY TO DRINK COFFEE MARKET SOLD VIA OTHER DISTRIBUTION CHANNEL, USD, UNITED STATES, 2018 - 2030
- Figure 57:
- VALUE SHARE OF US READY TO DRINK COFFEE MARKET SOLD VIA OTHERS SPLIT BY SOFT DRINK TYPE, %, UNITED STATES, 2023 VS 2030
- Figure 58:
- VOLUME OF US READY TO DRINK COFFEE MARKET SOLD VIA ON-TRADE CHANNEL, LITRES, UNITED STATES, 2018 - 2030
- Figure 59:
- VALUE OF US READY TO DRINK COFFEE MARKET SOLD VIA ON-TRADE CHANNEL, USD, UNITED STATES, 2018 - 2030
- Figure 60:
- VALUE SHARE OF US READY TO DRINK COFFEE MARKET SOLD VIA ON-TRADE CHANNEL, SPLIT BY SOFT DRINK TYPE, %, UNITED STATES, 2023 VS 2030
- Figure 61:
- MOST ACTIVE COMPANIES BY NUMBER OF STRATEGIC MOVES, COUNT, UNITED STATES, 2020 - 2023
- Figure 62:
- MOST ADOPTED STRATEGIES, COUNT, UNITED STATES, 2020 - 2023
- Figure 63:
- VALUE SHARE OF MAJOR PLAYERS, %, UNITED STATES
US Ready to Drink Coffee Industry Segmentation
Cold Brew Coffee, Iced coffee are covered as segments by Soft Drink Type. Aseptic packages, Glass Bottles, Metal Can, PET Bottles are covered as segments by Packaging Type. Off-trade, On-trade are covered as segments by Distribution Channel.| Soft Drink Type | Cold Brew Coffee | ||
| Iced coffee | |||
| Other RTD Coffee | |||
| Packaging Type | Aseptic packages | ||
| Glass Bottles | |||
| Metal Can | |||
| PET Bottles | |||
| Distribution Channel | Off-trade | Convenience Stores | |
| Online Retail | |||
| Specialty Stores | |||
| Supermarket/Hypermarket | |||
| Others | |||
| On-trade | |||
Need A Different Region or Segment?
Customize Now
Market Definition
- Carbonated Soft Drinks (CSDs) - Carbonated soft drinks (CSDs) refer to non-alcoholic beverages that are carbonated and typically flavored, containing dissolved carbon dioxide to create effervescence. These beverages commonly include cola, lemon-lime, orange, and various fruit-flavored sodas. Marketed in cans, bottles, or fountain dispense.
- Juices - We have considered packaged juices which encompass non-alcoholic beverages derived from fruits, vegetables, or a combination thereof, processed and sealed in various packaging formats such as bottles, cartons, or pouches. Excluding fresh juices, this market segment involves commercially prepared and preserved juices, often with added preservatives and flavors.
- Ready-to-Drink (RTD) Tea and RTD Coffee - Ready-to-Drink (RTD) tea and RTD coffee are pre-packaged, non-alcoholic beverages that are brewed and prepared for consumption without further dilution. RTD tea typically includes various tea varieties, infused with flavors and sweeteners, and comes in bottles, cans, or cartons. Similarly, RTD coffee involves pre-brewed coffee formulations, often mixed with milk, sugar, or flavorings, and is conveniently packaged for on-the-go consumption.
- Energy Drinks - Energy drinks are non-alcoholic beverages formulated to provide a quick boost of energy and alertness. Whereas, sports drinks are beverages designed to hydrate and replenish electrolytes, particularly after physical exertion, exercise, or intense activity
| Keyword | Definition |
|---|---|
| Carbonated Soft Drinks | Carbonated soft drinks (CSDs) are a combination of carbonated water and flavouring, sweetened by sugar or a non-sugar sweeteners. |
| Standard Cola | Standard Cola is defined as the original flavor of cola soda. |
| Diet Cola | A cola-based soft drink containing no or low amounts of sugar |
| Fruit Flavored Carbonates | A carbonated beverage prepared from fruit juice/fruit flavor with carbonated water and containing sugar, dextrose, invert sugar or liquid glucose either singly or in combination. It may contain peel oil and fruit essences. |
| Juice | Juice is a drink made from the extraction or pressing of the natural liquid contained in fruit and vegetables. |
| 100% Juice | Fruit/vegetable juice made from fruit in the form of its juice with no water added to make up the volume. It is not permitted to add sugars, sweeteners, preservatives, flavourings or colourings to fruit juice. |
| Juice Drinks (up to 24% Juice) | Fruit/vegetable juice drinks with up to 24% fruits/vegetable extract. |
| Nectars (25-99% Juice) | Juices that can have between 25 and 99% of fruit, with the minimum legal limits defined depending on the type of fruit |
| Juice concentrates | Juice Concentrates are those form of juices when most of this liquid is removed resulting in a thick, syrupy product known as juice concentrate. |
| RTD Coffee | Packaged coffee beverages that are sold in a prepared form and are ready for consumption at the time of purchase. |
| Iced Coffee | An iced coffee is a cold version of coffee, usually a combination of hot espresso and milk with ice added to it. |
| Cold Brew Coffee | Cold brew also called cold water extraction or cold pressing is made by steeping ground coffee in room-temperature water for several hours. |
| RTD Tea | Ready-to-drink (RTD) tea is a packaged tea product ready for immediate consumption without brewing or preparation |
| Iced Tea | Ice tea or iced tea is a drink made from tea without milk but with sugar and sometimes fruit flavourings, drunk cold. |
| Green Tea | Green tea is a tea beverage which promotes mental alertness, relieving digestive symptoms and promoting weight loss. |
| Herbal Tea | Herbal tea beverages are made from the infusion or decoction of herbs, spices, or other plant material in hot water. |
| Energy Drink | A type of drink containing stimulant compounds, usually caffeine, which is marketed as providing mental and physical stimulation. They may or may not be carbonated and may also contain sugar, other sweeteners, or herbal extracts, among numerous possible ingredients. |
| Sugar-free or Low-calories Energy Drinks | Sugar-free or Low-calories Energy Drinks are sugar-free, artificially sweetened energy drinks with few or no calories. |
| Traditional Energy Drink | Traditional Energy Drinks are functional soft drinks containing ingredients designed to boost the consumer's energy. |
| Natural/Oraganic Energy Drinks | Natural/Organic energy drinks are energy drinks free of artificial sweeteners and synthetic colorings. Instead, they contain naturally derived ingredients such as green tea, yerba mate, and botanical extracts. |
| Energy Shots | A small but highly concentrated energy drink that contains large amounts of caffeine and/or other stimulants. The quantity is comparatively smaller compared to energy drinks. |
| Sports Drink | Sports drinks are beverages designed specifically for the rapid supply of fluid, carbohydrates, and electrolytes before, during or after exercise. |
| Isotonic | Isotonic drinks contain similar concentrations of salt and sugar as in the human body, and are designed to quickly replace fluids lost during exercise but with an increase of carbohydrate. |
| Hypertonic | Hypertonic drinks have a higher concentration of salt and sugar than the human body. They are best drunk after exercise as it is important to replace glycogen levels quickly after exercise. |
| Hypotonic | Hypotonic drinks are designed to quickly replace fluids lost during exercise. They have very low carbohydrate content and a lower concentration of salt and sugar than the human body. |
| Electrolyte-Enhanced Water | Electrolyte water is water infused with electrically-charged minerals, such as sodium, potassium, calcium, and magnesium. |
| Protein-based Sport Drinks | Protein-based sports drinks are those sports drinks which has added protein in it that will improve performance and reduce muscle protein breakdown. |
| On-Trade | The on-trade refers to places that sell beverages for immediate consumption on the premises like bars, restaurants, and pubs |
| Off-Trade | Off-trade usually means places like liquor stores, supermarkets and other places where you don't consume the beverage right away. |
| Convenience Store | A retail business that provides the public with a convenient location to quickly purchase a wide variety of consumable products and services, generally food and gasoline. |
| Specialty store | A specialty store is a shop/store that carries a deep assortment of brands, styles, or models within a relatively narrow category of goods |
| Online Retail | Online retail is a type of eCommerce whereby a business sells goods or services directly to consumers from a website. |
| Aseptic Packaging | Aseptic packaging refers to the filling of a cold, commercially sterile product under sterile conditions into a presterilized container and closure under sterile conditions to form a seal that effectively excludes microorganisms. These includes tetra packs, cartons, pouches etc. |
| PET Bottle | PET bottle means a bottle made of polyethylene terephthalate. |
| Metal Cans | Metal containers made of aluminum or tin- plated or zinc-plated steel, which are commonly used for packaging food, beverages or other products. |
| Disposable Cups | Disposable Cup means a cup or other container designed for single use to serve beverages, such as water, cold drinks, hot drinks and alcoholic beverages. |
| Gen Z | A way of referring to the group of people who were born in the late 1990s and early 2000s. |
| Millenial | Anyone born between 1981 and 1996 (ages 23 to 38 in 2019) is considered a Millennial |
| Taurine | Taurine is an amino acid that supports immune health and nervous system function. |
| Bars & Pubs | It is a drinking establishment licensed to serve alcoholic drinks for consumption on the premises. |
| Café | It is a foodservice establishment serving refreshments (mainly coffee) and light meals. |
| On the go | It means doing / dealing with while busily engaged with something and not diverting plans in order to accommodate. |
| Internet Penetration | The Internet Penetration Rate corresponds to the percentage of the total population of a given country or region that uses the Internet. |
| Vending Machine | A machine that dispenses small articles such as food, drinks, or cigarettes when a coin or token is inserted |
| Discount store | A discount store or discounter offers a retail format in which products are sold at prices that are in principle lower than an actual or supposed "full retail price". Discounters rely on bulk purchasing and efficient distribution to keep down costs. |
| Clean Label | Clean label on the beverage market are drinks that are made from few ingredients of natural origin and are not or only slightly processed. |
| Caffeine | An alkaloid compound which is a stimulant of the central nervous system. It is mainly used recreationally, as a mild cognitive enhancer to increase alertness and attentional performance. |
| Extreme sport | Action sports, adventure sports or extreme sports are activities perceived as involving a high degree of risk. |
| High-intensity interval training | It incorporates several rounds that alternate between several minutes of high intensity movements to significantly increase the heart rate to at least 80% of one's maximum heart rate, followed by short periods of lower intensity movements. |
| Shelf life | The length of time for which an item remains usable, fit for consumption, or saleable. |
| Cream Soda | Cream soda is a sweet soft drink. Generally flavored with vanilla and based on the taste of an ice cream float |
| Root Beer | Root beer is a sweet North American soft drink traditionally made using the root bark of the sassafras tree Sassafras albidum or the vine of Smilax ornata as the primary flavor. Root beer is typically, but not exclusively, non-alcoholic, caffeine-free, sweet, and carbonated. |
| Vanilla Soda | A carbonated soft drink flavoured with vanilla. |
| Dairy-Free | A product that does not contain any milk or milk products from cows, sheep or goats. |
| Caffeine-Free Energy Drinks | Caffeine-free energy drinks rely on other ingredients to boost the energy. Popular choices include amino acids, B vitamins, and electrolytes. |
Need More Details on Market Definition?
Ask a Question
Research Methodology
Mordor Intelligence follows a four-step methodology in all our reports.
- Step-1: IDENTIFY KEY VARIABLES: In order to build a robust forecasting methodology, the variables and factors identified in Step 1 are tested against available historical market numbers. Through an iterative process, the variables required for market forecast are set, and the model is built on the basis of these variables.
- Step-2: Build a Market Model: Market-size estimations for the forecast years are in nominal terms. Inflation is not a part of the pricing, and the average selling price (ASP) is kept constant throughout the forecast period for each country.
- Step-3: Validate and Finalize: In this important step, all market numbers, variables, and analyst calls are validated through an extensive network of primary research experts from the market studied. The respondents are selected across levels and functions to generate a holistic picture of the market studied.
- Step-4: Research Outputs: Syndicated reports, custom consulting assignments, databases & subscription platforms

Get More Details On Research Methodology
Download PDF


