Market Overview
| Study Period | 2021 - 2031 |
|---|---|
| Forecast Data Period | 2026 - 2031 |
| Historical Data Period | 2021 - 2024 |
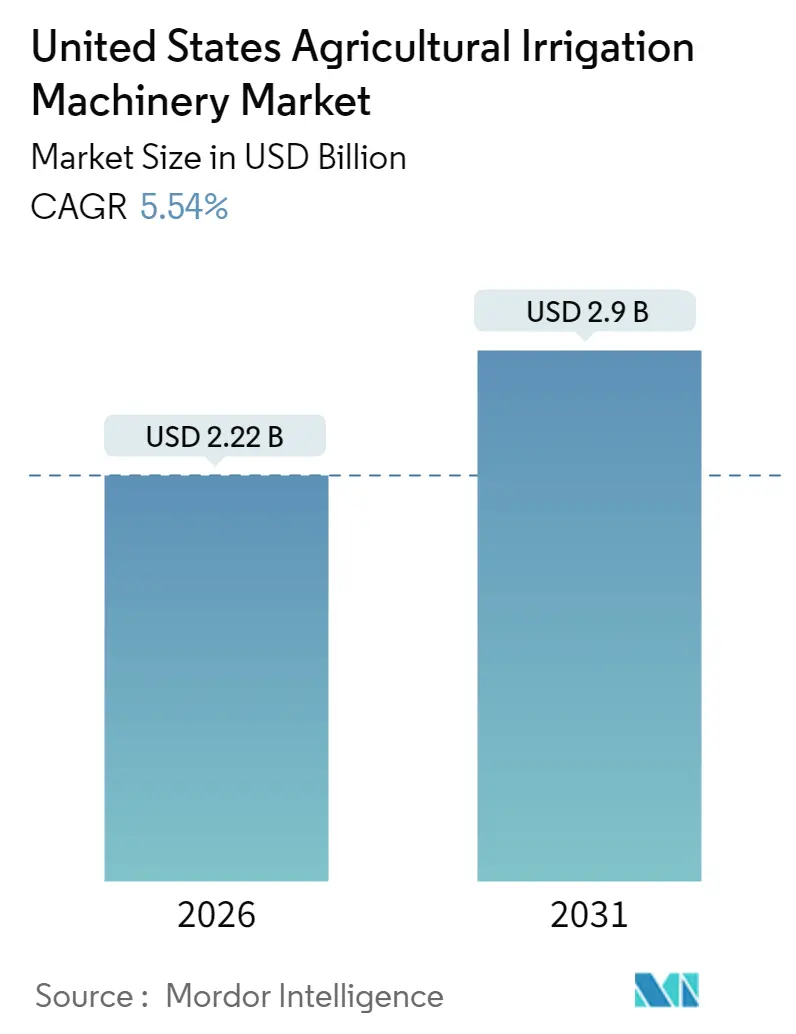
| Market Size (2026) | USD 2.22 Billion |
| Market Size (2031) | USD 2.9 Billion |
| Growth Rate (2026 - 2031) | 5.54% CAGR |
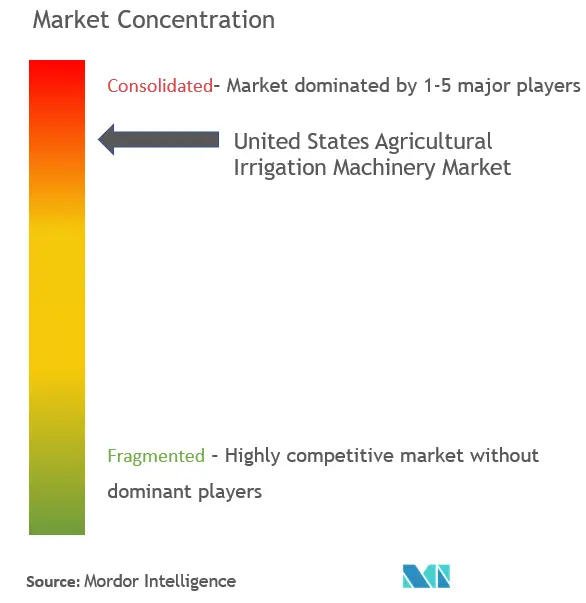
| Market Concentration | High |
Major Players
*Disclaimer: Major Players sorted in no particular order Image © Mordor Intelligence. Reuse requires attribution under CC BY 4.0. |
|
United States Agricultural Irrigation Machinery Market Analysis by Mordor Intelligence
The United States agricultural irrigation machinery market is expected to grow from USD 2.10 billion in 2025 to USD 2.22 billion in 2026 and is forecast to reach USD 2.90 billion by 2031 at 5.54% CAGR over 2026-2031. Producers are substituting aging flood layouts with sensor-enabled pivots and pressure-compensating drip lines in response to conservation incentives, water-scarcity mandates, and escalating energy expenses, while tax credits for on-farm solar further shrink lifetime operating costs. Pivot irrigation still dominates installed acreage, yet the high-efficiency drip segment is advancing more than twice as fast as pivots as specialty tree-nut and berry operations demand precise water delivery. At the same time, broadband build-outs and cloud-based analytics are expanding the addressable base for variable-rate scheduling, reinforcing the technology shift and deepening competitive differentiation among platform-centric suppliers.
Key Report Takeaways
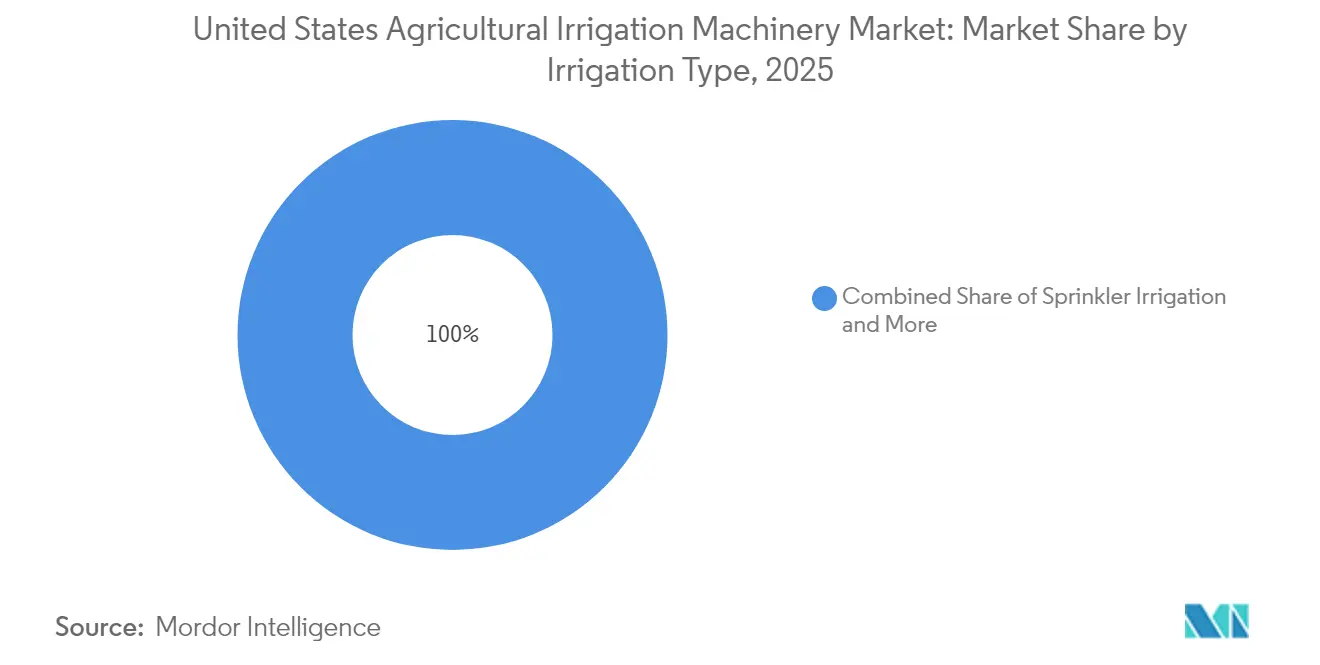
- By irrigation type, pivot irrigation led with a 43.35% of the United States agricultural irrigation machinery market share in 2025, while drip irrigation is forecast to expand at an 11.02% CAGR to 2031.
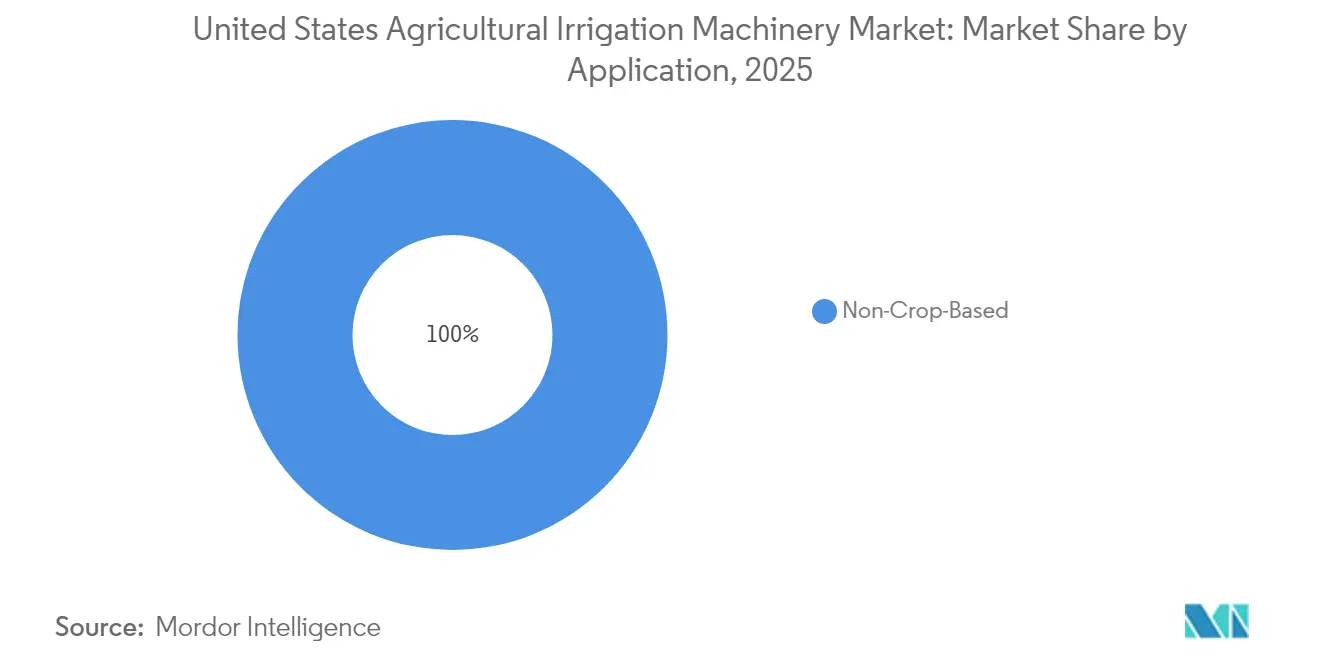
- By application, crop-based uses accounted for 70.25% of the United States agricultural irrigation machinery market, and are advancing at a 8.72% CAGR through 2031.
Note: Market size and forecast figures in this report are generated using Mordor Intelligence’s proprietary estimation framework, updated with the latest available data and insights as of January 2026.
United States Agricultural Irrigation Machinery Market Trends and Insights
Drivers Impact Analysis
| Driver | (~) % Impact on CAGR Forecast | Geographic Relevance | Impact Timeline |
|---|---|---|---|
| Federal cost-share programs accelerating pivot system upgrades | +1.20% | National, greatest uptake in Great Plains and Mountain West | Medium term (2-4 years) |
| Rising water-use efficiency mandates in water-stressed states | +1.40% | California, Arizona, Nebraska, Kansas, and Texas | Long term (≥ 4 years) |
| Rapid adoption of sensor-based variable-rate irrigation (VRI) controls | +1.10% | Midwest corn belt, and Pacific Northwest | Medium term (2-4 years) |
| Increasing acreage of specialty fruit and nut crops requiring drip systems | +0.90% | California Central Valley, Pacific Northwest, and Southeast | Long term (≥ 4 years) |
| On-farm solar-powered pump incentives lowering operating costs | +0.70% | Remote high-plains and desert regions | Short term (≤ 2 years) |
| Emergence of autonomous irrigation robots for labor-constrained farms | +0.50% | California, Arizona, Washington, pilot sites in Florida | Long term (≥ 4 years) |
| Source: Mordor Intelligence | |||
Federal Cost-Share Programs Accelerating Pivot System Upgrades
In fiscal 2024, the Environmental Quality Incentives Program disbursed a significant amount to support hardware expenditures for growers that replaced flood systems or retrofitted older pivots, compressing typical payback periods from eight years to fewer than four. State-level zero-interest loans in Nebraska, Kansas, and Colorado complement the federal benefit and financed a rise in High Plains installations over the past year. The incentive mix has broadened adoption among 500- to 1,000-acre operations that previously lacked the balance-sheet strength to self-fund USD 120,000 pivots. Dealer order logs show an uptick in variable-rate nozzle packages, reflecting producers’ intent to maximize program eligibility and water savings simultaneously. However, the initiative remains subject to annual appropriations, and any Farm Bill cuts after 2026 could pause upgrades, particularly for smaller growers lacking commercial credit lines. Suppliers are therefore accelerating shipments ahead of possible funding uncertainty, while lobbying coalitions seek to maintain cost-share ceilings through 2030. The thrust of these incentives underscores why the United States agricultural irrigation systems market continues to outpace broader farm machinery spending.
Rising Water-Use Efficiency Mandates in Water-Stressed States
California’s Sustainable Groundwater Management Act compels critically overdrafted basins to achieve sustainability by 2040, effectively forcing a 20%–30% cut in agricultural withdrawals across the San Joaquin Valley [1]California Department of Water Resources, “Sustainable Groundwater Management Act,” water.ca.gov. Arizona, Nebraska, and Kansas have introduced metering and volumetric caps that penalize inefficient flood practices, nudging growers toward drip and micro-sprinkler layouts that slash evaporation. Field trials conducted by the Agricultural Research Service show drip reducing losses by up to 25% compared with overhead sprinklers in almonds and pistachios [2]USDA Agricultural Research Service, “Irrigation Research Highlights,” ars.usda.gov. Compliance deadlines extend through 2030, anchoring a durable pipeline of retrofit demand for both subsurface emitters and variable-rate pivots able to document efficiency gains. Nevertheless, uneven enforcement and drought-year exemptions create uncertainty, prompting some operators to stage equipment purchases to align with local milestones. Technology vendors are responding with monitoring dashboards that convert sensor data into compliance reports, simultaneously meeting regulatory reporting needs and driving stickiness for their subscription platforms within the United States agricultural irrigation systems market.
Rapid Adoption of Sensor-Based Variable-Rate Irrigation (VRI) Controls
Across 1,200 Midwest corn and soybean fields, real-time soil-moisture telemetry cut applied water by an average of 18% in the 2024 season. Valmont’s FieldNET Advisor and Lindsay’s FieldNET suite manage a large network of connected pivots and integrate weather forecasts with evapotranspiration models to adjust rates zone by zone. The economics hinge on robust connectivity, as 14% of cropland still lacks reliable cellular or satellite coverage, limiting return on investment for growers in unserved counties. The Infrastructure Investment and Jobs Act allocates USD 65 billion for rural broadband, but carrier rollouts may not reach many counties before 2027. Consequently, uptake remains clustered around regions with 4G or Starlink coverage, nudging suppliers to bundle satellite plans into lease packages. Even so, case studies from Iowa and Washington show variable-rate systems recouping costs within three seasons when savings are coupled with fertilizer micro-dosing, reinforcing momentum within the United States agricultural irrigation systems market.
Increasing Acreage of Specialty Fruit and Nut Crops Requiring Drip Systems
Almond plantings in California climbed 5.3% from 2021 to 2024, while pistachios expanded 12.9% in the same window [3]Food and Agriculture Organization of the United Nations (FAO), "FAOSTAT: Crops and Livestock Products," 2024, www.fao.org/faostat. These perennials demand root-zone consistency to maximize kernel fill, prompting widespread adoption of subsurface drip lines that stabilize soil moisture and accommodate fertigation. Blueberry and strawberry enterprises across the Southeast and Pacific Northwest mirror this trajectory as drip-irrigated berry acreage has been increasing annually since 2022. Global buyers increasingly request water-footprint certifications, bolstering adoption among export-oriented farms that wish to preserve market access. Despite upfront costs of USD 2,500–USD 4,000 per acre, many growers justify the investment via yield gains of 12%–18%, reduced disease pressure, and higher pack-out quality. Maintenance hurdles, clogging, algae, and mineral deposits, persist but are being mitigated by inline filtration and pressure-compensating emitters from Netafim and Rivulis. Collectively, these dynamics are expanding the addressable base and pushing the United States agricultural irrigation systems market deeper into specialty-crop regions.
Market Restraints
| Restraint | (~) % Impact on CAGR Forecast | Geographic Relevance | Impact Timeline |
|---|---|---|---|
| High upfront CAPEX for large-area center pivots | –0.8% | Nationwide, sharpest in Midwest corn–soybean belt | Medium term (2-4 years) |
| Chronic rural broadband gaps limiting precision-irrigation ROI | –0.6% | Great Plains, Mountain West, and Southeast | Long term (≥ 4 years) |
| Volatility in agricultural commodity prices squeezing farm capital budgets | –0.7% | Nationwide, greater where revenue relies on row crops | Short term (≤ 2 years) |
| Increasing scrutiny of groundwater withdrawals in Ogallala Aquifer states | –0.4% | Kansas, Nebraska, Texas, and Oklahoma | Long term (≥ 4 years) |
| Source: Mordor Intelligence | |||
High Upfront CAPEX for Large-Area Center Pivots
A modern quarter-mile variable-rate pivot costs USD 90,000–USD 200,000, absorbing 15%–25% of a 1,000-acre corn–soybean farm’s yearly gross [4]USDA Economic Research Service, “Farm Income and Wealth Statistics,” ers.usda.gov. When commodity prices sag, payback horizons can stretch beyond 10 years, discouraging purchases despite potential water savings. Federal cost-share programs ease barriers, but application queues run 18–24 months in high-demand districts, compelling growers either to self-finance at commercial rates or to delay. Leasing options provided by Valmont and Lindsay reduce upfront cash requirements but involve an interest rate of 6%–8% over a seven-year term. Dealers note that used equipment shortages raise sticker prices, further inflating capital hurdles. Delays ripple through the broader United States agricultural irrigation systems market, slowing replacement cycles and dampening volume growth even as technology advances.
Chronic Rural Broadband Gaps Limiting Precision-Irrigation ROI
Roughly 14% of cropland still lacks stable cellular or satellite coverage, stalling real-time telemetry adoption that can save 15%–20% water. Connectivity blind spots force farmers back to time-based or manual scheduling, capping efficiency and eroding pivot ROI. Federal broadband funding promises relief, but low-density regions may remain underserved if carriers deem returns insufficient. Interim satellite plans, such as Starlink, incur higher annual costs per unit, which can offset some fuel savings and exert pressure on already narrow profit margins. Until the coverage map fills in, geographic unevenness will persist, segmenting the United States agricultural irrigation systems market into connected and disconnected sub-regions with divergent capital-spending profiles.
Segment Analysis
By Irrigation Type: Drip Systems Gain on Pivot Dominance
Pivot irrigation commanded a 43.35% of the United States agricultural irrigation machinery market share in 2025, followed by sprinkler setups, while drip captured a smaller but fast-rising fraction of total acreage. Drip’s expansion aligns with specialty-crop growth, rising water-use mandates, and technology that maintains uniform flow on undulating terrain. Rivulis, and The Toro Company have rolled out pressure-compensating emitters and inline filtration that extend service life and curb clogging. Pivots remain cost-effective on large, flat tracts, especially when outfitted with GPS steering and variable-rate nozzles that help narrow the efficiency gap with drip. Sprinkler big-guns are steadily displaced, and flood or furrow options continue to decline as they are ineligible for federal subsidies.
Drip is projected to log the fastest 11.02% CAGR through 2031, making it the prime engine of incremental revenue within the United States agricultural irrigation systems market size. Pivot systems will still advance, as row-crop producers adopt sensor-guided modules to comply with groundwater caps, while sprinkler rigs will stagnate and flood usage will retreat further. The relative pace underscores how conservation policy and crop-mix shifts steer capital spending across irrigation modalities, reshaping competitive focus among leading suppliers.
Note: Segment shares of all individual segments available upon report purchase
Get Detailed Market Forecasts at the Most Granular Levels
Download PDF
By Application: Specialty Crops Drive Fastest Expansion
Food Crop-based uses accounted for 70.25% of 2025 sales, and are advancing at a 8.72% CAGR through 2031, led by row crops such as corn, soybeans, wheat, and cotton. Specialty fruit and nut crops delivered a smaller absolute sum but registered the fastest growth, propelled by rising almond, pistachio, and berry acreage in California, the Pacific Northwest, and the Southeast. Non-food crop applications, including turf, landscaping, and nurseries, account for the remainder and provide steadier cash flow as municipal budgets insulate them from commodity swings.
Specialty fruit and nut crops are forecast to grow at the fastest pace among all uses, reflecting export-driven demand and stringent water-footprint certification standards. Row-crop segments will expand at a more moderate rate as aquifer scrutiny and price volatility temper growth. Non-crop categories are estimated to maintain steady momentum, supported by municipal conservation programs and rising penetration of micro-sprinklers in commercial landscapes. Taken together, these trends reaffirm that specialty acreage will continue to anchor the strongest growth within the United States agricultural irrigation machinery market over the next several years.
Note: Segment shares of all individual segments available upon report purchase
Get Detailed Market Forecasts at the Most Granular Levels
Download PDF
Geography Analysis
The Great Plains and Mountain West account for the bulk of mechanized acreage, with Nebraska, Kansas, and Colorado concentrating more than half of national pivot installations, yet drip’s penetration is rising in California’s Central Valley and the Pacific Northwest, where strict groundwater regimes prevail. These populous installations form the revenue backbone of the United States agricultural irrigation systems market.
California leads drip spending as Sustainable Groundwater Management Act deadlines draw near; almond, pistachio, and vineyard operators accelerated subsurface networks in 2025. Pacific Northwest berry operations add incremental volume, while the Southeast’s peanut and vegetable belts adopt low-flow tape to reduce disease. In contrast, Midwestern uptake hinges on broadband rollouts; states such as Iowa and Illinois with better 4G coverage have demonstrated higher variable-rate pivot adoption than neighbors still reliant on manual scheduling.
The Ogallala Aquifer overlay introduces regional risk. Kansas and Texas see moderated pivot orders amid pumping-cap debates, while Nebraska leverages zero-interest loans to sustain an upgrade cycle. Remote high-plains counties from eastern Colorado into New Mexico are early adopters of solar-powered pumps owing to high diesel cost and vast grid distances, tilting local growth toward hybrid energy packages. Broadly, the interplay of water policy, connectivity, and energy economics shapes a multi-speed the United States agricultural irrigation machinery market across states.
Competitive Landscape
The top five players, Valmont Industries, Inc., Lindsay Corporation, The Toro Company, Nelson Irrigation, and Orbia (Netafim USA), captured a significant share of sales in 2025, signposting a concentrated structure within the United States agricultural irrigation machinery market. Valmont Industries, Inc. leads the market through its telemetry subscriptions with hardware. Lindsay Corporation follows and differentiates its position with an advanced portfolio.
The Toro Company's 2024 acquisition of select Rivulis Irrigation Ltd. drip assets has strengthened its position in specialty-crop kits. Netafim USA continues to hold technical leadership in pressure-compensating emitters, while Nelson Irrigation focuses on advancing low-pressure Rotator nozzles for semi-arid pivots. Leading players leverage extensive dealer networks, proprietary agronomic data, and substantial R&D budgets to sustain high entry barriers.
White-space opportunities are emerging around fertigation control and autonomous maintenance. Cropx Inc. and Agri-Inject, Inc. link soil-nutrient sensors with injection pumps to deliver variable-rate chemicals, while Deere & Company’s integration with Lindsay’s FieldNET offers a closed loop across planting, spraying, and irrigation. The resulting arms race accelerates technology diffusion but also cements platform stickiness, reinforcing concentration within the United States agricultural irrigation systems market.
United States Agricultural Irrigation Machinery Industry Leaders
-
Valmont Industries, Inc.
-
Lindsay Corporation
-
The Toro Company
-
Nelson Irrigation
-
Orbia (Netafim USA)
- *Disclaimer: Major Players sorted in no particular order
Need More Details on Market Players and Competitors?
Download PDF
Recent Industry Developments
- November 2025: Komet Irrigation has introduced the Komet Precision Wave (KPW), a pivot sprinkler designed to enhance water distribution uniformity and improve irrigation efficiency. This technology ensures better plant hydration while reducing water loss due to runoff or evaporation.
- August 2025: Lumo has introduced Pump Automation, an advanced integration with its smart valve platform. This solution enables full automation of irrigation processes, from pump to plant, on ranches spanning 60 to 1,300 acres.
- September 2025: Reinke Manufacturing introduced its E3 precision series of center pivot systems in the United States and Canada. This patented irrigation system redefines standards for water application uniformity, efficiency, and performance, featuring advancements such as ReinLock truss technology, consistent coupler spacing, and a distinctive blue end sign.
United States Agricultural Irrigation Machinery Market Report Scope
Agricultural irrigation machinery is a system that distributes water under low pressure through a piped network and applies it as a small discharge to each plant. Micro-irrigation uses less pressure and water flow than sprinkler irrigation. Drip irrigation delivers water directly to the root zone of plants. The United States agricultural irrigation machinery market is segmented by irrigation type into sprinkler irrigation, drip irrigation, pivot irrigation, and other irrigation types and application into crop and non-crop. The report offers the market size and forecasts for volume in (units) and value in (USD million) for all the above segments.
Irrigation Type
| Sprinkler Irrigation |
| Drip Irrigation |
| Pivot Irrigation |
| Other Irrigation Types |
Application
| Food Crops | Row Crops |
| Specialty Fruit and Nut Crops | |
| Non-food Crops |
| Irrigation Type | Sprinkler Irrigation | |
| Drip Irrigation | ||
| Pivot Irrigation | ||
| Other Irrigation Types | ||
| Application | Food Crops | Row Crops |
| Specialty Fruit and Nut Crops | ||
| Non-food Crops | ||
Need A Different Region or Segment?
Customize Now
Key Questions Answered in the Report
What is the current value of the United States agricultural irrigation machinery market?
The United States agricultural irrigation machinery market size stands at USD 2.22 billion in 2026 and is projected to reach USD 2.90 billion by 2031.
Which irrigation type is growing the fastest?
Drip irrigation leads with an 11.02% CAGR to 2031, powered by specialty fruit and nut expansion and stringent water-use mandates.
Why are specialty crops important for future demand?
Almond, pistachio, and berry acreage is climbing, and these crops require precise subsurface drip that drives premium equipment sales and service revenue.
How do federal incentives influence equipment payback periods?
Cost-share programs reimburse up to 75% of pivot hardware outlays, shrinking typical payback from eight to fewer than four years for mid-sized farms.


