
Market Overview
| Study Period | 2021 - 2031 |
|---|---|
| Forecast Data Period | 2026 - 2031 |
| Base Year Market Size (2025) | USD 8.84 Billion |
| Market Size (2026) | USD 9.38 Billion |
| Market Size (2031) | USD 12.63 Billion |
| Growth Rate (2026 - 2031) | 6.12 % |
| Market Concentration | Medium |
Major Players *Disclaimer: Major Players sorted in no particular order Image © Mordor Intelligence. Reuse requires attribution under CC BY 4.0. | |

United States Nuts Market Analysis by Mordor Intelligence
United States nuts market size in 2026 is estimated at USD 9.38 billion, growing from 2025 value of USD 8.84 billion with 2031 projections showing USD 12.63 billion, growing at 6.12% CAGR over 2026-2031. The surge in the market can be attributed to a notable shift in consumer preferences, leaning towards nutrient-dense snacks and an embrace of plant-based diets. As consumers become more attuned to the health benefits of nuts, including their role in heart health, weight management, and providing essential nutrients, demand for these products has surged. Furthermore, ongoing innovations in flavors, such as spiced and sweetened varieties, and convenient packaging formats, like resealable pouches, have broadened the appeal, drawing in a diverse consumer base. The market's growth is bolstered by rising disposable incomes, increased urbanization, and heightened awareness of healthy living through social media and wellness campaigns. Collectively, these dynamics are propelling the U.S. nuts market forward, unveiling new opportunities.
Key Report Takeaways
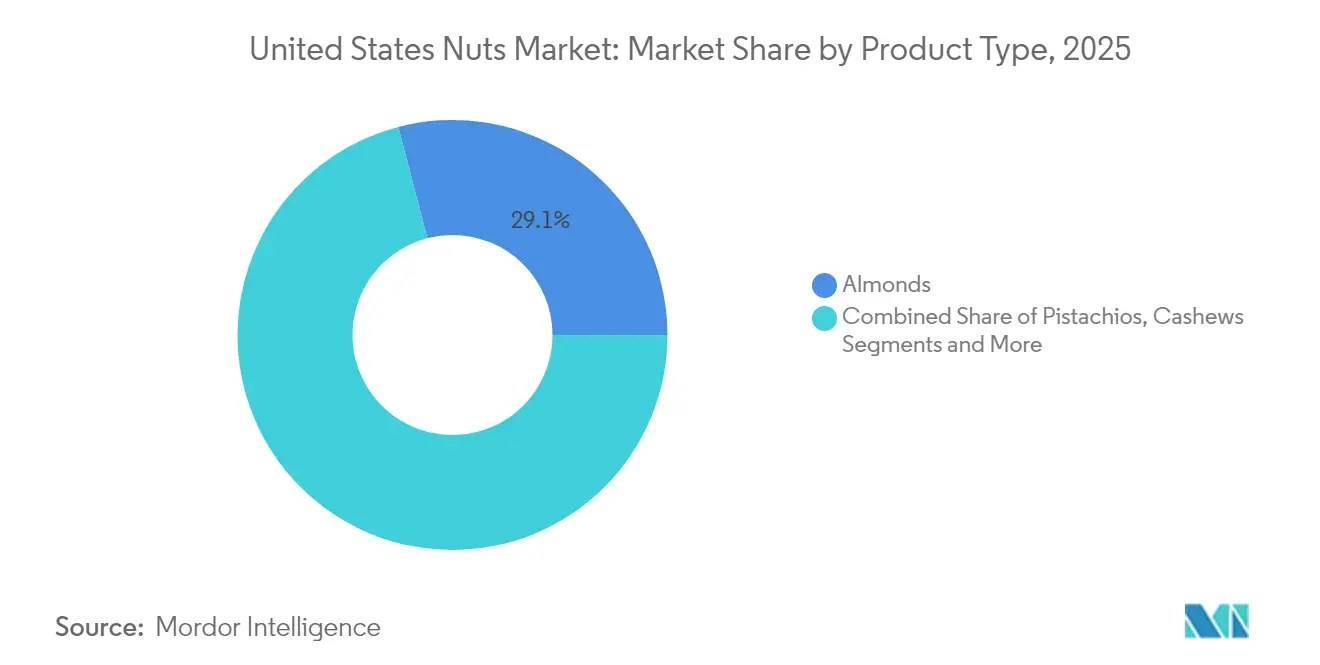
- By product type, almonds secured 29.05% of the United States nuts market share in 2025, while pistachios posted the highest projected 6.26% CAGR through 2031.
- By category, conventional formats held 75.12% share of the United States nuts market size in 2025, whereas organic options are set to expand at 6.49% CAGR over the same horizon.
- By flavor, plain and salted variants accounted for 66.05% of revenue in 2025, yet flavored lines are expected to grow at a 6.18% CAGR to 2031.
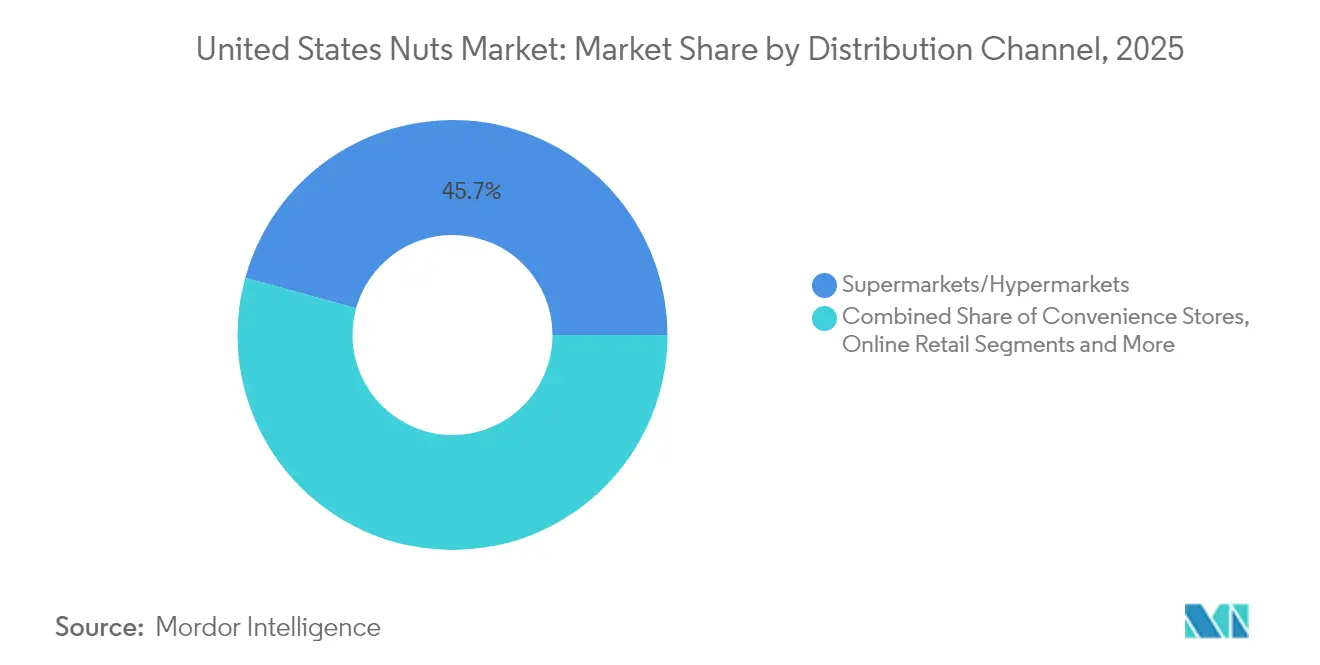
- By distribution channel, supermarkets and hypermarkets dominated with 45.71% share in 2025, while the online channel is projected to record a 6.78% CAGR through 2031.
Note: Market size and forecast figures in this report are generated using Mordor Intelligence’s proprietary estimation framework, updated with the latest available data and insights as of 2026.
United States Nuts Market Trends and Insights
Drivers Impact Analysis*
| Driver | (~) % Impact on CAGR Forecast | Geographic Relevance | Impact Timeline |
|---|---|---|---|
| Rising health consciousness and demand for nutritious snacks | +1.8% | National, with strongest adoption in California | Medium term (2-4 years) |
| Growing popularity of plant-based and vegan diets | +1.2% | National, stronger in urban areas | Long term (≥ 4 years) |
| Increasing consumer preference for convenient and ready-to-eat snacks | +1.0% | National, led by urban centers | Short term (≤ 2 years) |
| Innovation in nut-based products such as flavored nuts and nut butters | +0.9% | National, higher in urban areas | Medium term (2-4 years) |
| Growing snacking trend among millennials and Gen Z | +0.8% | National, with early adoption in high-income areas | Long term (≥ 4 years) |
| Increasing demand for organic and clean-label nut products | +0.7% | National wide | Medium term (2-4 years) |
| Source: Mordor Intelligence | |||
Rising health consciousness and demand for nutritious snacks
Rising health consciousness and demand for nutritious snacks are significant drivers fueling the growth of the United States nuts market. As American consumers become increasingly aware of the importance of a balanced and healthy diet, they are gravitating toward foods that offer high nutritional value, such as nuts, which are rich in protein, healthy fats, fiber, vitamins, and minerals. This shift is supported by scientific research and endorsements from health organizations highlighting nuts’ benefits in improving heart health, aiding weight management, and reducing the risk of chronic diseases like diabetes. Nuts are no longer just snack items; they are now widely incorporated into various food categories, including bakery products, dairy alternatives, protein bars, and plant-based meal solutions. The growing popularity of plant-based diets and clean-label products further contributes to this trend, as consumers prefer natural, minimally processed, and fortified foods. The rise of specialty nuts, including organic, flavored, and gourmet varieties, also reflects evolving consumer preferences for premium yet healthy snack options, making nuts an integral part of the modern American diet. Furthermore, studies from the Centers for Disease Control and Prevention (CDC) indicate that incorporating nuts into daily diets can help reduce the prevalence of obesity and related health conditions [1].
Growing popularity of plant-based and vegan diets
The growing popularity of plant-based and vegan diets is a powerful market driver for the United States nuts market. Increasing numbers of consumers are embracing plant-based eating not only for health benefits but also for environmental sustainability and ethical reasons. With an estimated 16 to 20 million adults in the U.S. following vegetarian or vegan diets [2] and a larger portion adopting flexitarian lifestyles, nuts have become essential nutritional staples due to their rich protein content and functional versatility. Public health endorsements and dietary guidelines also support plant-based diets as nutritionally adequate and beneficial for long-term health, especially in preventing cardiometabolic diseases. Additionally, the plant-based food market has seen exponential growth, with sales soaring for alternatives like plant-based dairy and meat substitutes, creating more opportunities for nut-based product innovation, such as nut milks, spreads, and snacks. Millennials and Gen Z, in particular, drive this shift, prioritizing natural, clean-label, and sustainably sourced plant foods. This rising consumer demand translates directly into increased nut consumption across multiple channels, fueling market expansion and innovation in product offerings tailored to plant-based lifestyles.
Increasing consumer preference for convenient and ready-to-eat snacks
Increasing consumer preference for convenient and ready-to-eat snacks is a significant driver of the United States nuts market, supported by findings from the International Food Information Council (IFIC) 2024 report which states that over 60% of consumers prioritize convenience when selecting snacks [3]. With busy lifestyles and on-the-go habits becoming the norm, consumers actively seek snacks that offer both nutritional value and ease of consumption. Nuts, known for their nutrient density and natural portability, perfectly align with this demand. The market has responded with an array of functional nut products such as seasoned nut mixes, trail mixes, nut-based snack bars, and single-serve packaging designed for convenience without compromising taste or health benefits. According to the IFIC 2024 survey, convenience is a key factor influencing snack choices, alongside a growing inclination toward healthier alternatives, with many consumers choosing snacks to satisfy hunger between meals while seeking energy-boosting and wholesome options. This confluence of convenience and health awareness continues to propel the U.S. nuts market, driving innovation and expanding distribution channels to cater to evolving consumer preferences.
Growing snacking trend among millennials and Gen Z
Millennials and Gen Z are profoundly reshaping the snacking landscape in the United States, driving the nuts market with their distinct preferences and lifestyles. These generations lead busier, more mobile lives that often break away from traditional meal patterns, favoring frequent, convenient snacking throughout the day. For them, snacks are not just a source of sustenance but serve as a form of self-expression, social connection, and a reflection of their values and identity. Unlike previous generations, millennials tend to prioritize natural and clean-label ingredients, seeking products that align with their health-conscious and socially responsible mindsets. Gen Z, meanwhile, embraces bold and adventurous flavors, a love for sweet, salty, and spicy combinations, and a preference for authentic global tastes. Both groups value convenience highly, often turning snacks into meal replacements while demanding portability and functional benefits like high protein or sustained energy. Social media influences and cultural trends amplify their openness to trying innovative, artisanal, and premium nut products. These generations’ snacking habits are characterized by a balance between indulgence and mindfulness, as they crave tasty yet nutritious options that fit into their dynamic lifestyles. Consequently, millennials and Gen Z remain pivotal in expanding and diversifying the U.S. nuts market, positioning it as a fast-growing segment aligned with modern consumer needs.
Restraints Impact Analysis*
| Restraint | (~) % Impact on CAGR Forecast | Geographic Relevance | Impact Timeline |
|---|---|---|---|
| Fluctuating prices and supply volatility due to climate and crop yields | -1.4% | California primarily, with national price impacts | Short term (≤ 2 years) |
| High price point of premium and organic nuts limiting mass adoption | -0.8% | National, most pronounced in price-sensitive segments | Medium term (2-4 years) |
| Perishability and short shelf life affecting product availability | -0.6% | National, particularly in humid climates | Short term (≤ 2 years) |
| Consumer allergies to nuts posing health concerns | -0.4% | National, concentrated in urban and suburban area | Long term (≥ 4 years) |
| Source: Mordor Intelligence | |||
Fluctuating prices and supply volatility due to climate and crop yields
Fluctuating prices and supply volatility due to climate variability and inconsistent crop yields represent significant restraints for the United States nuts market. The industry faces challenges from unpredictable weather patterns, droughts, and other environmental stresses that affect crop production volumes and quality, leading to fluctuations in supply. These supply disruptions cause instability in nut prices, impacting profitability for growers and manufacturers alike. For example, in 2025, the California almond industry reported volatility following a higher-than-expected crop forecast that sharply dropped prices and created a waiting period as buyers and sellers sought market stability. Additionally, input costs such as labor, water, and energy intensify these pressures, further tightening margins. This volatility introduces uncertainty into the market, affecting investment decisions and long-term planning for key nut producers in the United States.
High price point of premium and organic nuts limiting mass adoption
The high price point of premium and organic nuts serves as a notable restraint in the United States nuts market by limiting wider mass adoption. Premium nuts, especially those with organic or Fair Trade certifications, carry production costs that are significantly higher due to factors like more expensive farming practices, certification fees, and supply chain complexities. This premiumization drives retail prices upward, with organic varieties commanding about a 15-20% price premium over conventional nuts as of 2025. Consequently, these elevated prices pose affordability challenges for broader consumer segments, particularly among mid- to lower-income households, restricting the reach of premium and organic nut products. While consumer interest in health and wellness supports growing demand for these high-quality products, the cost barrier continues to slow penetration beyond niche markets, limiting mass-market expansion despite increasing awareness and preference for healthier snacking options.
*Our forecasts treat driver/restraint impacts as directional, not additive. The impact forecasts reflect baseline growth, mix effects, and variable interactions.
Segment Analysis
By Product Type: Almonds Lead While Pistachios Accelerate
Almonds maintain a strong leadership position in the United States nuts market, commanding a market share of 29.05% in 2025. This dominance stems from almonds' widespread consumer acceptance as a nutritious and versatile nut, favored for snacking as well as use in cooking and baking. The U.S., particularly California, is the leading producer of almonds globally, supporting steady supply and innovation in almond-based products. Almonds benefit from ongoing product diversification, including almond milk, almond butter, and flavored almonds, catering to evolving consumer tastes. Health-conscious consumers appreciate almonds for their nutrient-dense profile, including healthy fats, protein, and dietary fiber. Furthermore, advances in sustainable farming practices add to the segment's appeal by aligning with growing environmental awareness.
In contrast, pistachios have carved out their position as the fastest-growing segment in the U.S. nuts market, with a projected CAGR of 6.26% through 2031. This surge is largely driven by successful premium positioning, as pistachios resonate with consumers looking for high-quality, indulgent snack options. Innovative product launches, including flavored and roasted varieties, as well as convenient, ready-to-eat packaging, have helped expand the pistachio consumer base. Marketing efforts focused on health benefits, such as heart health and weight management, also contribute to increasing demand. The segment's rapid growth reflects shifting consumer preferences towards variety and sophistication in nuts choices. Additionally, pistachios benefit from robust production practices and export markets supporting their expanding footprint within the United States.

By Category: Conventional Dominance Faces Organic Disruption
Conventional nuts command a dominant share of 75.12% in the United States nuts market in 2025. This large market share is sustained by well-established supply chains that ensure consistent availability and competitive pricing, which resonates strongly with mainstream consumers who prioritize value. Conventional nuts appeal to a broad consumer base due to their affordability compared to certified organic varieties. The segment benefits from extensive distribution networks, including supermarkets and traditional retail channels, which enhance accessibility. Additionally, mass production and processing efficiencies further bolster the price competitiveness of conventional nuts. As a result, conventional nuts continue to serve as the backbone of the market, underpinning stable demand across diverse consumer segments.
In contrast, the organic segment is the fastest-growing category within the U.S. nuts market, exhibiting a robust CAGR of 6.49% through 2031. This accelerated growth is fueled by the expansion of certified organic acreage across the country, meeting increasing consumer demand for pesticide-free and sustainably farmed products. Consumers are increasingly willing to pay premium prices for organic nuts, motivated by health consciousness and environmental concerns. Innovation in organic nut varieties, packaging, and value-added products further stimulates market expansion. The organic segment also benefits from heightened awareness campaigns and certifications that assure product quality and safety. As consumer preferences shift towards cleaner labels and sustainable food sources, the organic nuts market is positioned for significant, long-term growth.
By Flavor: Plain Varieties Dominate Despite Flavored Innovation
Plain and salted nuts hold a commanding 66.05% market share in the United States nuts market as of 2025. This significant share underscores consumers' strong preference for natural and simple flavors that offer versatility across both snacking and culinary uses. Plain and lightly salted nuts continually appeal to a broad demographic, including health-conscious individuals seeking wholesome and minimally processed foods. The flavor profile enhances their adaptability, making them a staple ingredient and snack in various diets and culinary traditions. Widespread availability in retail channels, such as supermarkets and convenience stores, further solidifies their market position. These nuts are favored not just for their flavor but also for their nutritional benefits, contributing to the segment’s sustained dominance.
Conversely, flavored nut varieties are recognized as the fastest-growing segment within the U.S. nuts market, growing at a CAGR of 6.18% through 2031. This growth is propelled by manufacturers introducing sophisticated and diverse taste profiles that target adventurous consumers seeking new and exciting flavor experiences. Innovative flavor combinations like chili-lime, maple-smoked, and hot honey are enhancing consumer interest and expanding the market base. Flavored nuts also attract younger generations who value bold and dynamic taste sensations. The expansion of flavored options across multiple distribution channels, including online platforms, supermarkets, and specialty stores, supports this upward trend. With continued innovation and marketing efforts, flavored nuts are carving out a distinct niche, complementing the long-standing popularity of plain and salted varieties.
By Distribution Channel: Digital Transformation Reshapes Retail
Supermarkets and hypermarkets continue to hold the largest share in the United States nuts market, accounting for 45.71% of the market in 2025. This leading position is supported by their well-established relationships with major nut brands, which facilitates competitive pricing and extensive product assortments. These retail formats offer consumers a convenient one-stop shopping experience, allowing them to purchase nuts alongside other groceries. The strong presence of nuts in supermarket chains reflects consumer trust in these outlets for quality and variety. Additionally, supermarkets and hypermarkets leverage broad distribution networks and promotional activities that drive awareness and accessibility of nut products. Their ability to cater to diverse consumer preferences through an array of conventional and specialty nuts further reinforces their market dominance.
In contrast, online retail stores represent the fastest-growing distribution segment within the U.S. nuts market, expected to grow at a CAGR of 6.78% through 2031. This rapid growth stems from the increasing adoption of e-commerce across all age groups, making it easier for consumers to purchase nuts from the comfort of their homes. Direct-to-consumer sales strategies and subscription-based models have gained traction, enhancing customer loyalty and repeat purchases. Online platforms also benefit from the ability to offer a wider variety of niche and premium products that may not be readily available in physical stores. Beyond convenience, digital fitness integrations and personalized marketing are further driving online nut sales. As consumer shopping habits continue shifting toward digital channels, online retail is poised to significantly influence the future growth of the U.S. nuts market.
Geography Analysis
The United States nuts market exhibits a diverse and dynamic geographic landscape, with key regions contributing significantly to overall growth. California stands out as the dominant production hub, accounting for the majority of the country’s almond and pistachio outputs. This region’s favorable climate, advanced agricultural practices, and well-established supply chains bolster the market’s foundation. Additionally, California's position as a global exporter of nuts enhances the region’s influence in both domestic and international markets. Other significant production areas include Georgia, known for peanuts, and Texas, contributing notably to cashew and other nut segment production. Together, these regions form the backbone of the U.S. nuts industry, driving supply and innovation.
In terms of consumption, urban centers such as New York, Los Angeles, and Chicago represent major demand hotspots due to their large and diverse populations. Health consciousness and busy lifestyles in these metropolitan areas propel demand for convenient, nutritious nut-based snacks. Retail infrastructure in these cities is highly developed, with supermarkets, specialty stores, and growing e-commerce platforms facilitating easy access to nuts and nut products. This concentration of consuming power shapes product trends and marketing strategies to address diverse consumer preferences, including organic, flavored, and ready-to-eat nut offerings.
Looking ahead, the geographic growth potential for the U.S. nuts market lies in expanding penetration into emerging urban and suburban areas, as well as enhancing distribution through digital channels. Increased awareness of the health and nutritional benefits of nuts in regions with traditionally lower consumption offers opportunities for market expansion. E-commerce growth plays a key role in bridging geographic gaps, allowing consumers in less accessible locations to access premium and specialty nut products. Regional disparities in preferences and consumption patterns will continue to influence marketing and product innovation. Overall, geographic factors in production, consumption, and distribution are integral to the strategic development of the United States nuts market.
Regulatory Landscape
In the United States, nut processors and packers work within the FDA food safety framework, including the Food Safety Modernization Act (FSMA) requirements for hazard analysis and risk-based preventive controls, under the Current Good Manufacturing Practice, Hazard Analysis, and Risk-Based Preventive Controls for Human Food rule (21 CFR Part 117). For facilities handling nuts and nut-based products, this makes validated food safety plans, sanitation controls, and documented preventive controls more important, particularly given allergen and pathogen risk profiles.
Quality and commercial specifications are also shaped by USDA Agricultural Marketing Service (AMS) voluntary grade standards and commodity specifications for nuts, including benchmarks for shelled tree nuts and specific standards such as walnuts. Trade policy can further affect U.S. export economics for tree nuts: the Council of the European Union formally adopted legislation in June 2026 implementing the August 2025 EU-US joint statement, including a 500,000 metric ton tariff-rate quota for U.S. tree nuts entering the EU. This reinforces quota-based access alongside baseline tariffs in key destinations.
Competitive Landscape
The U.S. nuts market exhibits moderate concentration, with established players capitalizing on vertical integration and strong brand recognition. Companies such as Blue Diamond Growers, Wonderful Company, and Planters dominate the market by leveraging their extensive processing capabilities, robust distribution networks, and significant marketing investments. However, these market leaders face growing competition from private label alternatives and emerging specialty producers, which are gaining traction among consumers seeking diverse and niche offerings. This competitive dynamic has intensified the need for established players to maintain their market share through strategic initiatives and innovation.
Despite their competitive advantages, leading companies in the market are under pressure due to commodity price volatility and increasing retail consolidation. These factors have created challenges in maintaining profit margins, compelling market leaders to adopt strategies that mitigate risks and enhance operational efficiency. For instance, Blue Diamond Growers has partnered with Brightseed to explore bioactive compounds, aiming to differentiate its products and add value beyond traditional offerings. Such collaborations highlight the importance of innovation in addressing market challenges and sustaining growth in a competitive environment.
Innovation-driven differentiation has become a critical strategy for market leaders as commodity products face downward pricing pressure. Wonderful Company, for example, has successfully achieved USD 1 billion in North American retail sales by focusing on premium positioning strategies. This approach underscores the growing consumer demand for high-quality, value-added products, which has become a key driver in the market. As competition intensifies, established players must continue to invest in research, product development, and marketing to maintain their leadership and adapt to evolving consumer preferences.
United States Nuts Industry Leaders
-
Blue Diamond Growers
-
Waterford Nut Company
-
Hormel Foods Corporation
-
The Wonderful Company LLC
-
Tierra Farm, Inc.
- *Disclaimer: Major Players sorted in no particular order

Market Opportunities and Future Outlook
Operational efficiency and compliance-led modernization are a practical focus area for nut processors as FSMA-aligned preventive controls increase the value of validated processing and tighter process control. Manufacturers can use equipment and line upgrades that integrate grading, sorting, roasting, and seasoning into a single system to support consistent quality, traceability, and throughput in value-added formats, including the April 2025 launch of a fully integrated, turnkey nut processing line by Key Technology and PPM Technologies. The emphasis also fits product momentum around flavored lines and convenient packaging, where consistent seasoning, oil-roasting control, and defect removal influence repeat purchase and retailer acceptance.
Constraints on the supply side create opportunities beyond acreage expansion. USDA data show total bearing acreage for U.S. fruit and tree nuts in 2025 at 1.85 million acres, down 2% from 2024, which shifts attention toward yield improvement, inventory discipline, and reducing losses in storage and distribution. California remains central for almonds, walnuts, and pistachios, while Oregon hazelnuts posted a production increase in 2025 (116,000 tons, up 20% year over year), supporting product development and sourcing diversification for brands and private label. On demand and channel dynamics, online retail momentum and subscription-style purchasing, already reflected in faster channel growth within the category, support expanded assortments for premium, organic, and specialty mixes that are harder to merchandise at scale in traditional shelves.
Recent Industry Developments
- May 2026: Blue Diamond Growers selected Bardis and Miry Development, LLC to acquire approximately 35 acres of its midtown Sacramento campus for a mixed-use community project. The decision signals continued optimization of its asset footprint and a longer-term reconfiguration around core processing and brand operations. For nut brands competing on cost and service levels, footprint choices can affect logistics, capital allocation, and reinvestment capacity.
- December 2025: Hormel Foods Corporation completed a transaction with Forward Consumer Partners to establish the Justin's nut butter and organic snack brand as a standalone company, with Hormel retaining a 49% ownership stake. This structure gives Justin's a dedicated platform to operate with a focused strategy while keeping a link to a major food company. It also reflects broader portfolio actions around higher-growth, branded nut-adjacent categories such as nut butters and organic snacks.
- October 2024: Oppy partnered with Blue Diamond Growers to introduce fresh almonds and almond-fruit blends into retail produce sections. The assortment extended merchandising beyond the center-store snack aisle by placing almonds in produce, supported by consumer-tested flavors and formats. This placement can expand usage occasions and support incremental trial through produce-driven display and impulse purchases.
Research Methodology Framework and Report Scope
Market Definition and Coverage
For this study, we define the United States nuts market as the value generated from selling edible nuts to end users through retail and foodservice channels, counted at the selling price level used in trade for packaged and bulk nuts.
Scope exclusions: We exclude nut oils, nut-based beverages, and nut-derived ingredients sold mainly as industrial inputs (such as defatted meals used for further processing).
Segmentation Overview
- By Product Type
- Almonds
- Cashews
- Peanuts
- Walnuts
- Pistachios
- Other Product Types
- By Category
- Conventional
- Organic
- By Flavor
- Plain/ Salted
- Flavored
- By Distribution Channel
- Supermarkets/Hypermarkets
- Convenience/Grocery Stores
- Online Retail Stores
- Other Distribution Channels
Data Sources, Market Sizing, and Validation
Desk Research
Desk work starts by mapping the supply and demand signals that can be checked year after year. We lean on public agriculture and trade reporting, such as USDA crop, acreage, utilization, and price series, U.S. Census Bureau trade statistics, U.S. International Trade Commission tariff and import data, and FDA food labeling and safety guidance that shapes product claims and compliance.
To connect farm-side availability with market demand, we also review academic and extension publications on tree nut yield cycles and stocking trends, along with company annual reports, investor presentations, and reputable press coverage for pricing actions and channel mix. For additional context on trade flows and IP activity, we selectively use paid subscriptions for shipment-level import/export data and patent databases. These examples are illustrative only, and many other references were used for data collection, validation, and research clarification.
Primary Interviews and Surveys
Primary work is used to pressure-test what desk sources cannot fully explain, especially around pricing mechanics, channel share, and mix shifts by nut type. We speak with processors, brand and private-label participants, distributors, and foodservice-oriented sellers, then loop in procurement and category roles to check demand patterns and substitution effects across key nut types. Since this is a United States study, the fieldwork focuses on nationwide selling dynamics rather than regional splits, and we revisit expert inputs when large crop or price changes show up in the model.
Distribution of primary research fieldwork respondents
| Company type | Respondent position |
|---|---|
| Top tier: 28% | CXOs: 13% |
| Mid tier: 50% | Functional/Unit leaders: 40% |
| Smaller Players: 22% | Managers: 47% |
Market-Sizing & Forecasting
Sizing starts with a top-down build where US consumption is reconstructed from the available demand pool, using production, trade, and utilization signals as the anchors, and then it is translated into value using observed pricing movements and channel-level markups. To keep the totals realistic, we corroborate the outcome with selective bottom-up approximations, such as sampled average selling price by nut type multiplied by inferred volumes, and supplier and distributor roll-ups where coverage is clear.
Key inputs that were tracked include USDA utilization and acreage trends for major nuts, import and export movements by product category, packaged nuts price progression seen through trade and retail disclosures, shifts between on-trade and off-trade demand, and the mix change between conventional and organic offerings. Where data points were missing, gaps were handled by using short run proxy series, such as nearby-year yield and price patterns, followed by interview-based adjustments when market participants pointed to temporary disruptions.
For forecasting, we rely on scenario analysis supported by simple regression checks, because crop cycles, weather-linked swings, and pricing volatility can bend the trend in ways a straight-line approach misses. Assumptions on volume growth and pricing are reviewed with primary respondents so the forward path stays consistent with planting decisions, carryover stocks, and expected channel demand.
Data Validation & Update Cycle
Outputs are validated through multiple checks, so the estimate is not driven by a single data series. We compare implied per-capita consumption trends, trade balance movements, and price-to-volume relationships, then review outliers before the model is finalized.
If a large variance shows up, such as a sudden swing in utilized value or an unusual import spike, analysts re-check the underlying series and re-contact relevant interviewees to confirm what changed. Reports are refreshed annually, with interim updates when material events occur, and a final pre-delivery review is completed so clients receive the most current view available.
Mordor Intelligence's United States Nuts Market Size Compared Against Other Published Estimates
Published market numbers for nuts in the United States can look far apart because the counting point is not always the same, and because some sources lean more on farm-side value while others focus on retail and foodservice selling value. Differences also show up when studies mix nuts with seeds, include processed nut ingredients, or apply different price and currency timing.
The main gap comes from whether USDA-style utilized crop value is treated as the market, where Mordor Intelligence counts edible nuts sold through on-trade and off-trade channels and excludes nut oils and industrial nut-derived ingredients.
Benchmark comparison
| Source | Market Size | Gaps in Research Methodology |
|---|---|---|
| Mordor Intelligence | USD 8.84 B (2025) | |
| Industry Trade Outlet A | USD 13.10 B (2025) | This figure is based on utilized value for tree nut crops, which reflects crop value at the utilization stage and can exclude retail and foodservice markups, and it also may not align with an edible-nuts channel scope that includes both peanuts and tree nuts. |
| Newswire Summary B | USD 10.98 B (2025) | This estimate appears to use a broader packaged and processed scope and a different pricing build, and it is not clearly reconciled back to observable US production and trade checks, which can lift the counted value versus a tighter edible-nuts selling scope. |
The spread across the table is mainly explained by where value is captured in the chain and by which adjacent product forms are included. Our checks across utilization, trade flows, and interview-led price logic help keep the total traceable to repeatable variables during each refresh.
Key Questions Answered in the Report
What is the current value of the United States nuts market?
The market is valued at USD 9.38 billion in 2026 and is projected to reach USD 12.63 billion by 2031.
Which nut type holds the largest share?
Almonds lead with 29.05% of sales in 2025, benefiting from California’s large-scale orchards.
Which distribution channel is growing the fastest?
Online retail is forecast to post a 6.78% CAGR through 2031 owing to subscription models and direct-to-consumer shipping.
How fast is the organic segment expanding?
Organic nuts are expected to grow at a 6.49% CAGR, supported by expanding certified acreage and USDA transition subsidies.