Market Overview
| Study Period | 2017 - 2030 |
|---|---|
| Base Year For Estimation | 2024 |
| Forecast Data Period | 2025 - 2030 |
| Market Size (2025) | USD 184.7 Million |
| Market Size (2030) | USD 238.5 Million |
| Growth Rate (2025 - 2030) | 5.24% CAGR |
| Market Concentration | Medium |
Major Players*Disclaimer: Major Players sorted in no particular order Image © Mordor Intelligence. Reuse requires attribution under CC BY 4.0. | |

United States Milk Protein Market Analysis by Mordor Intelligence
The United States Milk Protein Market size is estimated at 184.7 million USD in 2025, and is expected to reach 238.5 million USD by 2030, growing at a CAGR of 5.24% during the forecast period (2025-2030).
The U.S. milk protein market is experiencing significant transformation driven by changing consumer preferences and health consciousness. Traditional dairy protein sources continue to maintain their stronghold, with approximately 80% of U.S. adult consumers in 2022 preferring conventional protein sources like dairy, meat, and poultry. This preference has prompted manufacturers to focus on product innovation and quality improvements in milk protein formulations. The industry has witnessed a notable shift toward clean-label products, with manufacturers increasingly emphasizing natural ingredients and transparent sourcing practices to meet consumer demands for healthier options.
The supplements sector has emerged as a crucial growth driver in the milk protein market, reflecting broader wellness trends. Recent data indicates that approximately 75% of Americans incorporate dietary supplements into their daily routines, with a notable gender distribution showing 79% of female adults and 74% of male adults consuming at least one form of protein supplement with their diet. The sports nutrition segment has become particularly significant, contributing 28% to the overall supplement consumption volume in the country. This trend has sparked innovation among manufacturers, with companies like FrieslandCampina Ingredients and AMCO Proteins introducing specialized products such as MPI 90 and MPC 85 targeting the performance and active nutrition spaces.
Product innovation and flavor diversification have become key strategies in the milk protein market. In 2022, approximately 41% of U.S. consumers expressed interest in experimenting with new flavors and ingredients similar to their favorites, particularly in applications like sauces and dressings. This consumer openness to innovation has encouraged manufacturers to develop novel formulations and applications for protein ingredients, expanding beyond traditional usage areas into newer product categories and formats.
The industry is witnessing a significant shift toward portion control and nutritional transparency in product formulations. This trend is particularly evident in the confectionery sector, where approximately 85% of chocolates and candies sold in 2022 were packaged in formats containing 200 calories or less, regardless of whether they were individual or multi-pack offerings. This development reflects a broader industry movement toward health-conscious product formulations, with manufacturers increasingly incorporating nutritional protein to enhance nutritional profiles while maintaining taste and texture preferences. The focus on nutritional value has led to increased innovation in functional protein-fortified products across various food categories, particularly in snacks and ready-to-eat items.
United States Milk Protein Market Trends and Insights
Sport/performance nutrition is expected to witness significant growth during the forecast period
- Rising health concerns and memberships across health clubs are primarily driving the sport/performance nutrition segment. From 2009 to 2019, the number of gyms in the United States rose by 39%. However, the segment witnessed a significant decline due to gym closures during the COVID-19 pandemic-induced nationwide lockdown in 2020. Health clubs are among the most popular sales channels for sports supplements. The closure of health clubs had a negative impact on the sales of supplements. In 2020, several gyms like Gold's Gym, Flywheel Sports, Town Sports International, and 24-Hour Fitness declared bankruptcy. Sales of sports nutrition products decreased in 2020, and the segment’s overall Y-o-Y growth rate reduced by 3.37%.
- The importance of leading an active lifestyle is fueling the sports/performance nutrition segment. In 2021, 67% of US consumers aged six and above participated in fitness activities, of which 43.3% of consumers engaged in individual sports, 52.9% in outdoor sports, and 22.1% in team sports. Consumers are becoming more aware of the value of optimal nutrition and healthier lifestyles, all of which positively impact the sports/performance nutrition segment.
- Sports/performance nutrition is the fastest-growing end-user segment in the US whey protein market, of which animal protein accounts for a major share of 91.1% in terms of value. The fitness industry is rapidly increasing the usage of animal protein ingredients, such as whey, collagen, and milk proteins, in nutritional supplements used for muscle or tissue repair after workouts. The rise in the availability of protein supplements, a growth in the number of recreational and lifestyle users of these products, and an increase in health awareness are expected to boost market growth over the forecast period.

Understand The Key Trends Shaping This Market
Download PDF
The United States is aiming to focus on milk production
- The graph depicts the total production of cow milk and goat milk, which are considered common raw materials for milk proteins. In 2023, 2,408,7 pounds of milk was produced per cow, an increase of 1.30% from 23,777 pounds in 2020. As of 2022, the average number of milk cows in the United States was 9,402 heads. Milk is usually separated through various processes into components and processed into fluid beverage milk or raw material for other dairy products.
- The consumption of dairy ingredients in the United States has increased over the past few years, and the milk supply is mainly used to produce dairy products and ingredients, including proteins. A total of 17.4 billion pounds of milk were produced in 24 main states (like Arizona, California, and Colorado) in February 2024, up by 2.4% from February 2023. The number of milk cows on farms in the 24 major states was 8.88 million, 61,000 head less than in February 2023 but 8,000 head more than in January 2024. The production per cow in the 24 major states averaged 1,955 pounds for February 2024, 58 pounds above February 2023.
- Goat milk production in the United States has experienced continuous expansion over the last decade. The largest number of milk goats are found in Wisconsin and California, followed by Iowa, Pennsylvania, and New York. Milk produced by goat dairies has various applications, including feeding goat kids, feeding other livestock, such as lambs, veal calves, or piglets, personal consumption, and making goat milk products. Goat milk is used in food products such as candy, yogurt, and ice cream. Due to goat milk’s unique nutritional and biochemical properties, it is also used in soaps and lotions.

Understand The Key Trends Shaping This Market
Download PDF
OTHER KEY INDUSTRY TRENDS COVERED IN THE REPORT
- Baby food is expected to witness steady growth post-pandemic
- Innovation is expected to help maintain a steady growth rate
- Consumer preferences are shifting to premium condiments and sauces, away from packaged soups
- Dairy alternatives are expected to witness a significant growth rate
- There are great opportunities for meat alternative products
- Key players focused more on healthy ingredients post-COVID-19
- The US cosmetics industry is expected to be driven by the synergy of innovation and social media influence
- The growth of the bakery industry is led by large commercial players
- Sustainable and innovative packaging trends are expected to influence the breakfast cereal market
- Key players are expected to focus on fortification and nutritional enrichment
- The emphasis on awareness and innovation is the driving force behind the growth of the elderly nutrition market
- E-commerce is expected to emerge as one of the most preferred channels
- Rising US feed exports and feed prices are expected to impact production
- The consumption growth of animal protein fuels opportunities for key players in the ingredients segment
Segment Analysis: Form
Isolates Segment in US Milk Protein Market
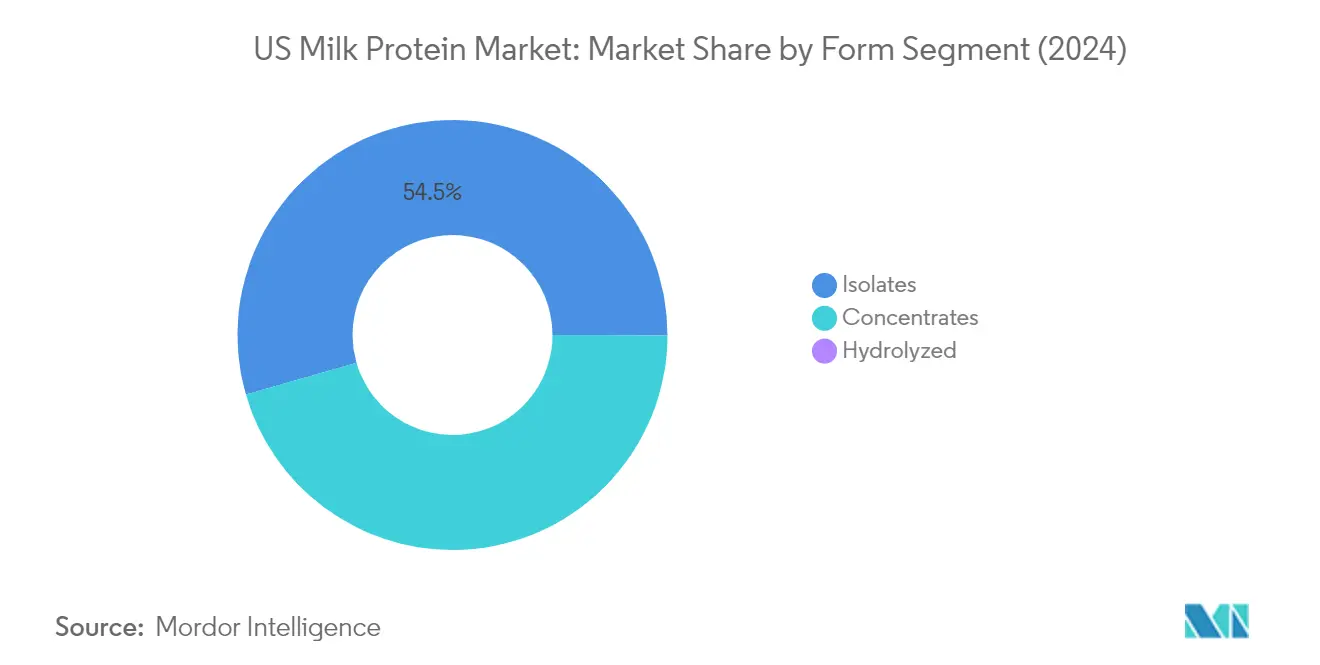
The milk protein isolate segment dominates the US milk protein market, commanding approximately 54% market share in 2024. This significant market position is primarily attributed to milk protein isolates' high purity levels reaching up to 90%, compared to concentrates which max out at 85% purity. The segment's dominance is further strengthened by its suitability for lactose-intolerant consumers, who make up about 36% of the US population. Milk protein isolates have gained particular traction in the sports nutrition sector, accounting for nearly 60% of applications by value. Their extensive functionality has also driven adoption across various food and beverage applications, with significant usage in snacks (43%), bread (27.4%), and beverages (21%). The segment's growth is supported by manufacturers' continued innovation in protein-enriched products like cookies, protein wafers, protein donuts, cake mixes, puffs, crisps, and bars to meet increasing protein demand in the United States.
Hydrolyzed Segment in US Milk Protein Market
The milk protein hydrolysate segment is projected to exhibit the strongest growth trajectory in the US market from 2024 to 2029, with an expected CAGR of approximately 6%. This accelerated growth is primarily driven by its expanding applications in the personal care and cosmetics industry, where it serves as a moisturizing agent, conditioning agent, and repairing agent. The segment's growth potential is enhanced by milk protein hydrolysates' superior penetration capabilities into the skin compared to other forms of milk protein, making them particularly valuable in skincare formulations. Despite having the smallest current market share, hydrolyzed milk proteins are increasingly being incorporated into various personal care products, including facial wash, body wash, shower gel, hand wash, antibacterial soap, and facial masks. Major skincare brands like OGX, Aveeno, Dove Ultracare, and Hask Greek have been actively launching products fortified with milk protein hydrolysates, further driving segment growth.
Remaining Segments in Form Segmentation
The milk protein concentrate segment represents a significant portion of the US milk protein market, offering a balance between functionality and cost-effectiveness. Milk protein concentrates are widely utilized in breakfast cereals, sports nutrition, and infant formula due to their versatile applications and lower price point compared to isolates. The segment's impact on the market is particularly notable in protein-fortified foods, where manufacturers value concentrates for their flavor enhancement capabilities and functional properties like high protein content and low lactose levels. Their adaptability in various food applications and cost-effectiveness continue to make them an essential component of the US milk protein market landscape.
Segment Analysis: End User
Supplements Segment in US Milk Protein Market
The supplements segment maintains a dominant position in the US milk protein market, commanding approximately 67% market share in 2024, while also exhibiting the strongest growth trajectory with a projected growth rate of around 6% during 2024-2029. This segment's leadership is primarily driven by the substantial growth in key application sectors like medicinal and sports nutrition supplements, with sports nutrition accounting for nearly 49% of the supplements market. The rising prevalence of chronic illnesses among US adults, with over 28% reporting at least two chronic medical conditions, has significantly boosted the demand for protein supplements. Sports nutrition products, particularly protein powders which constitute about 53% of sports nutrition sales, continue to drive segment growth. The segment's robust performance is further supported by stringent FDA regulations ensuring product quality, especially in baby food applications where milk proteins represent 60-80% of formula composition, along with increasing consumer awareness about the benefits of protein supplementation.
Remaining Segments in End User Market
The food and beverages segment represents the second-largest end-user category, driven by diverse applications across bakery products, beverages, breakfast cereals, and snacks. Animal feed applications constitute another significant segment, particularly in livestock nutrition and pet food formulations, benefiting from the growing focus on animal health and nutrition. The personal care and cosmetics segment, while smaller, shows promising growth potential due to increasing incorporation of milk proteins in skincare and beauty products, particularly in hydrolyzed form for its skin-hydrating properties. These segments collectively complement the market's growth, each serving distinct consumer needs and applications while benefiting from ongoing product innovations and expanding distribution channels.
Competitive Landscape
Top Companies in United States Milk Protein Market
The milk protein market in the United States is characterized by companies focusing heavily on product innovations and strategic expansions to maintain their competitive positions. Milk protein manufacturers are consistently developing new protein variants targeting specific applications like sports nutrition, infant formula, and functional foods. Operational agility is demonstrated through investments in manufacturing intelligence and real-time analytics to optimize production processes. Companies are establishing strategic partnerships with local manufacturers and distributors to strengthen their distribution networks and market presence. The industry witnesses regular facility expansions and capacity enhancement projects to meet growing demand, while research and development partnerships are formed to develop novel protein solutions. Many players are also pursuing vertical integration strategies by acquiring or partnering with dairy farms to ensure a consistent raw material supply.
Consolidated Market Led By Global Players
The United States milk protein market structure is characterized by the strong presence of global dairy conglomerates and specialized milk protein manufacturers. Major players like Kerry Group, Glanbia, and Arla Foods maintain significant market shares through their extensive product portfolios and established distribution networks. The market demonstrates a high level of consolidation, with the top five players accounting for a substantial portion of the total market share. These companies leverage their global research capabilities and technological expertise to maintain their competitive advantage in the market.
The industry has witnessed numerous strategic acquisitions and mergers aimed at expanding product portfolios and strengthening market positions. Large dairy cooperatives are increasingly acquiring smaller, specialized protein manufacturers to enhance their technological capabilities and expand their customer base. Companies are also forming strategic alliances with research institutions and technology providers to develop innovative protein solutions. The market is seeing increased participation from international players looking to establish their presence in the lucrative US market through acquisitions and joint ventures with local companies.
Innovation and Customization Drive Future Success
Success in the milk protein market increasingly depends on companies' ability to develop specialized solutions for specific end-user applications. Manufacturers need to focus on creating customized protein ingredients solutions that address specific functional requirements in various applications, from sports nutrition to infant formula. Companies must invest in advanced processing technologies and research capabilities to develop novel protein formats and improve functionality. Building strong relationships with key end-users through technical support and collaborative product development is becoming crucial for maintaining market position.
Future market success will require companies to address growing consumer demands for clean label products and sustainable production practices. Players must invest in sustainable sourcing practices and transparent supply chains to meet evolving regulatory requirements and consumer preferences. The ability to offer competitive pricing while maintaining product quality will be crucial, particularly in segments with high price sensitivity. Companies need to develop robust distribution networks and maintain strong relationships with dairy farmers to ensure a consistent supply of high-quality raw materials. Additionally, manufacturers must stay ahead of potential regulatory changes regarding protein content claims and labeling requirements while maintaining flexibility to adapt to changing market conditions. The integration of dairy ingredients and dairy protein into product lines will further enhance market appeal.
United States Milk Protein Industry Leaders
Arla Foods amba
Fonterra Co-operative Group Limited
FrieslandCampina Ingredients
Glanbia PLC
Kerry Group PLC
- *Disclaimer: Major Players sorted in no particular order

Need More Details on Market Players and Competitors?
Download PDF
Recent Industry Developments
- January 2022: Hoogwegt entered a long-term strategic partnership with Royal A-ware to sell milk powders and creams produced by Royal A-ware. The collaboration strengthens the core activities of the companies.
- August 2021: Arla Foods AmbA launched a micellar casein isolate called MicelPure™ Milk Protein, which comes in standard and organic versions. The product contains 87% native proteins.
- August 2021: Milk Specialties Global acquired the 96,000-square-foot Kay’s Processing facility in Minnesota, as well as Kay’s Naturals high-protein and gluten-free snack brand. This is the 11th plant of the company that has been renamed Milk Specialties Global Clara City Facility.
United States Milk Protein Market Report Scope
Concentrates, Hydrolyzed, Isolates are covered as segments by Form. Animal Feed, Food and Beverages, Personal Care and Cosmetics, Supplements are covered as segments by End User.Form
| Concentrates |
| Hydrolyzed |
| Isolates |
End User
| Animal Feed | ||
| Food and Beverages | By Sub End User | Bakery |
| Beverages | ||
| Breakfast Cereals | ||
| Condiments/Sauces | ||
| Dairy and Dairy Alternative Products | ||
| RTE/RTC Food Products | ||
| Snacks | ||
| Personal Care and Cosmetics | ||
| Supplements | By Sub End User | Baby Food and Infant Formula |
| Elderly Nutrition and Medical Nutrition | ||
| Sport/Performance Nutrition | ||
| Form | Concentrates | ||
| Hydrolyzed | |||
| Isolates | |||
| End User | Animal Feed | ||
| Food and Beverages | By Sub End User | Bakery | |
| Beverages | |||
| Breakfast Cereals | |||
| Condiments/Sauces | |||
| Dairy and Dairy Alternative Products | |||
| RTE/RTC Food Products | |||
| Snacks | |||
| Personal Care and Cosmetics | |||
| Supplements | By Sub End User | Baby Food and Infant Formula | |
| Elderly Nutrition and Medical Nutrition | |||
| Sport/Performance Nutrition | |||
Need A Different Region or Segment?
Customize Now
Market Definition
- End User - The Protein Ingredients Market operates on a B2B basis. Food, Beverages, Supplements, Animal Feed, and Personal Care & Cosmetic manufacturers are considered to be end-consumers in the market studied. The scope excludes manufacturers buying liquid/dry whey to be used for application as a binding agent or thickener or other non-protein applications.
- Penetration Rate - Penetration Rate is defined as the percentage of Protein-Fortified End User Market Volume in the Overall End User Market Volume.
- Average Protein Content - Average protein content is the average protein content present per 100 g of product manufactured by all end-user companies considered under the scope of this report.
- End User Market Volume - End-user market volume is the consolidated volume of all types and forms of end-user products in the country or region.
| Keyword | Definition |
|---|---|
| Alpha-lactalbumin (α-Lactalbumin) | It is a protein that regulates the production of lactose in the milk of almost all mammalian species. |
| Amino acid | It is an organic compound that contains both amino and carboxylic acid functional groups, which are required for the synthesis of body protein and other important nitrogen-containing compounds, such as creatine, peptide hormones, and some neurotransmitters. |
| Blanching | It is the process of briefly heating vegetables with steam or boiling water. |
| BRC | British Retail Consortium |
| Bread improver | It is a flour-based blend of several components with specific functional properties designed to modify dough characteristics and give quality attributes to bread. |
| BSF | Black Soldier Fly |
| Caseinate | It is a substance produced by adding an alkali to acid casein, a derivative of casein. |
| Celiac disease | Celiac disease is an immune reaction to eating gluten, a protein found in wheat, barley, and rye. |
| Colostrum | It is a milky fluid that’s released by mammals that have recently given birth before breast milk production begins. |
| Concentrate | It is the least processed form of protein and has a protein content ranging from 40-90% by weight. |
| Dry protein basis | It refers to the percentage of "pure protein" present in a supplement after the water in it is completely removed through heat. |
| Dry whey | It is the product resulting from drying fresh whey which has been pasteurized and to which nothing has been added as a preservative. |
| Egg protein | It is a mixture of individual proteins, including ovalbumin, ovomucoid, ovoglobulin, conalbumin, vitellin, and vitellenin. |
| Emulsifier | It is a food additive that facilitates the blending of foods that are immiscible with one another, such as oil and water. |
| Enrichment | It is the process of addition of micronutrients that are lost during the processing of the product. |
| ERS | Economic Research Service of the USDA |
| Extrusion | It is the process of forcing soft mixed ingredients through an opening in a perforated plate or die designed to produce the required shape. The extruded food is then cut to a specific size by blades. |
| Fava | Also known as Faba, it is another word for yellow split beans. |
| FDA | Food and Drug Administration |
| Flaking | It is a process in which typically a cereal grain (like corn, wheat, or rice) is broken down into grits, cooked with flavors and syrups, and then pressed into flakes between cooled rollers. |
| Foaming agent | It is a food ingredient that makes it possible to form or maintain a uniform dispersion of a gaseous phase in a liquid or solid food. |
| Foodservice | It refers to the part of the food industry which includes businesses, institutions, and companies which prepare meals outside the home. It includes restaurants, school and hospital cafeterias, catering operations, and many other formats. |
| Fortification | It is the deliberate addition of micronutrients that are not found in them naturally or which are lost during processing, to improve a food product's nutritional value. |
| FSANZ | Food Standards Australia New Zealand |
| FSIS | Food Safety and Inspection Service |
| FSSAI | Food Safety and Standards Authority of India |
| Gelling agent | It is an ingredient that functions as a stabilizer and thickener to provide thickening without stiffness through the formation of gel. |
| GHG | Greenhouse Gas |
| Gluten | It is a family of proteins found in grains, including wheat, rye, spelt, and barley. |
| Hemp | It is a botanical class of Cannabis sativa cultivars grown specifically for industrial or medicinal use. |
| Hydrolysate | It is a form of protein manufactured by exposing the protein to enzymes that can partially break the bonds between the protein's amino acids and break down large, complicated proteins into smaller pieces. Its processing makes it easier and quicker to digest. |
| Hypoallergenic | It refers to a substance that causes fewer allergic reactions. |
| Isolate | It is the purest and most processed form of protein which has undergone separation to obtain a pure protein fraction. It typically contains ≥ 90% of protein by weight. |
| Keratin | It is a protein that helps form hair, nails, and the outer layer of skin. |
| Lactalbumin | It is the albumin contained in milk and obtained from whey. |
| Lactoferrin | It is an iron‑binding glycoprotein that is present in the milk of most mammals. |
| Lupin | It is the yellow legume seeds of the genus Lupinus. |
| Millenial | Also known as Generation Y or Gen Y, it refers to the people born from 1981 to 1996. |
| Monogastric | It refers to an animal with a single-compartmented stomach. Examples of monogastric include humans, poultry, pigs, horses, rabbits, dogs, and cats. Most monogastric are generally unable to digest much cellulose food materials such as grasses. |
| MPC | Milk protein concentrate |
| MPI | Milk protein isolate |
| MSPI | Methylated soy protein isolate |
| Mycoprotein | Mycoprotein is a form of single-cell protein, also known as fungal protein, derived from fungi for human consumption. |
| Nutricosmetics | It is a category of products and ingredients that act as nutritional supplements to care for skin, nails, and hair natural beauty. |
| Osteoporosis | It is a medical condition in which the bones become brittle and fragile from loss of tissue, typically as a result of hormonal changes, or deficiency of calcium or vitamin D. |
| PDCAAS | Protein digestibility-corrected amino acid score (PDCAAS) is a method of evaluating the quality of a protein based on both the amino acid requirements of humans and their ability to digest it. |
| Per-capita consumption of animal protein | It is the average amount of animal protein (such as milk, whey, gelatin, collagen, and egg proteins) that is readily available for consumption by each person in an actual population. |
| Per-capita consumption of plant protein | It is the average amount of plant protein (such as soy, wheat, pea, oat, and hemp proteins) that is readily available for consumption by each person in an actual population. |
| Quorn | It is a microbial protein manufactured using mycoprotein as an ingredient, in which the fungus culture is dried and mixed with egg albumen or potato protein, which acts as a binder, and then is adjusted in texture and pressed into various forms. |
| Ready-to-Cook (RTC) | It refers to food products that include all of the ingredients, where some preparation or cooking is required through a process that is given on the package. |
| Ready-to-Eat (RTE) | It refers to a food product prepared or cooked in advance, with no further cooking or preparation required before being eaten. |
| RTD | Ready-to-Drink |
| RTS | Ready-to-Serve |
| Saturated fat | It is a type of fat in which the fatty acid chains have all single bonds. It is generally considered unhealthy. |
| Sausage | It is a meat product made of finely chopped and seasoned meat, which may be fresh, smoked, or pickled and which is then usually stuffed into a casing. |
| Seitan | It is a plant-based meat substitute made out of wheat gluten. |
| Softgel | It is a gelatin-based capsule with a liquid fill. |
| SPC | Soy protein concentrate |
| SPI | Soy protein isolate |
| Spirulina | It is a biomass of cyanobacteria that can be consumed by humans and animals. |
| Stabilizer | It is an ingredient added to food products to help maintain or enhance their original texture, and physical and chemical characteristics. |
| Supplementation | It is the consumption or provision of concentrated sources of nutrients or other substances that are intended to supplement nutrients in the diet and is intended to correct nutritional deficiencies. |
| Texturant | It is a specific type of food ingredient that is used to control and alter the mouthfeel and texture of food and beverage products. |
| Thickener | It is an ingredient that is used to increase the viscosity of a liquid or dough and make it thicker, without substantially changing its other properties. |
| Trans fat | Also called trans-unsaturated fatty acids or trans fatty acids, it is a type of unsaturated fat that naturally occurs in small amounts in meat. |
| TSP | Textured soy protein |
| TVP | Textured vegetable protein |
| WPC | Whey protein concentrate |
| WPI | Whey protein isolate |
Need More Details on Market Definition?
Ask a Question
Research Methodology
Mordor Intelligence follows a four-step methodology in all our reports.
- Step-1: Identify Key Variables: The quantifiable key variables (industry and extraneous) pertaining to the specific product segment and country are selected from a group of relevant variables & factors based on desk research & literature review; along with primary expert inputs. These variables are further confirmed through regression modeling (wherever required).
- Step-2: Build a Market Model: In order to build a robust forecasting methodology, the variables and factors identified in Step-1 are tested against available historical market numbers. Through an iterative process, the variables required for market forecast are set and the model is built on the basis of these variables.
- Step-3: Validate and Finalize: In this important step, all market numbers, variables and analyst calls are validated through an extensive network of primary research experts from the market studied. The respondents are selected across levels and functions to generate a holistic picture of the market studied.
- Step-4: Research Outputs: Syndicated Reports, Custom Consulting Assignments, Databases & Subscription Platforms

Get More Details On Research Methodology
Download PDF


