
Market Overview
| Study Period | 2020 - 2031 |
|---|---|
| Forecast Data Period | 2026 - 2031 |
| Base Year Market Size (2025) | USD 3.66 Billion |
| Market Size (2026) | USD 3.79 Billion |
| Market Size (2031) | USD 4.53 Billion |
| Growth Rate (2026 - 2031) | 3.62 % |
| Market Concentration | Low |
Major Players *Disclaimer: Major Players sorted in no particular order Image © Mordor Intelligence. Reuse requires attribution under CC BY 4.0. | |
US Microwave Oven Market Analysis by Mordor Intelligence
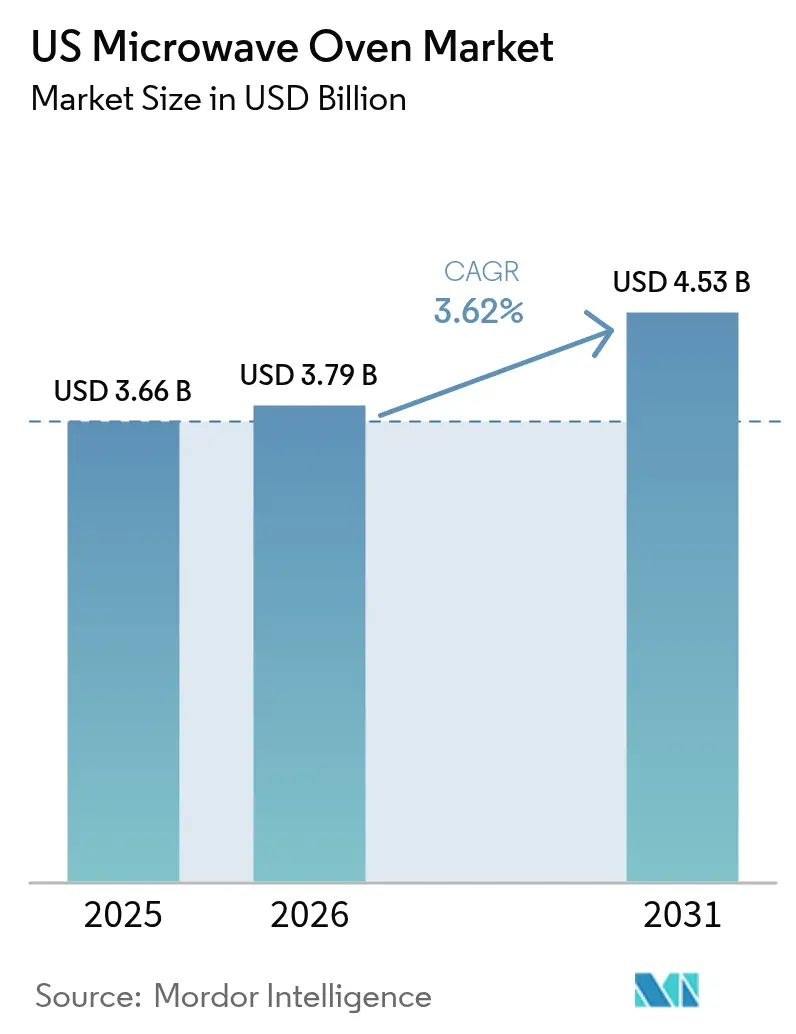
The US microwave oven market size is expected to grow from USD 3.66 billion in 2025 to USD 3.79 billion in 2026 and is forecast to reach USD 4.53 billion by 2031 at 3.62% CAGR over 2026-2031. Replacement demand is accelerating as households upgrade to connected models ahead of the Department of Energy’s 2028 efficiency mandate, while urban lifestyles continue to favor ready-to-eat meals that rely on rapid reheating. Smart-home adoption, especially in technology-oriented metropolitan areas, positions the US microwave oven market as a gateway for broader kitchen digitization. Manufacturers are reshoring selected production lines to mitigate tariff exposure and shorten supply chains, which supports resilience against global logistics shocks. At the same time, sustained housing starts in the Southeast and migration toward Sun Belt states add a structural boost to first-time appliance purchases.
Key Report Takeaways
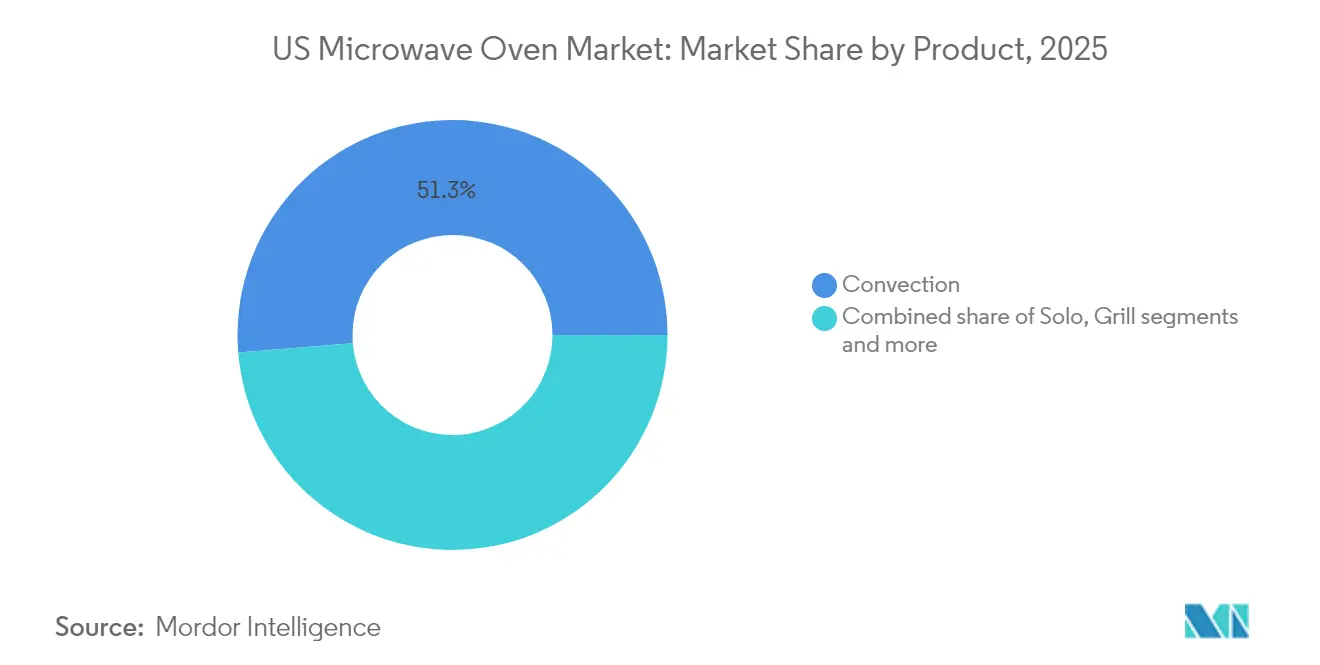
- By product, convection microwaves led with 51.30% revenue share in 2025; grill variants are projected to expand at a 3.82% CAGR through 2031.
- By structure, countertop units held 64.40% of the US microwave oven market share in 2025, while built-in installations are set to grow at a 4.18% CAGR to 2031.
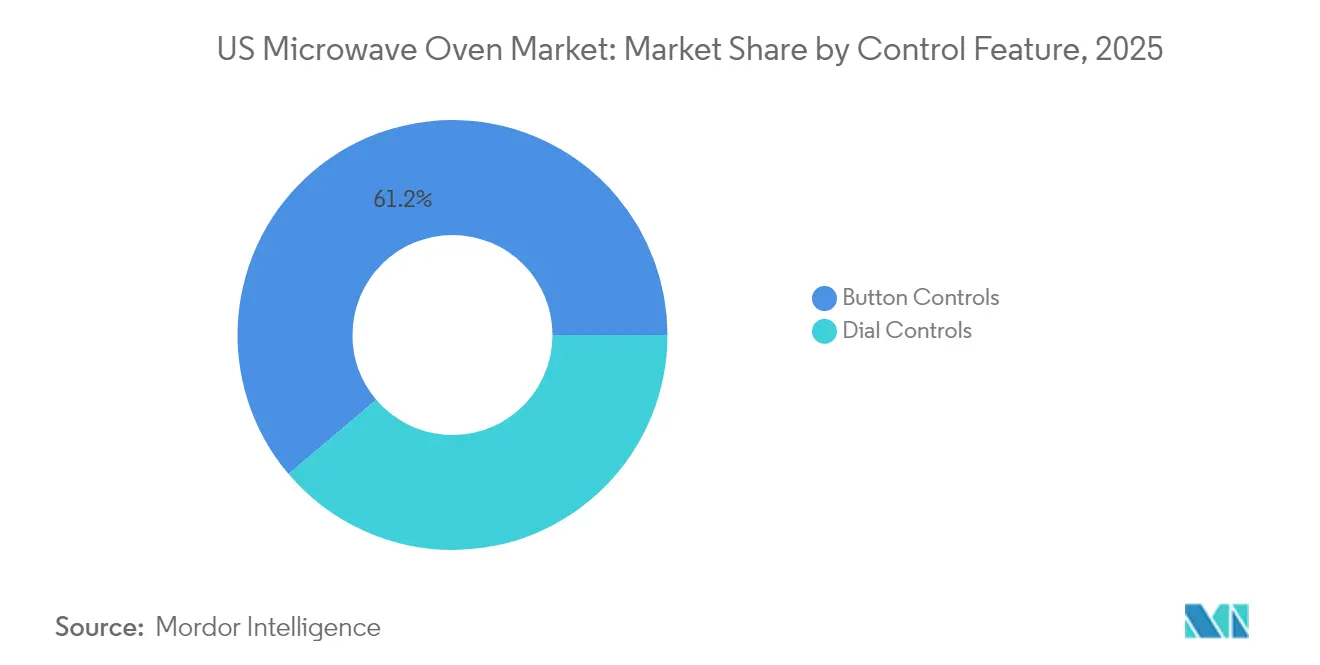
- By control feature, button-based interfaces accounted for 61.20% share of the US microwave oven market size in 2025 and are advancing at a 4.12% CAGR through 2031.
- By capacity, the 25–29 liter segment commanded 35.60% share of the US microwave oven market size in 2025, whereas ≥30 liter models will rise at a 4.01% CAGR between 2026-2031.
- By application, the residential segment captured 69.30% revenue share in 2025; commercial usage is the fastest-growing application at a 3.36% CAGR through 2031.
- By distribution, multi-brand stores retained 39.40% share in 2025, though online channels are forecast to grow at a 4.28% CAGR to 2031.
- By geography, Southeast retained 31.60% share in 2025, though West is forecast to grow at a 3.74% CAGR to 2031.
Note: Market size and forecast figures in this report are generated using Mordor Intelligence’s proprietary estimation framework, updated with the latest available data and insights as of 2026.
US Microwave Oven Market Trends and Insights
Drivers Impact Analysis*
| Driver | (~) % Impact on CAGR Forecast | Geographic Relevance | Impact Timeline |
|---|---|---|---|
| Urbanization & demand for ready-to-eat meals | +1.2% | Nationwide; strongest in Southeast and West | Medium term (2-4 years) |
| Rise of smart/connected kitchen appliances | +0.9% | National; early uptake in West and Northeast | Long term (≥ 4 years) |
| Expansion of omni-channel & e-commerce retail | +0.7% | Urban centers nationwide | Short term (≤ 2 years) |
| Product innovation in convection/combi ovens | +0.6% | Nationwide; premium segments | Medium term (2-4 years) |
| DOE energy-efficiency standards | +0.5% | Nationwide; regulatory compliance | Short term (≤ 2 years) |
| Source: Mordor Intelligence | |||
Urbanization & Demand For Ready-To-Eat Meals
Accelerating migration toward city centers shortens daily cooking windows, prompting millennials and Gen Z to allocate a higher share of food budgets to prepared items. Consumers who prepare quick meals rely on microwave ovens to reheat premium frozen entrées that replicate restaurant quality[1]U.S. Department of Agriculture, “Food Expenditure Series,” usda.gov . Time-pressed households spend fewer minutes on meal preparation than previous generations, reinforcing sustained demand for multifunction models that combine convection and sensor capabilities. Convenience culture is also filtering into small commercial formats such as coffee shops and coworking pantries, where speed ovens improve order throughput. These patterns bolster unit sales in the US microwave oven market while pushing manufacturers to refine preset programs tailored to frozen and grab-and-go fare.
Rise of Smart/Connected Kitchen Appliances
WiFi-enabled microwaves have evolved from novelty to norm as consumers seek remote control, over-the-air updates, and voice integration. LG’s camera-equipped line, launched in January 2025, showcases real-time food monitoring and AI cooking guidance. Platforms such as GE Appliances’ SmartHQ suggest recipes, adjust power levels, and coordinate with energy-management panels, aligning appliance usage with off-peak tariffs.[2]GE Appliances, “SmartHQ Platform Expands Voice and Recipe Features,” geappliances.com Patent filings indicate active development of interference mitigation solutions that allow uninterrupted home-network performance during microwave operation. Commercial kitchens mirror this transition by adopting high-speed ovens that blend inverter microwave technology with true convection, reducing cook times by two-thirds. Collectively, connected features lift the value mix within the US microwave oven market and support price premiums that offset raw-material inflation.
Product Innovation In Convection/Combi Ovens
Convergence of microwave, air-fry and convection technologies helps households consolidate countertop appliances. Whirlpool’s over-the-range series with integrated air-fry is emblematic of “three-in-one” design that frees up space while expanding cooking modes. Panasonic’s 4-in-1 HomeCHEF adds guided-cooking connectivity at a mid-premium price point, proving that value-added features need not push units into luxury tiers. Inverter circuitry further improves energy efficiency and heat distribution, addressing consumer concerns over uneven reheating. Within professional kitchens, similar hybrid ovens support rapid service and menu versatility, broadening the addressable opportunity for manufacturers. Innovation momentum therefore sustains ASP growth in the US microwave oven market despite fierce entry-level price competition.
DOE Energy-Efficiency Standards Driving Replacement Sales
Finalized rules cap standby power at 0.6 watts for microwave-only models manufactured after June 2026. Brands are revamping line-ups ahead of the deadline, prompting retailers to clear legacy inventory and incentivize early upgrades. Consumers benefit from lower running costs, especially in regions with high kWh tariffs, reinforcing a payback narrative for efficient products. Solid-state RF heating is under evaluation as a magnetron alternative that could unlock further energy savings, though adoption hinges on cost curves. For the US microwave oven market, the near-term pull-forward of replacement purchases modestly lifts volumes while catalyzing longer-term technology refresh cycles.
Restraints Impact Analysis*
| Restraint | (~) % Impact on CAGR Forecast | Geographic Relevance | Impact Timeline |
|---|---|---|---|
| High power use and rising electricity bills | -0.8% | Nationwide, especially in states with steep utility rates | Medium term (2-4 years) |
| Fierce price wars squeezing profit margins | -0.6% | Nationwide, most acute in value-driven consumer segments | Short term (≤ 2 years) |
| Tougher e-waste and extended-producer-responsibility rules | -0.4% | Nationwide, with early adoption in California and several Northeast states | Long term (≥ 4 years) |
| Source: Mordor Intelligence | |||
High Power Consumption & Energy-Cost Concerns
Electricity costs vary widely across the United States, making wattage a rising purchase criterion in coastal metros where tariffs exceed the national mean. Commercial units that draw more than 2,000 watts face scrutiny from operators pursuing lower utility bills. Compliance spending tied to the 2026 standard raises bill-of-materials costs that may flow through to retail prices. Although inverter and insulation enhancements improve efficiency, these features add complexity that limits price competitiveness in mass segments. The gap between premium energy-savvy models and basic imports could widen, curbing volume growth if economic conditions tighten.
Sharp Price Competition Compressing Margins
Countertop units remain highly substitutable, and more than 90% of them are imported, leaving manufacturers exposed to currency swings and trade policy shifts. Tariffs have lifted input costs by up to 25%, yet consumer price sensitivity restricts full pass-through. Retailers respond with aggressive promotions, and private-label offerings from big-box chains undercut branded SKUs. Chinese entrants such as Midea and Haier continue to capture share through scale and cost leadership, pressuring incumbent margins. In this context, differentiation around smart functions and design aesthetics is critical but raises R&D expenses, squeezing profitability in the US microwave oven market.
*Our forecasts treat driver/restraint impacts as directional, not additive. The impact forecasts reflect baseline growth, mix effects, and variable interactions.
Segment Analysis
By Product: Convection Dominance Amid Grill Segment Emergence
Convection formats generated 51.30% of 2025 revenue, underscoring their broad appeal to cooks who want browning capability without a full-size oven. The grill segment, although smaller, registers a 3.82% CAGR through 2031 as consumers in compact urban kitchens seek appliances that replicate outdoor cooking results. Solo models maintain relevance for entry-level buyers but contribute limited value growth. Premium combination steam and air-fry units command higher tickets, lifting the average selling price in the US microwave oven market. Product innovation centers on heating algorithms and cavity design that deliver even crisping. Sharp’s award-winning SW99 series exemplifies Japanese engineering that melds speed and texture. Grill variants benefit from cultural shifts toward healthier protein preparation that avoids excess oils. As countertop real estate shrinks, multipurpose designs win shelf space in both retail and residential environments. Manufacturers thus compete on feature breadth rather than raw wattage, protecting margins while sustaining volume growth.


By Structure: Countertop Convenience Versus Built-in Integration
Countertop units accounted for 64.40% of the US microwave oven market share in 2025, reflecting renter mobility and the simplicity of plug-and-play installation. Built-in models, however, are forecast to outpace with a 4.18% CAGR as kitchen renovation projects favor seamless aesthetics. Over-the-range versions remain popular in moderate-size kitchens because they double as ventilation. Built-in demand tracks home equity gains and discretionary remodeling budgets. Drawer-style formats such as Sharp’s D33 unlock under-counter placement, appealing to upscale buyers looking for ergonomic access. Countertop leadership endures in multifamily dwellings where appliance turnover is synchronized with lease cycles. This structural bifurcation enables tiered pricing strategies that address both price-sensitive and design-oriented consumers within the US microwave oven market.
By Control Feature: Button Controls Lead Digital Transition
Button interfaces held 61.20% share in 2025 and are projected to expand fastest at a 4.12% CAGR, illustrating the shift from mechanical dials to capacitive touchpads with programmable presets. Dial controls persist in rugged commercial settings and ultra-budget SKUs where simplicity trumps sophistication. Touch buttons now integrate WiFi pairing, sensor feedback and voice-assist shortcuts, blurring the line between tactile and digital control. The evolutionary path acknowledges user familiarity with physical buttons while layering in software-driven intelligence. Manufacturers incorporate back-lit icons, humidity sensors and app-triggered updates without abandoning the comforting click of a start key. This hybrid experience resonates with a wide demographic and minimizes learning curves, fostering broad adoption inside the US microwave oven market.
By Capacity: Mid-Range Efficiency Drives 25–29 Liter Leadership
Units in the 25–29 liter band secured a 35.60% cut of the US microwave oven market size in 2025, delivering a sweet spot between dinner-plate clearance and countertop footprint. Models 30 litres & above are on course for a 4.01% CAGR, propelled by multigenerational households and small foodservice operators. Smaller cavities serve dorms, offices, and studio apartments, yet face growth ceilings tied to mini-fridge pairing cycles. Capacity selection increasingly reflects functionality bundles rather than raw interior volume. Many 27-liter units integrate air-fry baskets or steam trays, enhancing versatility without enlarging external dimensions. Larger formats gain traction in suburban markets where kitchen footprints permit expansive cabinetry, and they facilitate side-by-side cooking of main and side dishes. This segmentation underpins diverse inventory planning for retailers catering to regional demand pockets across the US microwave oven market.
By Application: Residential Dominance With Commercial Growth Acceleration
Households generated 69.30% of 2025 shipments, confirming the appliance’s status as a ubiquitous kitchen staple. Yet commercial installations will grow faster at 3.36% CAGR to 2031 as quick-service restaurants and cafeterias embrace high-speed cooking to trim labor minutes. Foodservice operators value programmable cycles and robust hinges that survive heavy daily use, justifying premium prices. Residential replacements pivot on energy-efficiency labels and connectivity perks, while first-time buyers emerge from household formation in growth corridors. Commercial adoption benefits from throughput gains that accelerate return on investment, especially when paired with conveyor ovens for menu variety. Together, these dynamics maintain balanced growth across end-use segments within the US microwave oven market.

By Distribution Channel: Online Growth Transforms Retail Landscape
B2C/Retail (multi-brand stores) booked 39.40% of the 2025 value, supported by merchandising displays that let shoppers test door action and view cavity lighting. Online marketplaces, though smaller, will lead at a 4.28% CAGR through 2031 thanks to improved last-mile logistics and lenient return policies. Direct-to-consumer portals enable brands to capture margin upside, while B2B sales teams court chain restaurants and institutional buyers. Omni-channel strategies unify inventory across physical and digital shelves so customers can “buy online, pick up in store” or arrange professional installation. E-commerce also broadens reach into rural ZIP codes underserved by big-box footprints. As algorithms refine personalized ads, the US microwave oven market gains new avenues for targeted promotion and post-purchase engagement.
Geography Analysis
The Southeast retained a commanding 31.60% slice of 2025 revenue, buoyed by population inflows, favorable housing economics, and consistent residential construction. Florida and Georgia lead permit issuance, translating into parallel demand for appliance packages that include microwaves. Regional electricity costs lag the national average, encouraging uptake of higher-wattage convection models without bill anxiety. The West is the fastest-expanding region, poised for a 3.74% CAGR to 2031. California’s technology culture drives early adoption of smart features, while rapid urbanization in Arizona and Nevada spurs demand for space-efficient countertop designs. Environmental consciousness dovetails with inverter technology that trims energy usage. Tech-centric consumers embrace app-linked models that sync with broader smart-home ecosystems, further lifting the premium mix within the regional slice of the US microwave oven market. The Northeast and Midwest deliver stable replacement demand, supported by mature housing stock and steady renovation cycles. Affluent Northeastern homeowners favor built-in configurations that align with upscale cabinetry, whereas Midwestern buyers gravitate toward value-oriented countertop units bundled in promotional events. In the Southwest, population migration boosts unit sales, especially in master-planned communities where builders select appliance packages during construction. Across all regions, localized marketing that tailors capacity, color, and connectivity options to demographic preferences enhances sell-through rates.
Regulatory Landscape
In the United States, microwave ovens are regulated for radiation safety by the FDA Center for Devices and Radiological Health, with performance standards codified in 21 CFR 1030.10 covering emission limits, safety interlocks, and labeling requirements. This federal framework shapes product design and compliance testing for both residential and light commercial models sold in the country.
For energy efficiency, the Department of Energy administers standards and test procedures for microwave ovens under 10 CFR Part 430; on May 16, 2025, the DOE published a proposed rule to rescind the energy conservation standards for microwave ovens, creating a regulatory fork for manufacturers and influencing SKU strategy and testing programs. Separately, trade policy continues to affect sourcing as the USTR extended Section 301 tariff exclusions on China-origin goods until November 9, 2026, influencing landed costs and supplier strategies for a category with high import exposure.
Competitive Landscape
Competition is fragmented yet intensifying as technology reshapes value propositions. Whirlpool, GE Appliances, Samsung, LG, and Sharp jointly supplied 2024 shipments, leaving meaningful room for niche challengers. Whirlpool’s Q1 2025 focus on pricing discipline preserved margins despite softer volumes. LG differentiated with on-board cameras, while Sharp captured awards for high-speed European convection that debuted in North America.
Patent filings aimed at WiFi interference mitigation and solid-state heating point to a coming wave of functionality that could reset leadership ranks. Bosch’s reported bid for Whirlpool signals potential consolidation that would reshape bargaining power with retailers. Chinese manufacturers continue to scale production efficiency, and Midea’s USD 122 million Brazilian plant offers a hedge against US tariffs while serving the hemisphere.
Strategic moves extend beyond M&A. GE Appliances partnered with ABB on an energy-management panel that integrates major loads for demand response, embedding microwaves into wider sustainability narratives. LG is expanding its Tennessee footprint with a USD 100 million warehouse that will eventually host oven lines, securing domestic capacity while reducing inbound freight. As brands seek differentiation through software, post-purchase support, and ecosystem compatibility, service quality emerges as a new battleground in the US microwave oven market.
US Microwave Oven Industry Leaders
Whirlpool Corp.
GE Appliances (Haier)
Samsung Electronics America
LG Electronics USA
Sharp Electronics Corp.
- *Disclaimer: Major Players sorted in no particular order


Market Opportunities and Future Outlook
Connectivity and software-led cooking assistance remain a clear upgrade pathway for value creation, with platforms such as GE Appliances SmartHQ embedding microwaves into broader connected-kitchen experiences. Product-line innovation that combines microwave with convection and air-fry functions supports premiumization in replacement cycles, building on demonstrated manufacturer activity in multi-function formats and guided-cooking features.
Regulatory and trade dynamics create whitespace for differentiated offers and supply-chain repositioning. The DOE proposal to rescind federal microwave energy conservation standards (May 16, 2025) creates a regulatory fork for manufacturers, while the Section 301 tariff exclusions extended through November 9, 2026 anchor supply-chain decisions and SKU strategies as firms adapt to evolving compliance and sourcing conditions.
Recent Industry Developments
- July 2026: In 2026, J.D. Power published its 2026 U.S. Appliance Satisfaction Study, ranking Samsung highest for over-the-range microwaves, followed by Whirlpool and LG. The rankings highlight the importance of user experience, reliability, and feature-value tradeoffs for premium over-the-range options.
- December 2025: In December 2025, the U.S. International Trade Commission opened a Section 337 investigation into imports of low-profile microwave-hood combination products following Whirlpool allegations of patent infringement. The investigation heightens attention to design-around strategies and potential import constraints for affected configurations.
- November 2025: In November 2025, Whirlpool filed a complaint with the USITC seeking to block imports of certain Samsung and LG microwave products as part of a wider dispute also naming Midea, Haier (GE Appliances), and Electrolux. The move illustrates how IP enforcement intersects with product differentiation in over-the-range and low-profile segments.


Research Methodology Framework and Report Scope
Market Definition and Coverage
This market is measured as the yearly value of new microwave ovens sold in the United States, captured at the finished-appliance level and aligned to normal household and light commercial cooking use.
Scope exclusions: We exclude service parts, refurbished or used units, industrial batch or tunnel microwave systems, and hybrid high-speed ovens that blend multiple heating technologies.
Segmentation Overview
- By Product
- Solo
- Grill
- Convection
- Other Products
- By Structure
- Countertop
- Built-in / Wall
- Over-the-Range
- By Control Feature
- Button Controls
- Dial Controls
- By Capacity (Litres)
- Up to 19 litres
- 20 to 24 litres
- 25 to 29 litres
- 30 litres & above
- By Application
- Residential
- Commercial
- By Distribution Channel
- B2C / Retail
- Multi-brand Stores
- Exclusive Brand Outlets
- Online
- Other Distribution Channels
- B2B / Direct from Manufacturers
- B2C / Retail
- By Geography
- Northeast
- Southeast
- Midwest
- Southwest
- West
Data Sources, Market Sizing, and Validation
Desk Research
Desk work starts by building the demand and supply context for microwave ovens in the United States, so the model has real anchors before any forecasting begins. We typically rely on public series and reference material such as U.S. Census Bureau retail and trade releases, Bureau of Labor Statistics inflation and price indexes, U.S. International Trade Commission trade statistics, and energy-efficiency rulemakings and test procedures published by the U.S. Department of Energy.
To avoid sizing the market from a single lens, the desk phase also uses company filings and investor materials, major retailer disclosures where available, and reputable press coverage of appliance promotions and replacement cycles. Where a gap appears in unit flows or product mix, we complement the public record with paid subscriptions for company financials and intelligence, and when needed, shipment-level import and export databases to sanity-check directional movements. The sources listed here are illustrative, and many other public and paid references were used for data collection, validation, and clarification during the study.
Primary Interviews and Surveys
Primary work is used to confirm what is really selling and why, especially when product positioning and channel mix shift faster than public data. We spoke with participants across manufacturing and distribution, retail and e-commerce, and service and installation roles, then we cross-checked responses to align on unit trends, pricing moves, and replacement timing across the country.
Distribution of primary research fieldwork respondents
| Company type | Respondent position |
|---|---|
| Top tier: 32% | CXOs: 13% |
| Mid tier: 54% | Functional/Unit leaders: 42% |
| Smaller Players: 14% | Managers: 45% |
Market-Sizing & Forecasting
The model begins with a top-down build where U.S. appliance demand is reconstructed using a replacement-led demand pool, then translated into microwave oven value by applying channel mix and price ladders. Once the demand pool is set, we corroborate totals with selective bottom-up checks, such as sampled average selling price (ASP) by format and a reasonableness roll-up from visible supplier and importer activity, which helps adjust the final number when one input looks overstretched.
Key inputs that shape the market totals include housing turnover and household formation signals, remodeling and kitchen upgrade activity, the split between countertop and over-the-range or built-in formats, promotion intensity that affects realized ASP, and inflation normalization so nominal growth is not mistaken for unit growth. For the forecast, scenario analysis is used so the outlook stays practical under different paths for consumer spending and housing activity, and assumptions are reviewed again with interview feedback before the curve is finalized. Where unit information is patchy in smaller channels, gaps are handled using bounded ranges tied to channel shares and then tightened through follow-up calls and consistency checks.
Data Validation & Update Cycle
Validation happens in steps, starting with internal cross-checks on units, value, and implied pricing so the totals do not contradict known demand signals. We compare outputs against independent indicators like trade movements, inflation-adjusted pricing, and channel narratives, then outliers are reviewed until the driver is clear.
Before sign-off, the model and assumptions go through multi-step analyst reviews, and respondents may be re-contacted when a variance cannot be explained with available evidence. The report is refreshed each year, and material events such as new efficiency rules or sharp pricing shifts can trigger interim revisions, followed by a final pre-delivery pass to keep the view current.
Mordor Intelligence's United States Microwave Oven Market Size Measured Against Other Published Estimates
Published market sizes for U.S. microwave ovens can look far apart even when they aim to describe the same industry, because the counting rules behind the totals are not always the same. Differences usually come from what is included as a microwave oven, which selling channels are captured well, and how prices are converted into a single market value for a given year.
By tracking format-level unit flows, inflation-adjusted ASP movement, and annual scope checks, Mordor Intelligence keeps the estimate focused on new, finished microwave ovens sold in the United States, rather than blending in adjacent cooking products or aftermarket revenue that can inflate the total.
Benchmark comparison
| Source | Market Size | Gaps in Research Methodology |
|---|---|---|
| Mordor Intelligence | USD 3.66 B (2025) | |
| Global Consultancy A | USD 4.10 B (2025) | Often broadens the boundary by adding hybrid high-speed ovens and related built-in cooking products, and it may also mix in installation and service revenue that sits outside finished-appliance sales. |
| Trade Journal B | USD 3.20 B (2025) | Typically leans on shipment or retail-only tracking and then applies simplified pricing, which can undercount online and specialty-channel sales and miss format mix shifts that move ASP. |
The spread in the table is mainly explained by scope and the price and channel logic used to convert units into value. When inclusion rules are kept tight and inputs are checked against practical demand signals, the resulting market size is easier to replicate and to use for planning.


Key Questions Answered in the Report
What is the current value of the US microwave oven market?
The US microwave oven market size is USD 3.79 billion in 2026 and is forecast to reach USD 4.53 billion by 2031.
Which product segment holds the largest share?
Convection microwaves lead with 51.30% revenue share in 2025, reflecting demand for versatile cooking that blends microwave speed with oven-style browning.
How fast is the online channel growing?
Online sales are projected to expand at a 4.28% CAGR through 2031, the fastest among all retail formats, as e-commerce becomes integral to appliance purchasing.
Why are built-in microwaves gaining popularity?
Kitchen remodels favor seamless appliance integration, pushing built-in units to grow at a 4.18% CAGR, faster than the overall US microwave oven market.
Page last updated on:


 Your data is secure and never sold or shared.


