
United States (US) MEP Services Market Size and Share
Market Overview
| Study Period | 2021 - 2031 |
|---|---|
| Forecast Data Period | 2026 - 2031 |
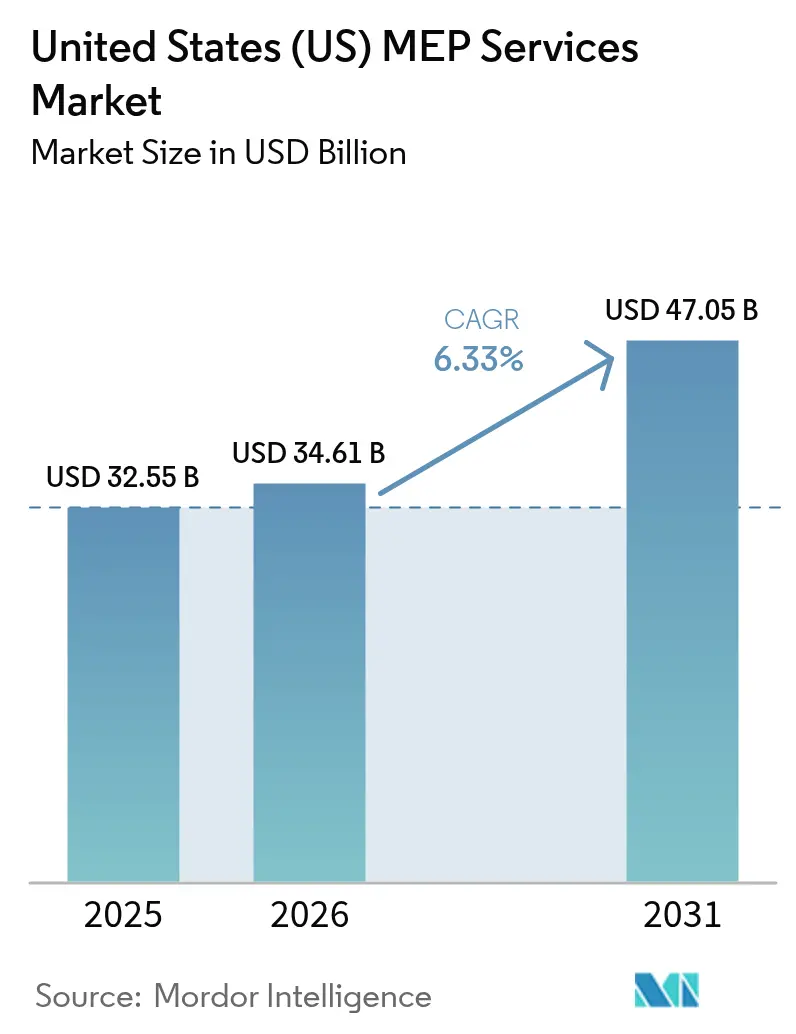
| Base Year Market Size (2025) | USD 32.55 Billion |
| Market Size (2026) | USD 34.61 Billion |
| Market Size (2031) | USD 47.05 Billion |
| Growth Rate (2026 - 2031) | 6.33% CAGR |
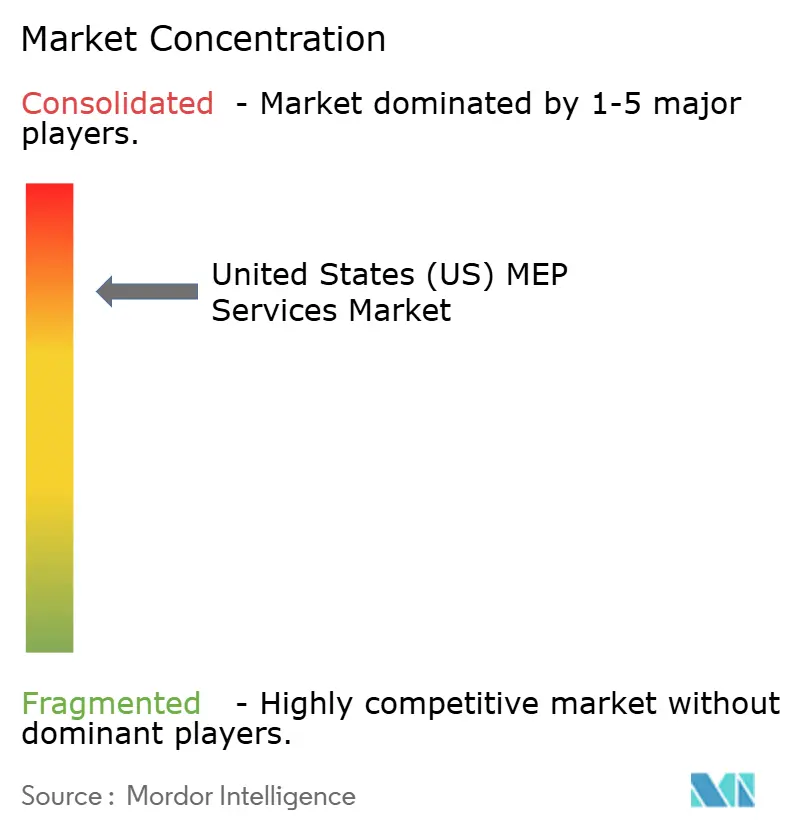
| Market Concentration | High |
Major Players *Disclaimer: Major Players sorted in no particular order Image © Mordor Intelligence. Reuse requires attribution under CC BY 4.0. | |
United States (US) MEP Services Market Analysis by Mordor Intelligence
The United States MEP services market size is expected to grow from USD 32.55 billion in 2025 to USD 34.61 billion in 2026 and is forecast to reach USD 47.05 billion by 2031 at 6.33% CAGR over 2026-2031. Contractors report that retrofit activity accelerated after the IRA’s launch, with heat-pump and energy-efficient HVAC retrofits up 40% since 2024. Healthcare expansions, semiconductor fabs, and hyperscale data centers are shaping procurement cycles, while skilled-labor scarcity continues to inflate wages and extend project lead times.[1]Contracting Business, “Industry Econ Forecast 2025,” contractormag.com Material cost volatility, especially copper surpassing USD 5 per pound, complicates pricing strategies for the mechanical services industry. Digitalization deepens competitive gaps as 77% of new projects already require BACnet-compatible building-automation infrastructure that favors firms with proven BIM and AI capabilities.[2]BACnet International, “BACnet’s Future in Building Automation,” bacnetinternational.org
Key Report Takeaways
- By type, retrofit and renovation led with 46.72% revenue share of the mechanical services market in 2025; commissioning and re-commissioning are advancing at a 7.35% CAGR through 2031.
- By end-user vertical, healthcare facilities commanded 28.74% of the mechanical services market share in 2025; data centers are rising at an 7.86% CAGR to 2031.
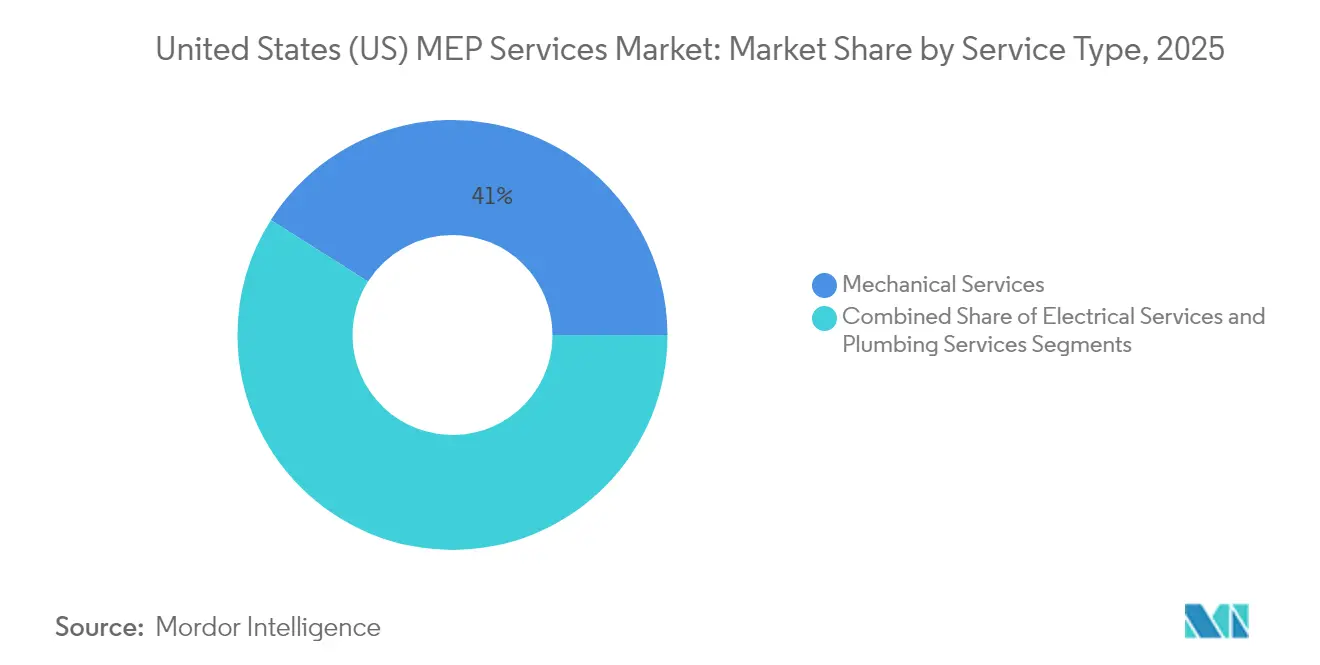
- By service type, Mechanical Services accounted for a 41.02% share of the mechanical services market size in 2025, while electrical services are forecast to expand at a 7.47% CAGR.
- By US region, the South held 36.12% of the mechanical services market size in 2025; the West is projected to post the fastest regional CAGR at 7.55% through 2031.
Note: Market size and forecast figures in this report are generated using Mordor Intelligence’s proprietary estimation framework, updated with the latest available data and insights as of 2026.
United States (US) MEP Services Market Trends and Insights
Drivers Impact Analysis*
| Driver | (~) % Impact on CAGR Forecast | Geographic Relevance | Impact Timeline |
|---|---|---|---|
| Outsourcing focus on core competencies | +1.2% | Global, with concentration in South and West regions | Medium term (2-4 years) |
| Sustained demand from healthcare construction | +1.5% | National, with early gains in Texas, California, Arizona | Long term (≥ 4 years) |
| Electrification and HVAC efficiency retrofits | +1.8% | California, New York, Northeast states leading adoption | Short term (≤ 2 years) |
| Inflation Reduction Act tax-credit pull-through | +1.1% | National, with higher uptake in high-income metropolitan areas | Short term (≤ 2 years) |
| Grid-interactive buildings and DER integration needs | +0.9% | California, Texas, Northeast grid-constrained markets | Medium term (2-4 years) |
| Growing VC funding for AI-driven MEP design tools | +0.2% | Technology hubs: Silicon Valley, Boston, Seattle | Long term (≥ 4 years) |
| Source: Mordor Intelligence | |||
Outsourcing Focus on Core Competencies
Mechanical systems now form 40–60% of building energy loads, encouraging owners to outsource to specialist firms rather than carry in-house teams. Technology platforms such as ServiceTitan help contractors build direct relationships that bypass general-contractor markups, evidenced by Southland Industries’ productivity gains after adopting the platform. Healthcare networks allocate higher portions of capital budgets to specialized partners, with facilities-management spending on non-hospital projects up 27% in 2025. Contractors like Limbach report recurring revenue increases from building-systems solution contracts that improve lifecycle performance.
Sustained Demand from Healthcare Construction
Healthcare construction reached USD 65 billion in 2024 as infection-control protocols and negative-pressure ventilation drove complex mechanical specifications. Projects such as Mayo Clinic’s 1.4 million sq ft expansion in Arizona require redundant HVAC, filtration, and emergency power systems with 24/7 uptime. Hospital owners now specify commissioning on 80% of projects to certify operational readiness, expanding demand for specialized MEP consultants.
Electrification and HVAC Efficiency Retrofits
IRA rebates and state codes are accelerating electrification, with the Department of Energy projecting 900,000 new contractor roles linked to heat-pump rollouts. California’s 2025 Energy Code mandates electric-ready kitchens and higher heat-pump efficiencies, pushing contractors into advanced refrigerant management and electrical-coordination scopes.[3]California Energy Commission, “2025 California Energy Code Fact Sheet,” energy.ca.gov Smart HVAC integration delivers 36.8 kW average power savings per facility when coupled with IoT-driven predictive maintenance algorithms.
Inflation Reduction Act Tax-Credit Pull-Through
Section 25C permits homeowners to recover 30% of qualified mechanical expenditures up to USD 3,200 annually, driving a wave of residential retrofits. Commercial owners leverage uncapped 25D credits for solar-plus-storage that require sophisticated HVAC load management, while states like New York add workforce grants that subsidize heat-pump installer training.
Restraints Impact Analysis*
| Restraint | (~) % Impact on CAGR Forecast | Geographic Relevance | Impact Timeline |
|---|---|---|---|
| Talent scarcity and wage escalation | -1.8% | National, with acute shortages in Midwest and Northeast | Long term (≥ 4 years) |
| Small-firm margin squeeze from design-build consolidation | -0.9% | Regional markets with high general contractor concentration | Medium term (2-4 years) |
| Cyber-security liability on smart-building projects | -0.4% | Urban markets with high smart building adoption | Medium term (2-4 years) |
| Volatile HVAC/R material pricing risk transfer | -0.6% | National, with higher impact in copper-intensive regions | Short term (≤ 2 years) |
| Source: Mordor Intelligence | |||
Talent Scarcity and Wage Escalation
The sector faces a gap of 650,000 skilled workers as baby-boom retirements accelerate, leading to 20% wage growth since 2020.[4]Autodesk, “Can Better MEP Solve Construction’s Skilled Labor Shortage?,” autodesk.com Apprentice compensation in energy trades averages USD 77,000 in year one, pressuring bid margins for public-sector contracts. Mechanical contractors in the Midwest report 68% difficulty filling mechanical-engineering positions, forcing 49% of firms to decline projects despite strong pipelines.
Small-Firm Margin Squeeze from Design-Build Consolidation
Strategic acquisitions among national players continued in 2024, exemplified by WSP’s USD 1.78 billion purchase of Power Engineers and Michael Baker International’s takeover of Infinity MEP+S Consultants. Consolidators leverage bulk-buying power to mitigate copper and equipment price spikes, leaving independents vulnerable to material cost inflation that has hit 40% for HVAC equipment since 2020. Smaller entities increasingly pivot toward niches such as hospital retro-commissioning or liquid-cooling integration to preserve pricing power.
*Our forecasts treat driver/restraint impacts as directional, not additive. The impact forecasts reflect baseline growth, mix effects, and variable interactions.
Segment Analysis
By Type: Retrofits Dominate IRA-Driven Growth
Retrofit and renovation captured 46.72% of the mechanical services market share in 2025 as building owners raced to secure federal incentives ahead of potential rule changes. Commissioning and re-commissioning are projected to generate USD 4.58 billion of additional mechanical services market size by 2031, posting a 7.35% CAGR as performance verification becomes mandatory for healthcare and public-sector projects.
Performance-based contracts are reshaping service scopes; eighty percent of hospital projects now bundle commissioning, energy modeling, and maintenance analytics into single awards. Digital-twin adoption accelerates verification accuracy, with IFC-based workflows reducing corrective-action lists by 28%.


By End-User Vertical: Healthcare Leads Mission-Critical Expansion
Healthcare accounted for 28.74% of the mechanical services market size in 2025, underpinned by USD 2.5 billion in announced medical-campus expansions. Data centers hold a modest 10.34% revenue slice today, but are the fastest-growing vertical at 7.86% CAGR as AI workloads escalate liquid-cooling adoption.
Commercial-office demand remains resilient as owners upgrade indoor air quality to win back tenants, while educational institutions unlock deferred-maintenance budgets through infrastructure grants. Industrial and warehousing clients invest in high-volume ventilation and process piping to comply with Occupational Safety and Health Administration (OSHA) air-quality limits. Mission-critical campuses, a blended category of hospitals, labs, and hyperscale compute sites, are projected to contribute USD 49 billion to the mechanical services market size by 2025.
By Service Type: HVAC Systems Drive Electrification
HVAC retained 41.02% of the mechanical services market share in 2025, reflecting the technical intensity of heat-pump rollouts and smart controls integration. Electrical Services is expanding at a 7.47% CAGR as jurisdictions adopt outcome-based codes that oblige predictive performance assurance.
Electrical-service demand climbs in parallel, driven by panel upgrades for EV chargers and rooftop solar interconnections. Plumbing and fire protection maintain a steady share because hospital and industrial projects need specialized piping, medical-gas systems, and code-driven sprinkler designs. ASHRAE’s 2024 standards emphasize whole-building system efficiency, compelling mechanical contractors to coordinate envelope, lighting, and HVAC decisions from schematic stages.
Geography Analysis
Non-residential spending in the South grew 8.3% year over year, outpacing national averages as corporate capital moved toward right-to-work states with lower energy costs. Data-center developers cluster near high-capacity transmission lines, driving demand for chilled-water plants and high-density power distribution. Population inflows sustain a 4.6% uptick in multifamily starts, providing retrofit opportunities for centralized hot-water and HVAC upgrades across residential towers.
The West posts the highest mechanical services market CAGR at 7.55% as California mandates electric-ready builds and advanced heat-pump coefficients. Rural counties in Oregon and Utah attract hyperscale campuses seeking cool climates for liquid-cooling systems that reduce PUE ratios. Solar-plus-storage microgrids proliferate in wildfire-prone areas, requiring mechanical contractors to coordinate battery thermal-management units and smoke-control fans that meet revised air-quality rules.
The Northeast and Midwest struggle with acute labor gaps yet benefit from healthcare and infrastructure outlays. New York’s clean-energy workforce grants subsidize heat-pump installer certifications, while Illinois’ apprenticeship programs fortify pipefitter and electrician pipelines. Midwest megaprojects, including bio-fuels refineries and small-modular reactor test sites, create specialty work packages for mechanical firms offering combined process and HVAC expertise.
Regulatory Landscape
The United States MEP services environment is shaped by a patchwork of state and local building-code adoption, anchored by model codes (ICC International Mechanical Code and International Plumbing Code) and electrical safety requirements under NFPA 70 (National Electrical Code). Federal direction on energy efficiency is led through the US Department of Energy Building Energy Codes Program, including its March 2024 affirmative determination for ASHRAE Standard 90.1-2022, which created a two-year window for state compliance actions and pushed many adoption decisions into early 2026.
Energy and controls compliance is moving toward more prescriptive requirements for sequences and verification, with California serving as a reference point for MEP contractors in high-regulation markets. The California Energy Commission began enforcing the 2025 Building Energy Efficiency Standards on January 1, 2026 (Title 24), which incorporate specific control-sequence expectations tied to ASHRAE Guideline 36 and elevate the role of compliant building automation programming and commissioning practices. In parallel, digital delivery standards are tightening through the National Institute of Building Sciences (NBIMS-US), reinforcing installation-level spatial coordination expectations that feed into BIM requirements for complex MEP packages.
Value Chain Analysis
The US MEP services value chain typically runs from design and engineering (MEP consultants, BIM and controls design) through procurement (equipment OEMs and distributors for HVAC, controls, switchgear, piping, and specialty components) to fabrication and installation (trade contractors and specialty subcontractors). It then extends to commissioning, re-commissioning, and ongoing maintenance analytics. As retrofit and mission-critical projects expand, commissioning agents, controls integrators, and software providers (for BIM-to-fabrication, scheduling, and service management) play a larger role in delivery, particularly when 77% of new projects require BACnet-compatible building-automation infrastructure.
Two bottlenecks are shaping how value gets captured: labor availability and the speed of translating coordinated models into installable work. Industry inputs point to muted construction employment growth in 2026 (0.6%), leaving electricians and mechanical trades constrained while data centers and power infrastructure compete for the same specialty labor pool. Prefabrication and shop-based production are moving upstream into planning and coordination, with BIM models linked directly to automated shop-floor equipment (pipe profiling and robotic welding/spooling). This is also shifting contractor differentiation toward process discipline and production data, and trade-association and industry reporting in 2026 emphasizes that organizational documentation and process infrastructure, not tool availability, limit scaling data-driven operations across estimating, fabrication, and field installation.
Competitive Landscape
Innovation and Adaptability Drive Future Success
Despite 25% of top firms completing acquisitions in 2024, the mechanical services market remains fragmented. WSP’s USD 1.78 billion integration of Power Engineers vaulted it to the top tier in energy-sector MEP, while Michael Baker International expanded geographical reach by acquiring Infinity MEP+S Consultants. Digital maturity has become a wedge; 77% of winning bids in 2025 specified BIM-level 3 coordination, and contractors advertising AI-based clash detection report bid-hit ratios 15% above peers.
White-space opportunities revolve around specialized liquid-cooling for AI data halls, hospital-grade filtration, and grid-interactive building retrofits. Independent specialists secure premium pricing in these domains, even as generalists chase volume contracts. Sustainability credentials also influence selection; more than 90 organizations have signed the MEP 2040 pledge, signaling that carbon-footprint transparency may soon be table stakes for federal and Fortune 500 clients.
Labor scarcity shapes strategy: tier-one firms invest in prefabrication and robotics to compress field hours, while mid-sized contractors form joint ventures to meet union-mandated manpower thresholds. Wage escalation prompts some companies to open in-house training academies; AECOM’s 2025 backlog hit USD 23.9 billion, partly on the strength of workforce-development programs that de-risk delivery schedules.
United States (US) MEP Services Industry Leaders
Jacobs Engineering Group Inc.
WSP USA
HDR Inc.
Arup Group
AECOM Technology Corporation
- *Disclaimer: Major Players sorted in no particular order

Market Opportunities and Future Outlook
Digital fabrication and prefab-enabled delivery create a clear whitespace for contractors and engineering firms that can industrialize MEP execution, especially where schedule certainty and labor constraints are driving buyer requirements. In a February 2026 DEWALT and Dodge Construction Network study, 82% of mechanical contractors said they now require digital fabrication capabilities as a prerequisite for winning projects, which frames BIM-to-fabrication workflows and shop-floor automation as bid qualifiers. That same shift supports opportunities in modular MEP racks, repeatable assembly for mission-critical rooms, and closer integration between design intent, coordinated models, and field QA/QC.
Mission-critical and regulated retrofit work is also expanding scope beyond traditional installation into controls, commissioning, and operational verification, supported by code and standards direction. California Title 24 enforcement starting January 1, 2026, with explicit alignment to ASHRAE Guideline 36 control sequences, raises the demand for compliant BAS programming libraries, testing, and documentation, benefiting firms that can bundle mechanical-electrical-controls and commissioning into one delivery approach. Meanwhile, healthcare expansions and large AI/data-center builds are pulling MEP firms toward higher-density power, redundant HVAC, filtration, and liquid-cooling packages, increasing demand for workforce development and repeatable production systems as contractors manage copper and equipment price volatility alongside ongoing skilled-trade scarcity.
Recent Industry Developments
- June 2026: Engineering News-Record reported that the Top Professional Services Firms generated USD 36.9 billion in combined CM/PM-for-fee revenue in 2026, up 31.2% from 2025. This continued shift toward program and construction management models increases the pull-through of integrated MEP engineering, commissioning, and delivery oversight on complex US projects.
- December 2025: WSP announced a USD 3.3 billion cash acquisition of TRC Companies to broaden its US capabilities across power, energy, and infrastructure. The combination strengthens end-to-end delivery capacity in grid and facility programs where MEP scopes intersect with electrification, interconnection, and mission-critical buildouts.
- December 2024: Jacobs received a USD 249 million architecture and engineering services contract from the US Army Corps of Engineers Omaha District covering the Northwestern United States, Alaska, and Hawaii. The award expands a long-duration federal pipeline that commonly bundles mechanical, electrical, and plumbing engineering with energy, resilience, and facility modernization requirements.


Research Methodology Framework and Report Scope
Market Definition and Coverage
For this study, the market covers revenue earned from mechanical, electrical, and plumbing (MEP) services delivered for US buildings and facilities, including design and engineering work as well as commissioning and assessments tied to MEP scope.
Scope exclusions: We exclude stand-alone architecture, pure civil works, and product-only sales where no MEP service is provided.
Segmentation Overview
- By Type
- New Construction
- Retrofit and Renovation
- Commissioning / Re-commissioning
- Facility Assessment and Other Services
- By End-user Vertical
- Healthcare
- Commercial Offices
- Educational Institutions
- Public Facilities (Govt, Transport, Museums)
- Industrial and Warehousing
- Data Centers and High-Tech
- By Service Type
- Mechanical Services
- Electrical Services
- Plumbing Services
Data Sources, Market Sizing, and Validation
Desk Research
Desk research started with building activity and spending signals that help explain where MEP demand comes from, and how it shifts between new projects and retrofit work. We referenced public sources such as the US Census Bureau construction spending series, Bureau of Labor Statistics employment and wage data for relevant trades, and the US Energy Information Administration for energy use context that affects HVAC and electrification work.
To ground the demand by building type, we also reviewed materials from the American Society of Heating, Refrigerating and Air-Conditioning Engineers (ASHRAE), the National Fire Protection Association (NFPA) for code-driven requirements, and US Green Building Council (USGBC) updates tied to building performance expectations. Company annual reports, investor presentations, and reputable press were used to sense-check service mix and backlog language, while a paid subscription for company financials, news, and a patent database helped with revenue direction checks and signals on technology adoption. These are illustrative sources only, and additional public references were used for data collection, validation, and clarification during the work.
Primary Interviews and Surveys
Primary work focused on validating what portion of US construction and renovation spend converts into MEP service revenue, and how pricing and labor availability changed the mix by year. We spoke with engineering and contracting-side respondents, along with facility and project stakeholders, and kept coverage balanced across Northeast, Midwest, South, and West so regional code differences and labor constraints were not averaged out too early.
Distribution of primary research fieldwork respondents
| Company type | Respondent position | Region |
|---|---|---|
| Top tier: 25% | CXOs: 16% | |
| Mid tier: 58% | Functional/Unit leaders: 27% | |
| Smaller Players: 17% | Managers: 57% |
Market-Sizing & Forecasting
Sizing was built using a top-down and bottom-up approach, where national construction and renovation activity by building type is first converted into an addressable MEP service demand pool, and then corroborated with selective roll-ups and price checks. The top-down side uses construction spending and building pipeline indicators to allocate demand into service work that typically sits inside MEP scope, and then it is adjusted for how much is outsourced versus handled in-house.
To keep the model practical, a small set of variables did most of the work, including nonresidential and residential construction spending trends, retrofit intensity (driven by energy upgrades and building performance needs), labor cost direction from wage series, and material-linked pressure points that affect electrical and mechanical scopes (such as copper-heavy work). Forecasting relied on scenario analysis supported by interview feedback, with base assumptions for construction starts, renovation activity, and price progression updated before finalizing the annual outlook. Where bottom-up coverage was thin for a niche service type, totals were bridged using typical service mix shares validated through interviews and cross-checked against public company commentary.
Data Validation & Update Cycle
Outputs were checked against independent signals such as construction spending direction, employment levels for relevant occupations, and year-to-year price movement seen in project bidding conversations. Variances were investigated through re-checking conversion ratios, service mix splits, and regional allocations, and then a second analyst review was completed before sign-off.
The study is refreshed annually, and interim updates are triggered when material events shift construction activity, labor availability, or regulation-driven retrofit demand. Before delivery, a final pass is performed so the numbers reflect the latest public releases and any confirmed changes collected through follow-up calls.
Mordor Intelligence's United States Mep Services Market Size Compared With Other Published Estimates
Published market sizes for US MEP services can look far apart because the line between engineering services, contracting work, and facility-side activity is not drawn the same way by every publisher. Differences also show up when some figures use aggressive price growth assumptions, or when the refresh timing lags shifts in construction cycles and retrofit activity.
The table shows a noticeable spread in 2025 values, and in Mordor Intelligence's model the count is limited to MEP services tied to design and engineering, consulting, commissioning, and facility assessment work, rather than folding in broader construction contracting revenue that sits around the same projects.
Benchmark comparison
| Source | Market Size | Gaps in Research Methodology |
|---|---|---|
| Mordor Intelligence | USD 32.55 B (2025) | |
| Global Consultancy A | USD 41.80 B (2025) | This estimate appears to include a wider execution layer of MEP activity, where installation-oriented contracting revenue and bundled facility work are counted alongside engineering-led services, which raises the total. |
| Trade Journal B | USD 24.90 B (2025) | This figure is closer to a design-fee view of the market, which can undercount commissioning, assessments, and renovation-heavy consulting work, and it may rely on a narrower respondent set that misses smaller project channels. |
Looking across the three numbers, the biggest driver is what gets treated as service revenue versus adjacent contracting or design-only fees, and secondarily how fast pricing is assumed to move during the forecast build. By keeping inputs tied to observable construction activity, labor cost direction, and validated service mix shares, the model stays traceable to clear steps that can be repeated year after year.


Key Questions Answered in the Report
How large is the United States MEP services Industry market in 2026?
The MEP services Industry market size is USD 34.61 billion in 2026.
What is the forecast CAGR for US MEP services Industry from 2026 to 2031?
The market is projected to expand at a 6.33% CAGR through 2031.
Which project type holds the largest share of spending?
Retrofit and renovation projects account for 46.72% of 2025 revenue.
Which end-user vertical is growing the fastest?
Data centers are advancing at an 7.86% CAGR through 2031
Page last updated on:


