
Market Overview
| Study Period | 2020 - 2031 |
|---|---|
| Forecast Data Period | 2026 - 2031 |
| Base Year Market Size (2025) | USD 5.26 Billion |
| Market Size (2026) | USD 5.92 Billion |
| Market Size (2031) | USD 10.67 Billion |
| Growth Rate (2026 - 2031) | 12.54 % |
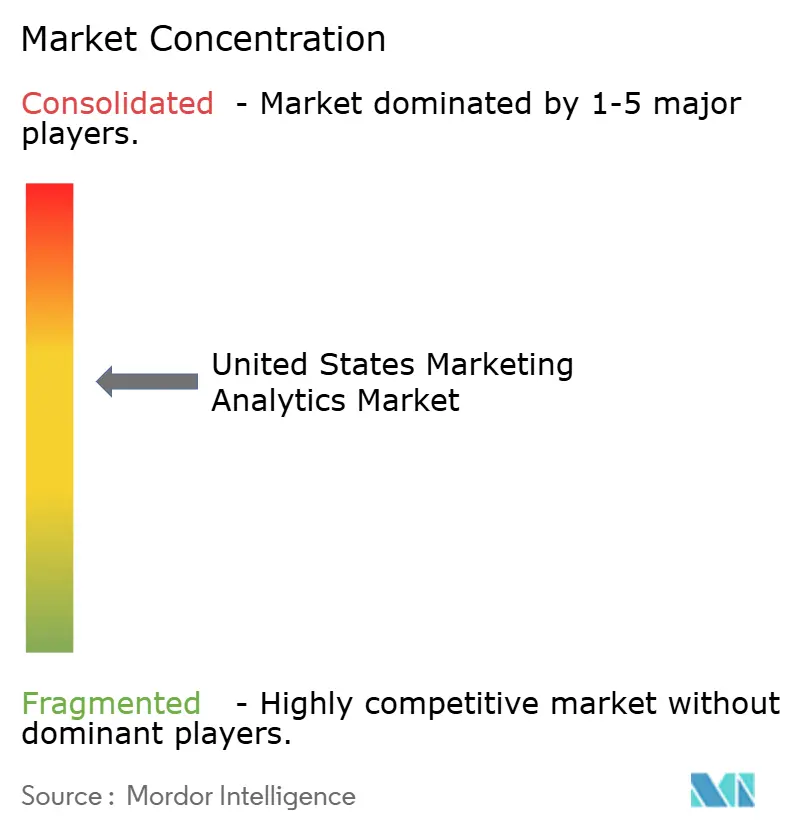
| Market Concentration | Medium |
Major Players *Disclaimer: Major Players sorted in no particular order Image © Mordor Intelligence. Reuse requires attribution under CC BY 4.0. | |
United States Marketing Analytics Market Analysis by Mordor Intelligence
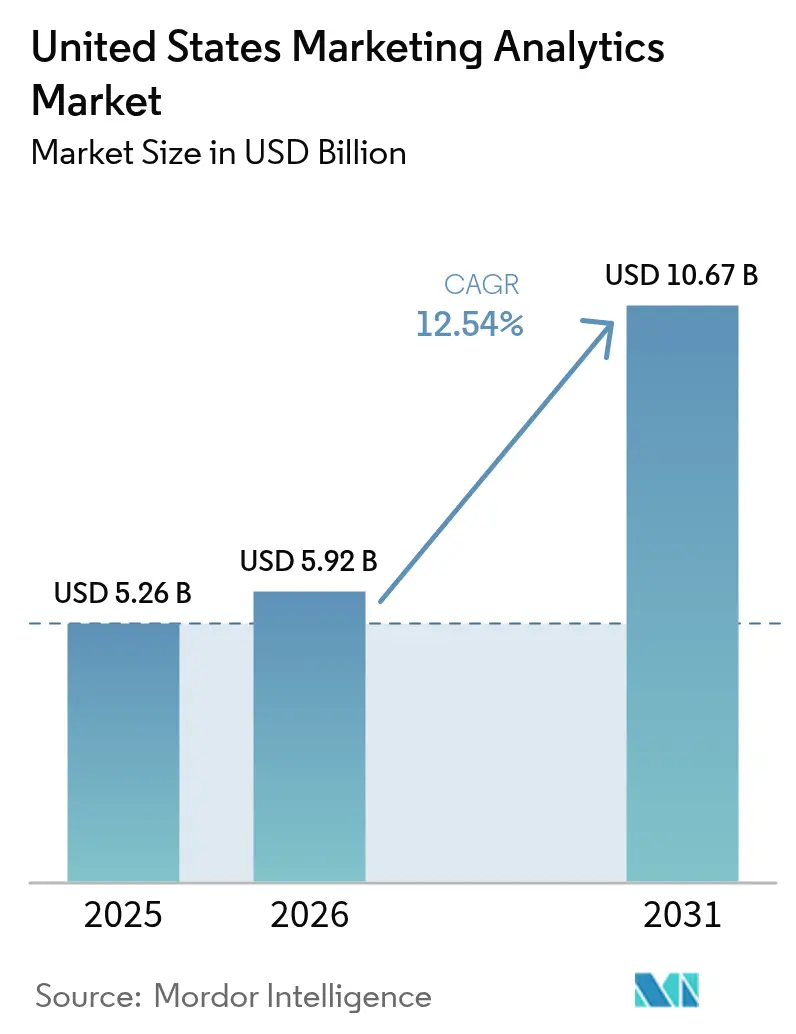
The United States marketing analytics market size was valued at USD 5.26 billion in 2025 and estimated to grow from USD 5.92 billion in 2026 to reach USD 10.67 billion by 2031, at a CAGR of 12.54% during the forecast period (2026-2031). This expansion stems from enterprises shifting away from intuition-based campaigns toward data-anchored attribution that links every dollar spent across digital and offline channels. Demand is reinforced by accelerated cloud migration, heightened first-party data strategies in response to state-level privacy statutes, and growing use of real-time personalization engines that improve conversion rates while respecting consumer consent signals.[1] Vendor competition is intensifying as incumbents embed generative AI into marketing suites and product-analytics specialists court mid-market buyers through consumption-based pricing. Meanwhile, talent shortages and a fragmented privacy landscape pressure platforms to automate data preparation and adopt privacy-preserving techniques that unlock aggregate insights without exposing individual-level records.
Key Report Takeaways
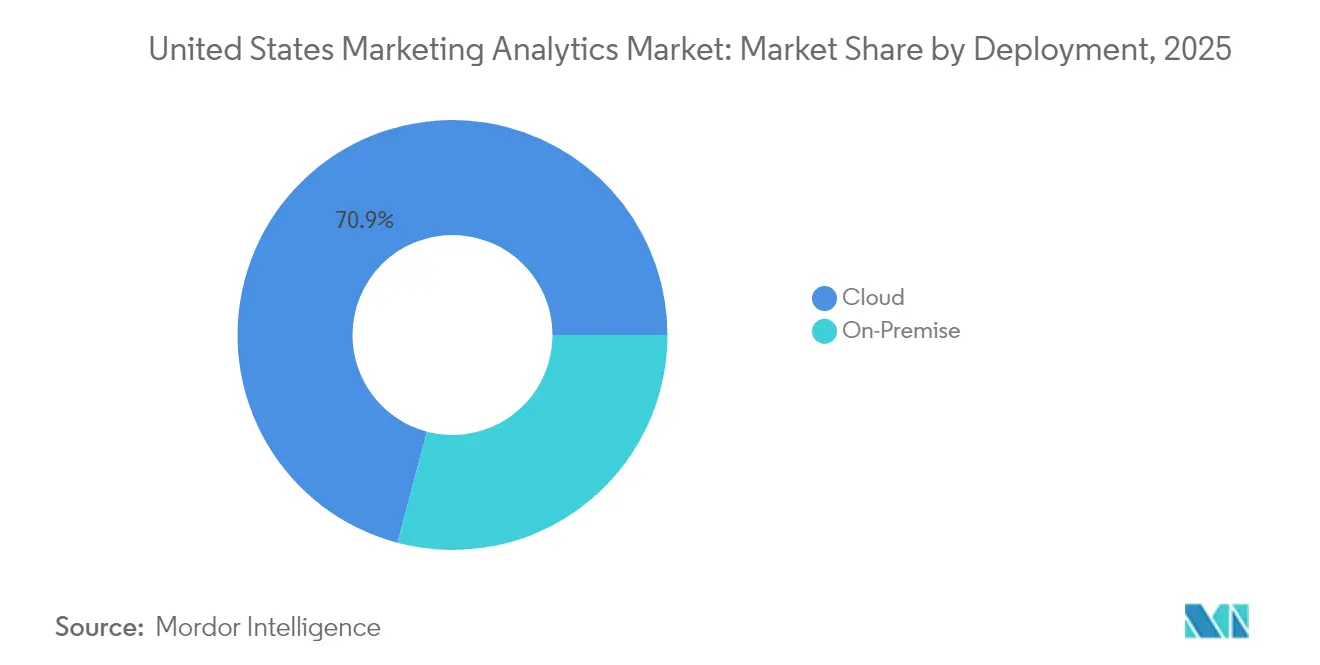
- By deployment, cloud commanded 70.88% of United States marketing analytics market share in 2025, and the segment is advancing at a 13.74% CAGR through 2031.
- By analytics type, predictive analytics held 34.35% share of the United States marketing analytics market size in 2025, while prescriptive analytics is forecast to expand at 13.28% CAGR to 2031.
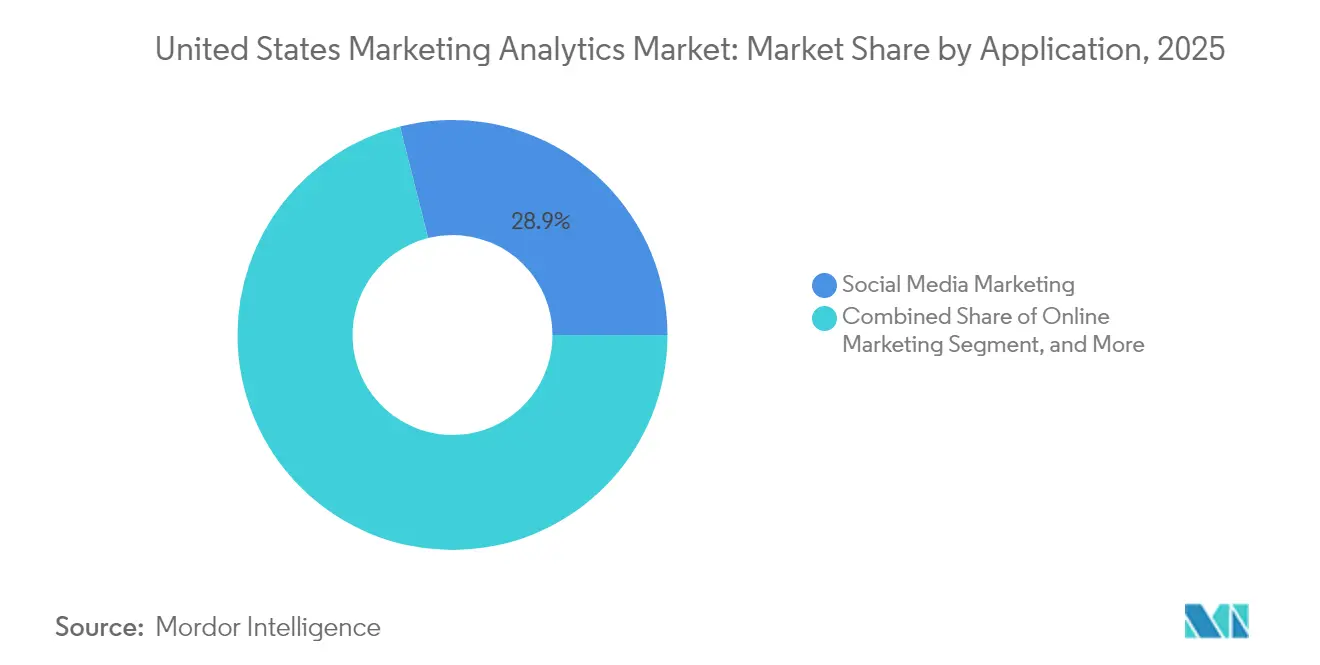
- By application, social media analytics captured 28.93% spending in 2025 and is growing at a 12.98% CAGR through 2031.
- By end user, retail led with 22.19% revenue share in 2025; healthcare is recording the highest projected CAGR at 13.12% to 2031.
- Adobe, Salesforce, Microsoft, Oracle, and IBM together held a moderate share, leaving room for specialists such as Amplitude and Mixpanel to capture price-sensitive mid-market demand.
Note: Market size and forecast figures in this report are generated using Mordor Intelligence’s proprietary estimation framework, updated with the latest available data and insights as of 2026.
United States Marketing Analytics Market Trends and Insights
Drivers Impact Analysis*
| Driver | (~) % Impact on CAGR Forecast | Geographic Relevance | Impact Timeline |
|---|---|---|---|
| Increasing Need to Utilize Marketing Budgets for an Effective ROI | +2.8% | National, concentrated in Northeast financial services and West Coast technology hubs | Medium term (2-4 years) |
| Adoption of Cloud Technology and Big Data | +3.2% | National, with accelerated uptake in South retail corridors and Midwest manufacturing clusters | Short term (≤ 2 years) |
| Proliferation of Social Media Channels | +2.1% | National, strongest in West Coast and Northeast urban markets | Short term (≤ 2 years) |
| Growing Regulatory Focus on First-Party Data Strategies | +1.9% | National, led by California, Virginia, Colorado early adopters | Medium term (2-4 years) |
| Accelerated Shift to Real-Time Personalization Engines | +2.3% | National, early gains in e-commerce and travel verticals | Short term (≤ 2 years) |
| Emergence of Privacy-Preserving Analytics Frameworks | +1.2% | National, with pilot deployments in healthcare and financial services | Long term (≥ 4 years) |
| Source: Mordor Intelligence | |||
Increasing Need to Utilize Marketing Budgets for an Effective ROI
Boards are scrutinizing discretionary spending, prompting chief marketing officers to demonstrate the direct contribution of every campaign to revenue. The Duke CMO Survey showed that martech utilization remained below 40% in Fall 2024, even as budgets held steady at 9.1% of firm revenue, underscoring a gap between investment and realized value.[2] Unified dashboards that consolidate data from advertising, CRM, and commerce platforms are replacing siloed point solutions, enabling multi-touch attribution and lifetime-value modeling. Vendors offering no-code connectors shorten implementation windows from quarters to weeks, making advanced analytics accessible to non-technical teams. As return-on-ad-spend becomes the North Star metric, enterprises that operationalize analytics experience faster budget approval cycles and higher campaign velocity.
Adoption of Cloud Technology and Big Data
Elastic cloud infrastructure has become the default for martech workloads, with 71% of enterprises migrating at least one marketing analytics process to the cloud in 2024, up from 58% in 2023. Cloud data lakes ingest streaming web, mobile, and point-of-sale events, then execute machine-learning models that create micro-segments in real time. Partnerships such as Snowflake’s integration with Adobe Experience Platform allow activation of first-party data without duplicating storage, cutting latency and reducing cost. Open-source engines like Apache Spark now power incremental processing that updates profiles within seconds rather than overnight batches. These architectural gains translate into agile experimentation and faster feedback loops.
Proliferation of Social Media Channels
Closed-loop application programming interfaces (APIs) from TikTok, Meta, and LinkedIn bypass browser cookies and deliver deterministic attribution, restoring marketer confidence in social media spend. As short-form video and influencer collaborations mature, brands need granular metrics covering reach, engagement, and conversion. Server-side event transmission improves match rates even when users block tracking scripts, allowing advertisers to optimize creative variants in near real time. Growing creator economies further push enterprises to synthesize platform data with first-party customer identifiers, deepening demand for adaptable analytics pipelines.
Growing Regulatory Focus on First-Party Data Strategies
Nineteen states enacted consumer-data statutes by 2024, each mandating distinct consent, deletion, and opt-out rules. California’s Privacy Rights Act requires honoring browser-based opt-out signals, compelling server-to-server data pipelines that respect jurisdiction boundaries. Consequently, 68% of U.S. advertisers prioritized first-party data infrastructure in 2024, investing in consent management, identity resolution, and customer data platforms. Brands that consolidate CRM, commerce, and service interactions unlock higher match rates, boosting audience addressability while maintaining compliance.
Restraints Impact Analysis*
| Restraint | (~) % Impact on CAGR Forecast | Geographic Relevance | Impact Timeline |
|---|---|---|---|
| High Cost of Implementation and System Integration Issues | -1.8% | National, acute in mid-market enterprises with legacy infrastructure | Short term (≤ 2 years) |
| Availability of Feature-Rich Open-Source Tools | -0.9% | National, concentrated in technology and startup sectors | Medium term (2-4 years) |
| Increasing State-Level Consumer Data-Protection Statutes | -1.4% | National, led by California, Virginia, Colorado, Connecticut, Utah | Medium term (2-4 years) |
| Talent Shortage in Advanced Analytics and Data Engineering | -1.6% | National, most severe in Midwest and South regions | Long term (≥ 4 years) |
| Source: Mordor Intelligence | |||
High Cost of Implementation and System Integration Issues
Deploying a full-stack analytics solution requires software licenses, cloud resources, data engineering, and change management. Mid-market firms often manage more than 90 marketing applications, which creates fragmented schemas and duplicate customer identifiers that inflate the labor needed for integration. Cloud spending can also exceed projections as data volumes surge, prompting finance teams to re-examine total cost of ownership. Vendors now respond with bundled managed services, consumption-based pricing, and pre-built connectors, yet the up-front lift still delays time-to-insight for resource-constrained buyers.
Increasing State-Level Consumer Data-Protection Statutes
The absence of federal privacy legislation has produced a patchwork of rules defining “sale,” “sharing,” and “targeted advertising” differently across states. Enterprises must embed jurisdiction logic that triggers unique consent flows based on user location, raising engineering complexity and compliance risk. The need to audit vendor data usage and honor deletion requests within 30-day windows adds operational overhead. Platforms now bake consent checks into audience activation, but suppressing records for opt-out users reduces reachable audience size and can impair cross-channel measurement accuracy.
*Our forecasts treat driver/restraint impacts as directional, not additive. The impact forecasts reflect baseline growth, mix effects, and variable interactions.
Segment Analysis
By Deployment: Cloud Infrastructure Extends Its Lead
The United States marketing analytics market size for cloud deployment stood at USD 3.73 billion in 2025 and is forecast to rise at a 13.74% CAGR, cementing its dominance over on-premise alternatives. Cloud captured 70.88% of United States marketing analytics market share in 2025, reflecting enterprises’ preference for elastic capacity, automatic feature releases, and usage-based billing. Cost avoidance from hardware refresh cycles and data-center overhead further tilts investment toward infrastructure-as-a-service.
Major providers now offer HIPAA-eligible environments, FedRAMP authorizations, and SOC 2 Type II attestations, giving compliance teams confidence to migrate regulated workloads. Even highly regulated sectors are piloting hybrid architectures that keep sensitive data on-premise while offloading compute-intensive analytics to the cloud. Machine-learning services embedded within the same environment reduce data-movement costs and speed model deployment, a benefit resonating with mid-market firms lacking data-science headcount.

By Analytics Type: Prescriptive Models Move Front and Center
Predictive analytics maintained the largest slice of the United States marketing analytics market size at USD 1.81 billion in 2025, equal to 34.35% share in 2025. Prescriptive analytics, however, is expanding at a 13.28% CAGR, reflecting marketer appetite for automated next-best-action recommendations that close the gap between insight and activation. Prescriptive engines evaluate permutations of send times, offer values, and creative variants, then trigger the highest-yield action in real time.
AutoML tooling embedded in cloud platforms automates feature engineering and model tuning, democratizing access for teams with limited data-science resources. Diagnostic and descriptive analytics remain table stakes for executive reporting, yet their reactive nature limits strategic impact. As algorithmic decision-making permeates daily operations, governance processes around explainability and bias review are becoming standard, particularly in financial-services and healthcare use cases.
By Application: Social Media Analytics Sustains Double-Digit Growth
Social media analytics represented USD 1.52 billion of United States marketing analytics market size in 2025 and is on track for a 12.98% CAGR through 2031. Closed-loop APIs from Meta, TikTok, and LinkedIn now allow hashed first-party identifiers to be sent server-side, increasing match accuracy even when cookies are blocked. Brands newly confident in post-privacy measurement are reallocating budget toward influencer collaborations and short-form video ads.
Email analytics follows closely, driven by predictive send-time optimization and content recommendation that raise open and click rates. Content-marketing analytics focusing on organic search and thought-leadership performance harness natural-language processing to gauge sentiment and topic resonance. Offline measurement tying store visits to digital exposures gains traction within omnichannel retail, though state privacy rules constrain certain location-based techniques, prompting wider adoption of consent-centric data collection.
By End User: Healthcare Accelerates, Retail Retains the Crown
Retail accounted for 22.19% of United States marketing analytics market share in 2025, relying on analytics to cut acquisition costs and synchronize promotions across web, mobile, and store touchpoints. Healthcare, although smaller in absolute terms, is growing at the fastest rate of 13.12% CAGR as providers leverage patient portals and telehealth platforms that generate behavioral data suitable for personalization. HIPAA rules require rigorous consent and de-identification, so vendors offer configuration toggles that isolate protected health information in secure enclaves.
BFSI firms adopt analytics to enhance credit-card acquisition and deposit growth, but compliance teams vet algorithms for fair lending adherence. Education, manufacturing, and travel each exploit analytics to refine enrollment funnels, partner programs, and dynamic pricing, respectively. Cross-vertical momentum underlines how the United States marketing analytics market continues to broaden its footprint beyond digital-native pioneers.
Geography Analysis
West-coast states dominate adoption owing to the density of technology headquarters in California and Washington. Early exposure to the California Consumer Privacy Act pushed companies to develop first-party data frameworks ahead of peers, sharpening the region’s competitive edge in cookieless measurement. Product analytics vendors such as Amplitude and Mixpanel thrive here, serving software-as-a-service firms that demand granular funnel insights.
The Northeast follows, led by New York’s concentration of banking, insurance, and healthcare systems. Financial institutions deploy consent-aware analytics that audit algorithmic decisions and log data lineage, meeting examiners’ expectations. Boston-area hospitals employ engagement platforms that respect HIPAA while personalizing appointment reminders and wellness content.
Southern and Midwestern enterprises are accelerating investment as retail chains headquartered in Texas and Georgia unify in-store and e-commerce data streams. Manufacturing clusters in Illinois and Ohio integrate channel-partner analytics to forecast distributor demand, though talent shortages slow adoption compared with coastal hubs. States such as Virginia, Colorado, and Utah enforce unique privacy provisions, compelling firms operating nationwide to implement the strictest protocol across all geographies to avoid non-compliance.
Regulatory Landscape
The United States marketing analytics environment is shaped by a state-by-state privacy patchwork and active Federal Trade Commission (FTC) enforcement around unfair or deceptive data practices. In May 2026, the FTC settled with data broker Kochava (and subsidiary Collective Data Solutions), restricting the sale of sensitive location data without affirmative express consent and requiring supplier assessment and incident-reporting controls. For marketers and analytics providers, the settlement signals that third-party location data and downstream sharing practices face heightened scrutiny.
In May 2026, the FTC also announced settlements with Cox Media Group and two marketing firms (MindSift LLC and 1010 Digital Works LLC) tied to allegedly deceptive AI-driven targeting claims. These actions reinforce that marketing analytics and adtech vendors must substantiate AI performance statements and disclose data collection and use. Rulemaking and standards work adds further compliance structure. Amendments to the Children’s Online Privacy Protection Act (COPPA) Rule were finalized in April 2025, expanding the scope of covered personal information (including biometric and government-issued identifiers) with full compliance required by April 22, 2026. This raises requirements for analytics embedded in youth-directed digital experiences and identity resolution. Organizations also reference the NIST Privacy Framework (version 1.1 updated in 2024) to operationalize privacy risk management across the system development life cycle, which increasingly influences governance expectations for consent handling, data minimization, and privacy-preserving analytics techniques used for attribution and personalization.
Value Chain Analysis
The value chain starts with data generation and collection across owned channels (web, mobile apps, CRM, commerce, email) and paid media platforms, then moves into ingestion and storage in cloud infrastructure layers. Amazon Web Services, Google Cloud, and Microsoft Azure are key enablers for scalable compute, streaming, and data lake or warehouse workloads. Analytics and measurement providers turn these inputs into models and dashboards for attribution, segmentation, and optimization, while activation connections push insights back to ad networks, email service providers, and commerce systems. Distribution typically happens through direct enterprise sales and, for integration-heavy deployments, through implementation partners and agencies.
Privacy and signal loss have added intermediaries and control points across the chain. Data clean rooms and privacy-enhancing technologies (such as hashing, encryption, and noise injection) are increasingly used to collaborate on measurement while limiting exposure of personal data, reflecting the operational impact of state-level privacy requirements and consent signals. A persistent constraint is delivery capacity tied to scarce data engineering and analytics talent, which slows implementation and ongoing model operations for mid-market and regulated buyers. This is pushing vendors toward no-code connectors, managed services, and more automated data preparation to shorten time-to-insight.
Competitive Landscape
The United States marketing analytics market balances established platform vendors and nimble specialists. Adobe, Salesforce, Microsoft, Oracle, and IBM cross-sell analytics modules into existing CRM, commerce, and content portfolios, simplifying procurement for global brands. Microsoft’s Copilot lets marketers craft segments via natural language, while Adobe’s GenStudio auto-produces creative assets consistent with brand standards.
Mid-market share shifts toward consumption-priced specialists such as Amplitude, Mixpanel, and Heap. Their event-centric data models excel for digital products where user journeys unfold inside web or mobile applications. No-code analytics lowers barriers, enabling product managers to run cohort analyses without SQL. Yet enterprise buyers weigh these gains against concerns around feature depth, global support, and governance.
White-space opportunity surfaces in privacy-preserving analytics. Techniques such as differential privacy and federated learning remain nascent but promise compliant cross-brand insights without raw-data exchange. Vendors also race to embed low-code orchestration that auto-pushes insights into ad networks and email services, critical for marketers who lack engineering bandwidth. As talent scarcity persists, ease of deployment and automated model maintenance will increasingly separate leaders from laggards.
United States Marketing Analytics Industry Leaders
-
IBM Corporation
-
Microsoft Corporation
-
Oracle Corporation
-
Salesforce Inc.
-
Adobe Inc.
- *Disclaimer: Major Players sorted in no particular order
Market Opportunities and Future Outlook
Privacy-driven measurement redesign is creating room for offerings that unify marketing mix modeling (MMM), multi-touch attribution, and clean-room based collaboration under a single governance and consent layer. Work by trade associations, including the Interactive Advertising Bureau’s 2025 guidance on data clean rooms and state privacy perspectives, highlights the ongoing operational complexity behind this redesign. That, in turn, supports demand for products that standardize audience activation, match workflows, and aggregated reporting across platforms while respecting jurisdictional constraints.
AI-assisted marketing decisioning and workflow automation also represent a concrete whitespace, supported by visible vendor and buyer actions during 2026. NIQ introduced NIQ Cadence in June 2026 as a compound AI operating system featuring multiple specialized agents for marketing effectiveness, which signals further productization of agent-based measurement and budget optimization. Enterprise hiring and roadmap activity adds another near-term indicator of spend shifting toward in-house capability build-outs, including Comcast Business recruiting a VP for marketing analytics and technology in 2026 and DIRECTV recruiting senior advanced analytics leadership in July 2026. These moves increase demand for interoperable platforms, governed self-service analytics, and integration toolkits that reduce reliance on scarce data engineering resources.
Recent Industry Developments
- June 2026: Palantir and Zeta Global announced a strategic partnership to integrate Palantir Foundry with the Zeta Marketing Platform to build unified data and AI infrastructure for marketing. The combination targets enterprise-grade data unification alongside marketing activation and measurement, tightening the linkage between operational data platforms and campaign analytics. It also reinforces the shift toward AI-enabled orchestration that runs across multiple systems rather than inside a single marketing suite.
- October 2025: IBM expanded its work with Oracle around AI agents and hybrid cloud capabilities, building on the firms’ broader collaboration around enterprise deployments. For marketing analytics buyers running Oracle-centric stacks, this supports more integrated data and AI workflows across applications and infrastructure. It also increases competitive pressure on suite vendors to deliver governed agent-based analytics that works across heterogeneous environments.
- May 2024: IBM and Salesforce expanded their partnership to advance open and trusted AI and data ecosystem integrations. The collaboration strengthens pathways for connecting CRM and marketing data with analytics and AI services while addressing governance expectations. It also supports enterprise demand for cross-platform interoperability as first-party data strategies become central to measurement and personalization.
Research Methodology Framework and Report Scope
Market Definition and Coverage
For this study, the market covers revenue earned in the United States from marketing analytics used to measure, attribute, and improve marketing performance across channels, where outputs are used to plan budgets, optimize campaigns, and track customer outcomes.
Scope exclusions: Excludes pure media buying and ad-serving revenue when analytics functionality is not a paid component.
Segmentation Overview
- By Deployment
- Cloud
- On-Premise
- By Analytics Type
- Descriptive Analytics
- Diagnostic Analytics
- Predictive Analytics
- Prescriptive Analytics
- By Application
- Online Marketing
- E-Mail Marketing
- Content Marketing
- Social Media Marketing
- Other Applications
- By End User
- Retail
- Banking, Financial Services and Insurance
- Education
- Healthcare
- Manufacturing
- Travel and Hospitality
- Other End Users
Data Sources, Market Sizing, and Validation
Desk Research
Desk research was first used to set the market perimeter and create a clean list of demand signals that can be tracked year over year. We relied on public and official references such as the US Census Bureau (Digital Economy and e-commerce releases), Bureau of Labor Statistics (employment and wage series for marketing and analytics roles), Federal Trade Commission materials on advertising and privacy, and National Institute of Standards and Technology guidance that influences data handling expectations.
To ground adoption and spend patterns, we also reviewed company filings and investor presentations for analytics and marketing software providers, product documentation, and reputable press coverage on privacy changes and measurement shifts. Patent database screening was used to spot where new analytics capabilities are being commercialized, and a paid subscription for company financials and news helped cross-check revenue direction for the most visible suppliers. The sources listed here are illustrative, and many other public references were used for data collection, validation, and clarification.
Primary Interviews and Surveys
Primary work was used to confirm what buyers in the United States actually pay for, what gets bundled, and how usage is split across cloud and on-premise delivery. We spoke with a mix of marketing leaders, analytics owners, and operations teams across major US regions, and we also tested assumptions with implementers and data specialists who see pricing and renewal behavior across customer types. Where secondary data was thin, we used these inputs to triangulate adoption rates, typical contract structures, and realistic year-over-year budget movements.
Distribution of primary research fieldwork respondents
| Company type | Respondent position |
|---|---|
| Top tier: 25% | CXOs: 12% |
| Mid tier: 61% | Functional/Unit leaders: 29% |
| Smaller Players: 14% | Managers: 59% |
Market-Sizing & Forecasting
Sizing started with a top-down build where US marketing and digital spend signals were reconstructed into an addressable measurement and optimization pool, then filtered by the share of organizations actively running analytics-led planning and performance tracking. Because buyers often purchase capabilities in bundles, we used primary inputs to separate paid analytics value from adjacent tooling, and then applied those splits consistently by year.
The model used practical inputs such as US advertising and marketing spend direction, share of digital versus offline channels, cloud adoption rates for analytics workloads, typical contract values for enterprise versus mid-market users, and the pace of privacy-led measurement changes that affect refresh cycles. Results were corroborated through selective bottom-up approximations, including supplier revenue pattern checks and sampled ASP-time volume calculations for common contract types. When gaps existed, we applied conservative ranges and tightened them after follow-up calls.
For forecasting, scenario analysis was applied around privacy regulation intensity and cookie deprecation timing, then the final path was aligned to expert consensus on budget growth, renewal behavior, and product migration timing. The output remains repeatable because each driver is observable, can be refreshed annually, and is linked back to a clear demand-side indicator.
Data Validation & Update Cycle
Validation was done through several passes so that extreme outputs are caught early and corrected with evidence. We compared the modeled totals with independent signals such as marketing budget trend lines, software spend direction, and hiring patterns for analytics roles, then investigated variances that did not match what interviewees were seeing in the field.
Before sign-off, the model is reviewed for unit consistency, year-over-year jumps, and currency timing. Follow-up outreach is triggered when a key assumption shifts or a market event appears material. Reports are refreshed annually, and interim updates are made when major events such as regulatory changes or sharp spending swings occur. Right before delivery, a final review is completed so clients receive the most current view available.
Mordor Intelligence's United States Marketing Analytics Market Estimate Compared With Other Published Estimates
It is normal to see different market values for US marketing analytics because publishers do not always count the same revenue streams, and they also pick different starting years and forecast windows. Some estimates emphasize software only, others blend software and services, and a few include adjacent marketing execution items that can inflate totals.
Managed services and implementation-only fees are a common inclusion that can move totals upward, and this is outside Mordor Intelligence's scope when it is not directly tied to paid analytics functionality delivered to the buyer. Differences also come from how bundles are split between analytics and broader marketing suites, how fast average selling prices are assumed to rise, and whether privacy-driven measurement shifts are treated as a temporary headwind or a sustained driver.
Benchmark comparison
| Source | Market Size | Gaps in Research Methodology |
|---|---|---|
| Mordor Intelligence | USD 5.26 B (2025) | |
| Regional Consultancy A | USD 5.90 B (2024) | Uses an earlier base year and appears to blend a wider set of marketing analytics tools and related services, which can lift the starting value even before forecasting assumptions are applied. |
| Industry Research Group B | USD 2.40 B (2027) | Tracks marketing analytics software only, so services and certain paid analytics modules embedded in broader platforms may be excluded, leading to a smaller reported number even in a later year. |
Overall, the spread is mostly explained by what is counted as analytics revenue, plus the time period used for the stated value. By keeping inclusions tied to paid analytics functionality and cross-checking totals against budget and adoption signals, our estimate stays traceable to clear variables that can be refreshed and re-tested each year.
Key Questions Answered in the Report
What was the value of the United States marketing analytics market in 2026?
It reached USD 5.92 billion and is forecast to climb to USD 10.67 billion by 2031 at a 12.54% CAGR.
Which deployment model leads spending?
Cloud deployment led with 70.88% share in 2025 and is expanding at a 13.74% CAGR as enterprises migrate from on-premise stacks.
Which application area is expanding fastest?
Social media analytics is growing at a 12.98% CAGR as platforms provide server-side APIs for accurate attribution.
Why is healthcare the fastest-growing vertical?
Patient portals and telehealth generate rich behavioral data, and vendors offer HIPAA-ready solutions, pushing healthcare to a 13.12% CAGR.
How are state privacy laws affecting analytics strategies?
A patchwork of 19 statutes forces companies to adopt first-party data frameworks and consent management systems to stay compliant.
What role does AI play in vendor differentiation?
Leading platforms embed generative and prescriptive AI to automate content creation, segmentation, and next-best-action orchestration, reducing manual effort.