Market Overview
| Study Period | 2020 - 2031 |
|---|---|
| Forecast Data Period | 2026 - 2031 |
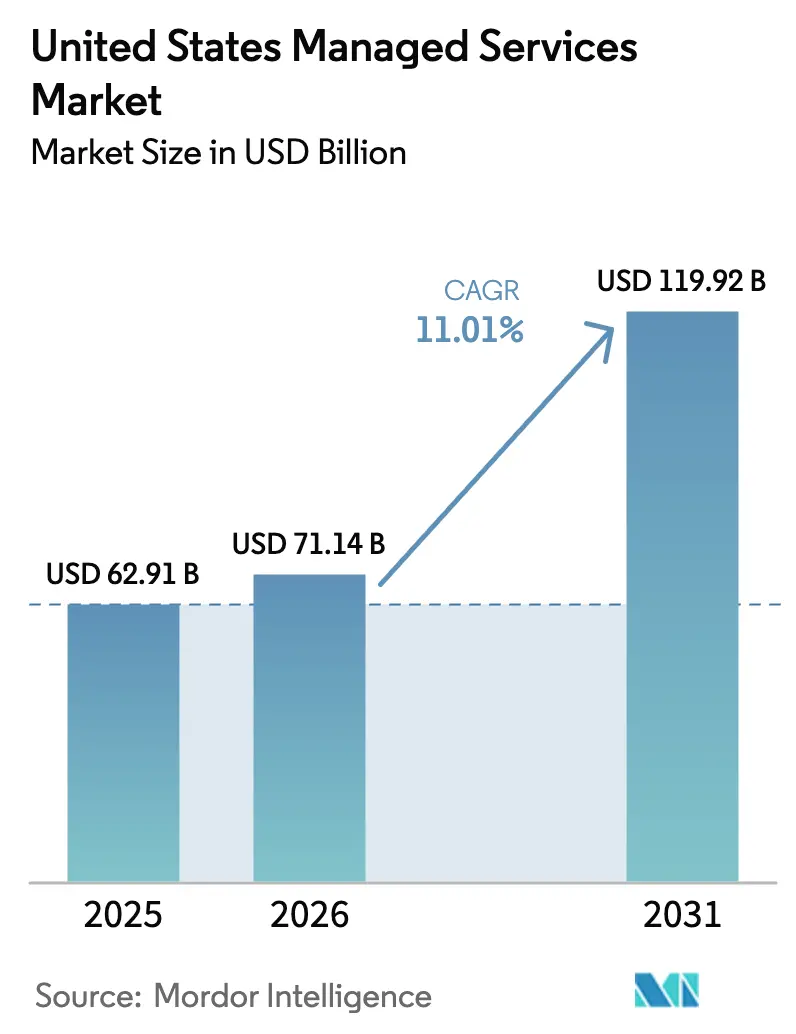
| Base Year Market Size (2025) | USD 62.91 Billion |
| Market Size (2026) | USD 71.14 Billion |
| Market Size (2031) | USD 119.92 Billion |
| Growth Rate (2026 - 2031) | 11.01% CAGR |
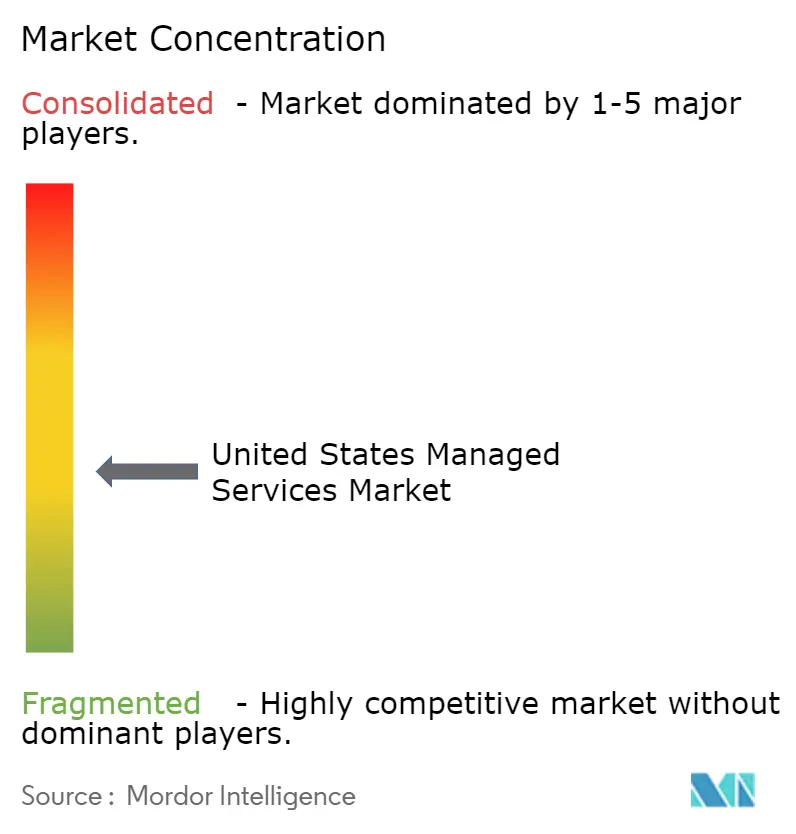
| Market Concentration | Medium |
Major Players *Disclaimer: Major Players sorted in no particular order Image © Mordor Intelligence. Reuse requires attribution under CC BY 4.0. | |
United States Managed Services Market Analysis by Mordor Intelligence
The United States managed services market size is projected to expand from USD 62.91 billion in 2025 and USD 71.14 billion in 2026 to USD 119.92 billion by 2031, registering a CAGR of 11.01% between 2026 to 2031. The expansion rests less on budget growth than on a structural shift toward outsourcing cloud, security, and compliance functions. Mandatory 24/7 monitoring for cyber-insurance renewal, rapid hybrid-cloud sprawl, and Securities and Exchange Commission (SEC) disclosure rules that demand continuous control over third-party risks combine to move spending from capital budgets to operating budgets. Enterprises also view managed services as the fastest path to remedying the skills gap in cloud security architecture, a role that commands an annual compensation of USD 165,000 in major metros. Small and medium enterprises (SMEs) amplify demand because committed-use cloud discounts introduced in 2024 give them cost parity with depreciated on-premise hardware, erasing the rationale for self-hosting.
Key Report Takeaways
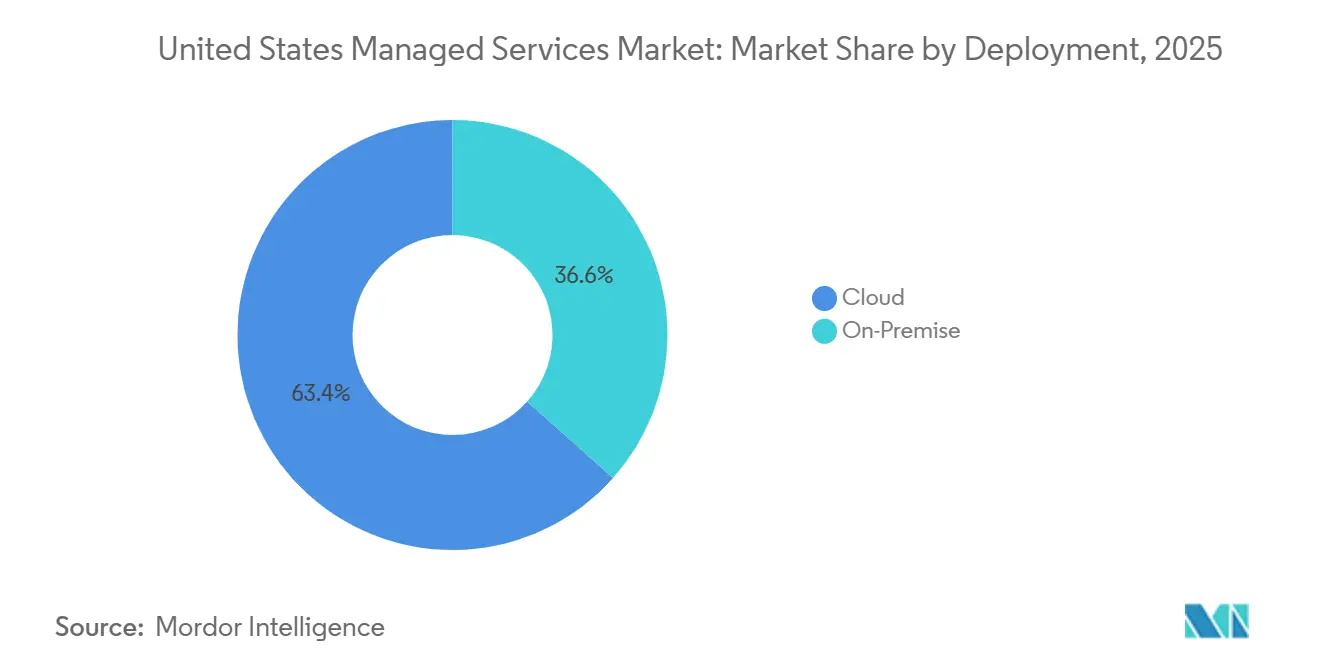
- By deployment, cloud-based services held 63.41% of the United States managed services market share in 2025 and are projected to expand at an 11.49% CAGR through 2031.
- By service type, managed data center services led with a 24.68% share in 2025, and managed security services are forecast to advance at a 12.13% CAGR to 2031.
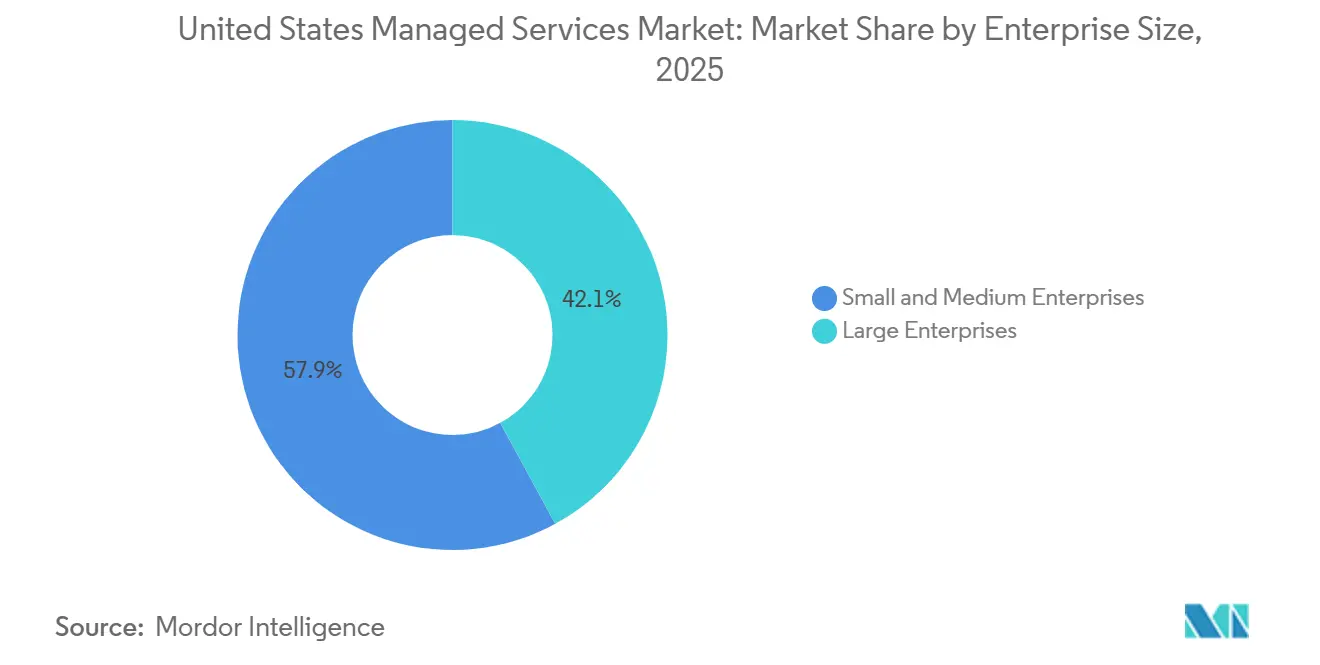
- By enterprise size, SMEs accounted for 57.93% of 2025 spending and are also set to maintain the fastest growth at an 11.46% CAGR through 2031.
- By end-user vertical, BFSI contributed 24.74% of the United States managed services market share in 2025, and healthcare is projected to record the fastest growth at a 12.24% CAGR through 2031.
Note: Market size and forecast figures in this report are generated using Mordor Intelligence’s proprietary estimation framework, updated with the latest available data and insights as of January 2026.
United States Managed Services Market Trends and Insights
Drivers Impact Analysis*
| Driver | (~) % Impact on CAGR Forecast | Geographic Relevance | Impact Timeline |
|---|---|---|---|
| Growing Enterprise Shift Toward Hybrid-Cloud Management | +2.4% | National, with concentration in technology hubs (San Francisco, Seattle, Austin) and financial centers (New York, Charlotte) | Medium term (2-4 years) |
| Surge in Multi-Cloud Complexity Driving Demand for Centralized MSPs | +2.1% | National, particularly acute in retail and healthcare verticals managing AWS, Azure, and Google Cloud simultaneously | Short term (≤ 2 years) |
| Rapid Escalation of Cyber-Insurance Prerequisites | +1.9% | National, with higher impact in regulated industries (BFSI, healthcare, energy) subject to state-level data breach notification laws | Short term (≤ 2 years) |
| SME Preference for OPEX-Based IT | +1.7% | National, with early adoption in service-oriented sectors (professional services, media, SaaS providers) | Medium term (2-4 years) |
| Edge-Computing Rollouts in U.S. Manufacturing Hubs | +1.3% | Regional, concentrated in Midwest manufacturing belt (Michigan, Ohio, Indiana) and Southeast automotive corridors (Alabama, Tennessee, South Carolina) | Long term (≥ 4 years) |
| AI-Ops Automation Boosting MSP Margins | +1.6% | National, with fastest adoption among large MSPs serving Fortune 1000 accounts | Medium term (2-4 years) |
| Source: Mordor Intelligence | |||
Growing Enterprise Shift Toward Hybrid-Cloud Management
U.S. enterprises run hybrid architectures that blend on-premise data centers, multiple public clouds, and edge locations, yet fewer than one-third possess in-house expertise to optimize costs and security. Configuration drift rises 40-60% in such estates, creating vulnerabilities that managed service providers (MSPs) monetize by offering unified policy enforcement and automated workload placement. Banks lead adoption because OCC guidance requires resilience testing across all critical third-party dependencies. MSPs that consolidate monitoring and failover orchestration, therefore, win multiyear contracts that bundle infrastructure with security services.
Surge in Multi-Cloud Complexity Driving Demand for Centralized MSPs
The average enterprise now operates 3.2 public cloud platforms, up from 2.1 in 2022. Fragmented identity and access management increase the attack surface; Verizon attributed 34% of 2024 cloud breaches to misconfigured permissions.[1]Verizon Business, “2025 Data Breach Investigations Report,” verizon.com Centralized MSPs deploy cloud security posture management tools that scan AWS, Azure, and Google Cloud for deviations from the Center for Internet Security Benchmarks. Retailers and healthcare providers feel pressure because customer-facing apps are shifting to the cloud while payment and EHR systems still reside on-premises. Outsourcing becomes rational when specialist salaries in each hyperscaler’s proprietary stack top USD 180,000, well above SME budgets.
Rapid Escalation of Cyber-Insurance Prerequisites
Ransomware claims of USD 8.2 billion in 2023 pushed insurers to make continuous security operations center (SOC) monitoring a prerequisite for coverage. The Coalition reported that policyholders using managed detection and response services experienced 58% fewer successful ransomware attacks.[2]Coalition Inc., “2025 Cyber Insurance Claims Report,” coalitioninc.com Quarterly audits and tabletop exercises facilitated by third-party MSPs have turned what was once episodic consulting into recurring revenue. Premium hikes in BFSI and healthcare accelerate demand because managed security spending offsets reduced premiums, yielding a net cost benefit to buyers.
SME Preference for OPEX-Based IT
SMEs favor month-to-month cloud contracts that convert capital investment into predictable operating expenses. Federal Reserve rate increases during 2022-2023 raised borrowing costs, making hardware financing unattractive. MSPs responded with self-service onboarding portals and packaged SLAs priced per user per month, allowing companies with fewer than 250 employees to access enterprise-grade capabilities. The United States managed services market penetration is therefore now higher among SMEs than among firms with 10,000+ employees, contradicting historical patterns.
Restraints Impact Analysis*
| Restraint | (~) % Impact on CAGR Forecast | Geographic Relevance | Impact Timeline |
|---|---|---|---|
| Skills Shortage Inflates U.S. MSP Labor Costs | -1.8% | National, with acute impact in high-cost metros (San Francisco, New York, Boston, Seattle) where cybersecurity talent commands 30-40% wage premiums | Short term (≤ 2 years) |
| Vendor Lock-In Fears Among Regulated Industries | -0.9% | National, concentrated in BFSI and healthcare sectors subject to OCC, FDIC, and HHS vendor management guidelines | Medium term (2-4 years) |
| Rising Compliance Burden From SEC Cybersecurity Rules | -1.1% | National, affecting all public companies and their MSP vendors under SEC's December 2023 incident disclosure requirements | Short term (≤ 2 years) |
| Data-Sovereignty Pushback on Offshore NOC Models | -0.7% | National, with highest impact on defense contractors and critical infrastructure operators subject to CISA reporting mandates | Long term (≥ 4 years) |
| Source: Mordor Intelligence | |||
Skills Shortage Inflates U.S. MSP Labor Costs
CyberSeek recorded 450,000 unfilled cybersecurity roles in 2025.[3]CyberSeek, “Cybersecurity Supply/Demand Heat Map,” cyberseek.org Median compensation for cloud security architects climbed 22% since 2023, compressing margins for labor-intensive service lines such as managed network operations. Providers must either invest in AI-Ops to improve engineer-to-device ratios or accept lower profitability. Large MSPs with proprietary automation gain cost advantages, while smaller firms face consolidation pressure.
Rising Compliance Burden From SEC Cybersecurity Rules
SEC rules effective in December 2023 require public issuers to report material incidents within 4 business days, shifting liability to MSPs that manage detection and response. Providers now purchase errors and omissions policies with cyber riders, raising operating expenses by up to 5%. Contract negotiations increasingly require indemnification clauses that smaller MSPs cannot support, pushing Fortune 1000 accounts toward providers with USD 100 million in liability coverage.
*Our forecasts treat driver/restraint impacts as directional, not additive. The impact forecasts reflect baseline growth, mix effects, and variable interactions.
Segment Analysis
By Deployment: Cloud Consolidation Drives Long-Term Gains
Cloud-based services commanded 63.41% of the United States managed services market share in 2025 and are projected to grow at an 11.49% CAGR through 2031. Committed-use discounts from hyperscalers reduced multiyear cloud costs to parity with depreciated on-premises hardware, erasing capital-expenditure advantages. The United States managed services market for cloud deployments is therefore positioned to surpass USD 75 billion by 2031, while on-premises growth remains muted at single-digit rates. On-premises solutions persist in defense contracting, high-frequency trading, and medical imaging, yet even these verticals are adopting hybrid models, shifting latency-tolerant workloads to public cloud while retaining data-sovereignty-sensitive applications in local environments.
Performance differentials reinforce the cloud trend. Azure-based managed services detect ransomware on average 14 hours faster than on-premises equivalents. CFOs increasingly quantify the opportunity cost of delayed detection, concluding that migration savings outweigh sunk hardware costs. As threat telemetry pooled across thousands of tenants improves machine-learning models, the cloud advantage compounds, locking more enterprises into consumption-based contracts.


By Service Type: Managed Security Extends Lead Over Infrastructure
Managed security services are projected to grow at a 12.13% CAGR through 2031, outpacing the broader United States managed services market. Breach costs averaging USD 4.54 million motivate boards to treat continuous monitoring as business continuity rather than discretionary spend. Managed data center services held a 24.68% share in 2025 but face pricing pressure as hyperscalers automate provisioning. The United States managed services market for security offerings is forecast to eclipse USD 40 billion by 2031, while data center services are forecast to plateau near current levels.
Ransomware-as-a-service lowered barriers to attack, with 68% of incidents in 2024 deleting backups, up from 42% in 2022. A yearly fee of USD 150,000 for 24/7 managed detection compares favorably to potential breach losses, driving uptake among mid-market firms. Compliance catalysts, regulatory requirements such as SEC disclosure rules, and insurer audits are playing a significant role in firmly integrating security outsourcing into the operational budgets of organizations.
By Enterprise Size: SMEs Propel Volume Growth
SMEs accounted for 57.93% of the market in 2025 and are expected to grow at an 11.46% CAGR, reshaping provider go-to-market strategies. The United States managed services market size attributable to SMEs is projected to exceed USD 70 billion by 2031 as founders prioritize rapid deployment over custom architectures. Online provisioning portals, fixed-price bundles, and monthly billing align with SME cash-flow cycles, fostering faster adoption than among global enterprises that navigate longer procurement cycles.
Large enterprises still outsource commodity tasks such as endpoint management and help desk support, but retain strategic cloud architecture in-house. As AI-Ops reduces support tickets through predictive remediation, providers reallocate engineering talent to advisory roles, expanding wallet share within both SME and large enterprise accounts. The resulting scale economies allow MSPs to lower per-user pricing, further widening the SME adoption gap.
By End-User Vertical: Healthcare Leads Growth, BFSI Guards Scale
Healthcare is projected to advance at a 12.24% CAGR, the fastest among verticals, fueled by EHR cloud migrations and stringent HIPAA penalties totaling USD 140 million in 2024. The United States managed services market linked to healthcare could exceed USD 18 billion by 2031 as providers adopt packaged HIPAA-compliant security and data analytics services. Specialized MSPs command 25-30% price premiums by bundling encryption key management, audit logging, and incident response tailored to protected health information.
BFSI retained a 24.74% share in 2025, the largest vertical slice, owing to OCC mandates requiring banks to demonstrate ongoing oversight of critical vendors. Zero-trust network architectures and operational-resilience testing drive multiyear contracts that bundle infrastructure, application management, and security under unified SLAs. Retail, IT-telecom, and media segments maintain steady adoption for omnichannel inventory, network operations, and digital rights management. IoT rollouts in manufacturing and energy sectors add incremental demand for edge-computing managed services, although their share remains smaller than in heavily regulated industries.
Geography Analysis
Per-capita spending on managed services is concentrated in technology hubs such as San Francisco, Seattle, and Austin, where venture-backed startups and SaaS vendors favor outsourcing IT to accelerate product releases. Financial centers in New York, Charlotte, and Chicago are driving demand for managed security as banks align with OCC resilience guidance and SEC disclosure requirements. Manufacturing corridors in the Midwest and Southeast adopt edge-computing managed services to support IoT sensor networks that require real-time analytics at plant sites.
Labor cost differentials influence provider location strategy. Network operations centers in Omaha, Raleigh, and Salt Lake City operate with 25-35% lower wages than those in coastal metros, yet they access graduates from state universities, enabling providers to price commodity services competitively. High-value cloud architecture and threat-hunting roles remain in primary markets to leverage deeper talent pools. However, data-sovereignty constraints under the Cyber Incident Reporting for Critical Infrastructure Act of 2022 push defense contractors to demand on-shore monitoring, limiting the appeal of offshore centers.
Regulatory patchwork adds regional complexity. California’s Consumer Privacy Act and New York’s SHIELD Act impose stricter breach-notification requirements than federal statutes, forcing MSPs to maintain state-specific compliance frameworks. Smaller providers struggle with the legal overhead, driving consolidation toward national MSPs with dedicated regulatory teams. As additional states introduce privacy bills, regional compliance expertise becomes a differentiator in the United States managed services market.
Competitive Landscape
Top-tier integrators Accenture, IBM, Kyndryl, and Cognizant combine infrastructure, applications, and security into transformational contracts spanning 5 or more years. Together with other global providers, the top 10 vendors captured roughly 45% of 2025 revenue, indicating moderate concentration. Hyperscaler-affiliated MSP programs from Microsoft Azure, Amazon Web Services, and Google Cloud bundle infrastructure consumption with managed services discounts, commoditizing tier-1 support, and deepening client lock-in through proprietary automation.
Specialized MSPs flourish by targeting regulated niches. Providers that package HIPAA-compliant EHR hosting, OCC-aligned operational resilience testing, or FedRAMP-authorized cloud management win contracts that global firms cannot cost-effectively address. Patent activity underscores the shift toward automation. AIOps filings rose 340% between 2023 and 2025, and large incumbents now embed predictive analytics to shrink incident response times. AI-driven remediation lowers labor intensity, allowing niche players to compete on price while protecting margins.
Competitive dynamics increasingly revolve around intellectual-property assets and liability capacity. Providers with proprietary data sets train more accurate anomaly-detection models, widening performance gaps. At the same time, Fortune 1000 buyers demand USD 100 million liability coverage to offset potential SEC fines, favoring vendors with strong balance sheets. The outcome is a bifurcated United States managed services market in which tier-1 integrators and well-capitalized specialists expand share, while small, generalist MSPs consolidate or exit.
United States Managed Services Industry Leaders
Accenture plc
AT&T Inc.
Cisco Systems Inc.
Fujitsu Limited
IBM Corporation
- *Disclaimer: Major Players sorted in no particular order

Recent Industry Developments
- December 2025: Infosys Ltd. received ISO 27001 certification for its managed cloud services platform, reinforcing credibility in regulated verticals.
- October 2025: Microsoft Corporation expanded its Azure Expert MSP program with AI-based workload optimization that migrates compute to low-cost regions during off-peak hours, cutting client cloud bills by up to 25%.
- September 2025: Kyndryl Holdings announced a USD 500 million plan to build 12 on-shore cloud management centers dedicated to healthcare and financial-services customers.
- August 2025: Wipro Limited introduced a managed SAP S/4HANA migration service, bundling application management, infrastructure hosting, and change-management consulting.


Research Methodology Framework and Report Scope
Market Definitions and Key Coverage
Our study frames the United States managed services market as the recurring revenue that third-party providers earn for continuously operating, monitoring, and optimizing clients' IT infrastructure, networks, security stacks, and collaboration workloads under subscription or outcome-based contracts.
(Scope exclusions) One-off consulting projects, break-fix support, cloud-license resale margins, and any services delivered outside U.S. borders are left out.
Segmentation Overview
- By Deployment
- On-Premise
- Cloud
- By Service Type
- Managed Data Center
- Managed Security
- Managed Communications
- Managed Network
- Other Service Types
- By Enterprise Size
- Small and Medium Enterprises
- Large Enterprises
- By End-User Vertical
- Banking, financial services and insurance (BFSI)
- IT and Telecom
- Healthcare
- Entertainment and Media
- Retail
- Other End-User Verticals
Detailed Research Methodology and Data Validation
Primary Research
Mordor analysts conducted expert interviews and online surveys with MSP executives, CIOs in BFSI, healthcare, retail, and manufacturing, regional channel partners, and cybersecurity consultants across every U.S. census division. These discussions clarified adoption triggers, average seat volumes, and price-escalation norms, filling data gaps revealed during desk work.
Desk Research
We began with government datasets, Bureau of Labor Statistics ICT spending tables, the U.S. Census Quarterly Services Survey, and International Trade Administration shipment codes, which ground the demand pool in hard economic signals. Industry groups such as CompTIA, the National Cybersecurity Alliance, and the Telecommunications Industry Association supplied penetration ratios and median contract pricing. Company 10-Ks, earnings calls, and reputable press feeds enriched provider-level splits, while paid repositories like D&B Hoovers and Dow Jones Factiva helped us cross-check revenue lines and M&A activity. The sources named illustrate our desk research lattice; many additional public and proprietary references were consulted for completeness.
Market-Sizing & Forecasting
A top-down demand pool starts with national IT services outlay, then applies outsourcing propensity, hybrid-cloud workload share, and managed security uptake to size the addressable pie. Selective bottom-up checks, supplier roll-ups, sampled ASP × managed-device counts, and data-center footprint audits are used to validate and tune totals. Core variables feeding our multivariate regression include cybersecurity incident counts, 5G private-network deployments, SME IT hiring gaps, MSP seat-price indices, and cloud-migration ratios. Scenario analysis layers macro or regulatory shocks onto the base case before final numbers are locked.
Data Validation & Update Cycle
Outputs pass three analyst reviews; outliers spark re-engagement with sources, and any material event, large M&A, new cyber mandate, or federal stimulus, triggers an interim refresh. Full rebuilds occur annually, so clients always receive the latest view.
Why Mordor's US Managed Services Baseline Commands Reliability
Published figures differ because firms track unlike service mixes, apply varied currency conversions, and refresh their models on dissimilar cadences.
Key gap drivers we observe are the folding in of project-based services, inclusion of Canadian and Mexican revenue within 'U.S.' totals, and optimistic escalation factors that lack primary validation.
Benchmark comparison
| Market Size | Anonymized source | Primary gap driver |
|---|---|---|
| USD 64.19 B (2025) | Mordor Intelligence | - |
| USD 88.13 B (2024) | Global Consultancy A | Bundles hosted MIS and resale margins; scant primary inquiry |
| USD 93.88 B (2024) | Industry Association B | Counts advisory projects; omits long-tail MSPs |
| USD 130.11 B (2024) | Trade Journal C | Uses North America scope; aggressive CAGR without device-level checks |
The comparison shows that by anchoring to verifiable U.S. recurring revenue, reconciling top-down and bottom-up signals, and refreshing inputs through live market conversations, Mordor provides a balanced, transparent benchmark that decision-makers can trust.


Key Questions Answered in the Report
How large is the United States managed services market in 2026?
The market is valued at USD 71.14 billion in 2026 and is forecast to reach USD 119.92 billion by 2031.
Which service type is growing fastest in managed services?
Managed security services are expanding at a 12.13% CAGR through 2031 as enterprises respond to ransomware and compliance mandates.
Why are SMEs adopting managed services more quickly than large enterprises?
SMEs prefer operating-expense contracts, face higher borrowing costs for hardware, and can onboard through self-service portals that simplify procurement.
What regulation is driving demand for continuous security monitoring?
The SEC’s 2023 cybersecurity disclosure rule requires public companies to report material incidents within four business days, pushing firms toward 24/7 managed detection.
Which vertical shows the highest growth rate?
Healthcare leads, advancing at a 12.24% CAGR, propelled by EHR cloud migration and strict HIPAA enforcement.
How does cloud deployment compare with on-premise in market share?
Cloud-based managed services held 63.41% share in 2025 and continue to grow faster than on-premises alternatives, supported by hyperscaler discounts and superior threat detection.
Page last updated on:


