
Market Overview
| Study Period | 2020 - 2031 |
|---|---|
| Forecast Data Period | 2026 - 2031 |
| Base Year Market Size (2025) | USD 1.15 Billion |
| Market Size (2026) | USD 1.26 Billion |
| Market Size (2031) | USD 1.96 Billion |
| Growth Rate (2026 - 2031) | 9.28 % |
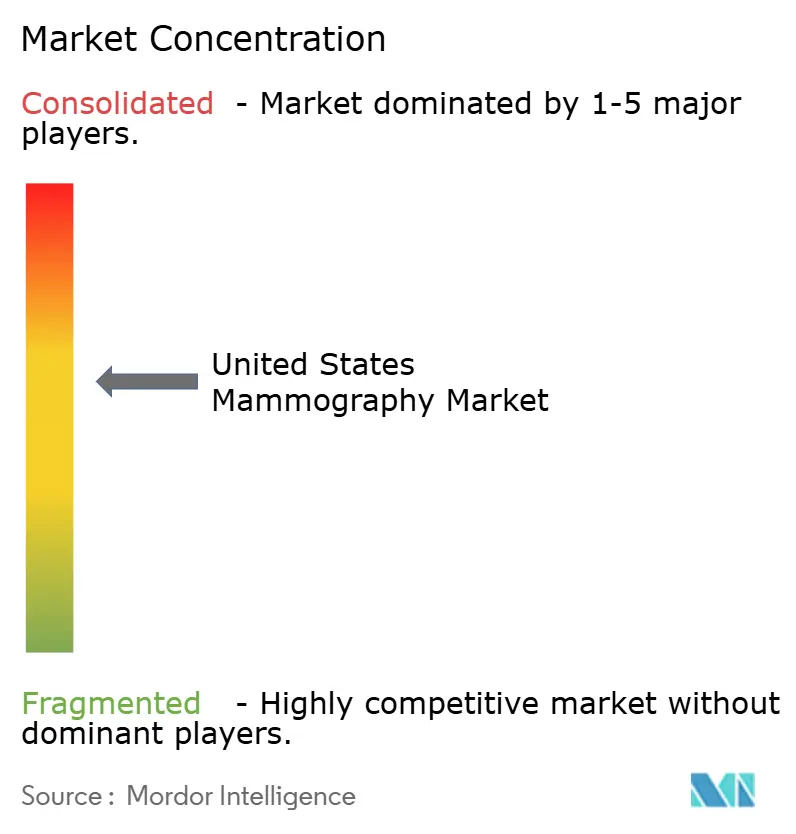
| Market Concentration | Medium |
Major Players *Disclaimer: Major Players sorted in no particular order Image © Mordor Intelligence. Reuse requires attribution under CC BY 4.0. | |
United States Mammography Market Analysis by Mordor Intelligence
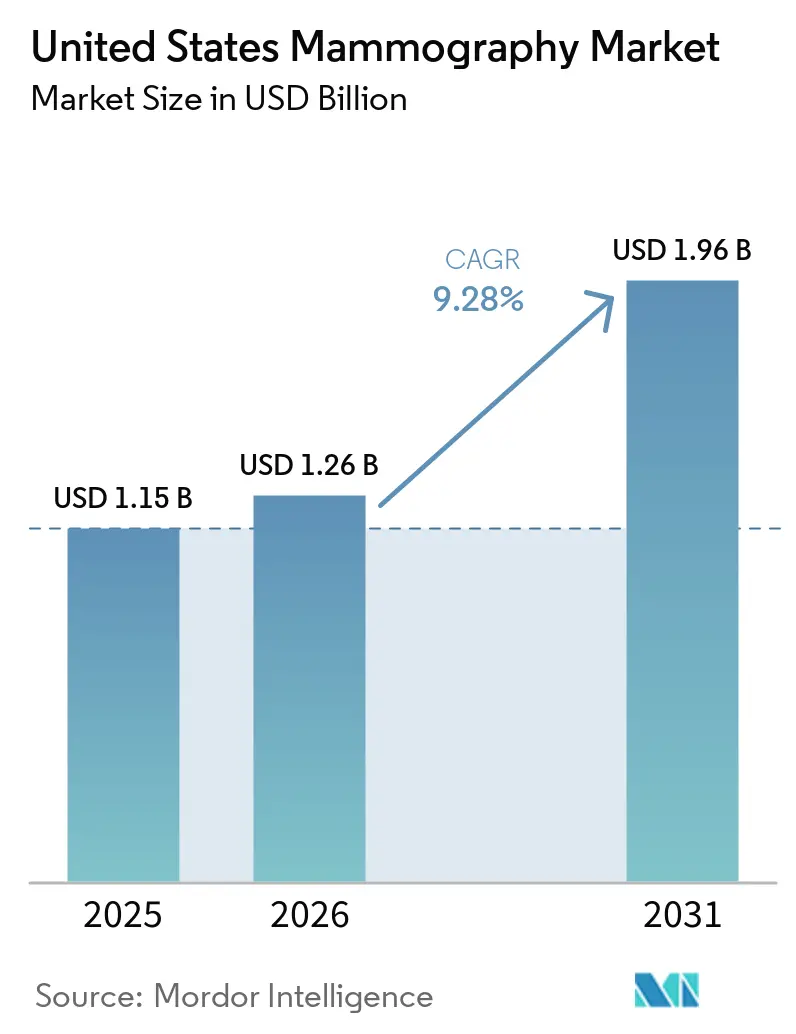
The United States mammography market size in 2026 is estimated at USD 1.26 billion, growing from 2025 value of USD 1.15 billion with 2031 projections showing USD 1.96 billion, growing at 9.28% CAGR over 2026-2031. Sustained growth reflects the interaction of federal policy, rapid technology upgrades, and demographic pressures that increase screening demand well beyond basic equipment‐replacement cycles. Artificial intelligence (AI) adoption shortens reading times, lifts detection sensitivity, and creates a compelling return on investment that encourages faster system turnover. Meanwhile, the lower screening age of 40 years expands the eligible female population by nearly 20 million, requiring additional imaging capacity and mobile outreach services. Heightened reimbursement for 3-D tomosynthesis narrows cost gaps and accelerates the migration from 2-D systems, while density notification laws in 38 states prompt providers to adopt premium modalities capable of imaging fibroglandular tissue. Consolidation among imaging centers and vertical acquisition of AI developers further scales deployment of advanced platforms and unifies data for algorithm training.
Key Report Takeaways
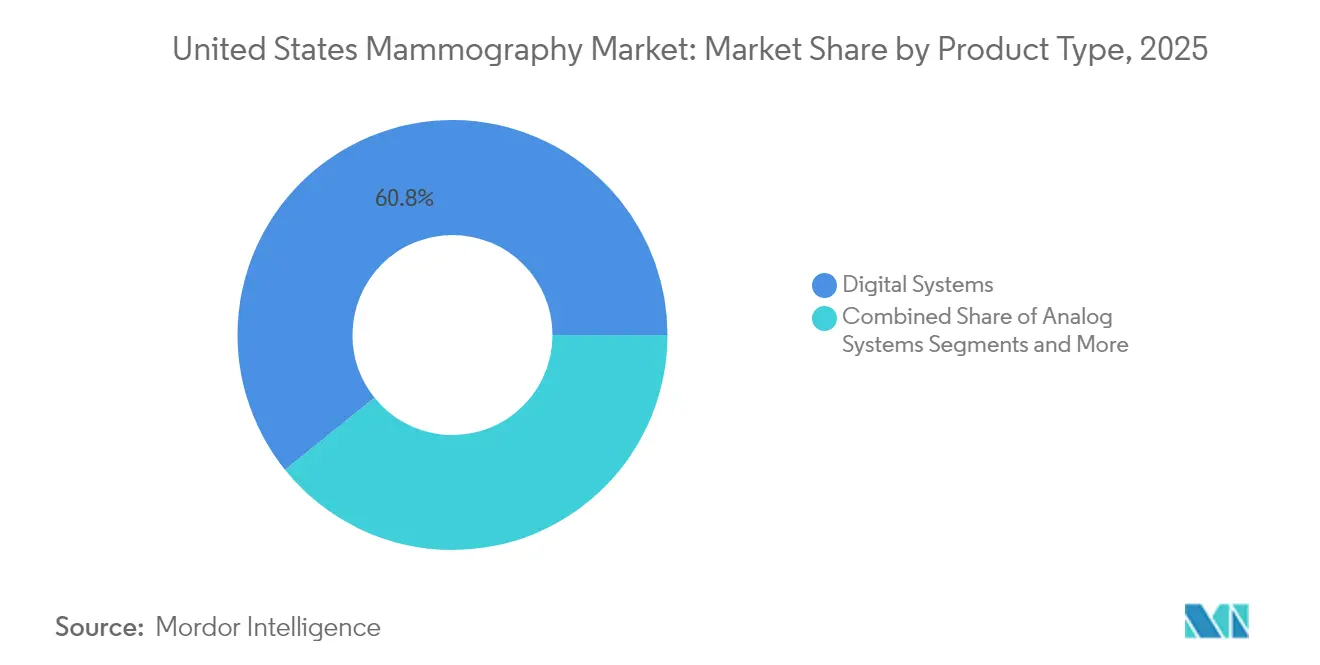
- By product type, digital systems accounted for 60.78% of the United States' mammography market share in 2025.
- 3-D breast tomosynthesis systems are forecast to expand at a 9.88% CAGR through 2031.
- By technology, 2-D full-field digital mammography accounted for 50.40% of the market size in 2025, while photon-counting digital mammography is projected to grow at a 10.02% CAGR through 2031.
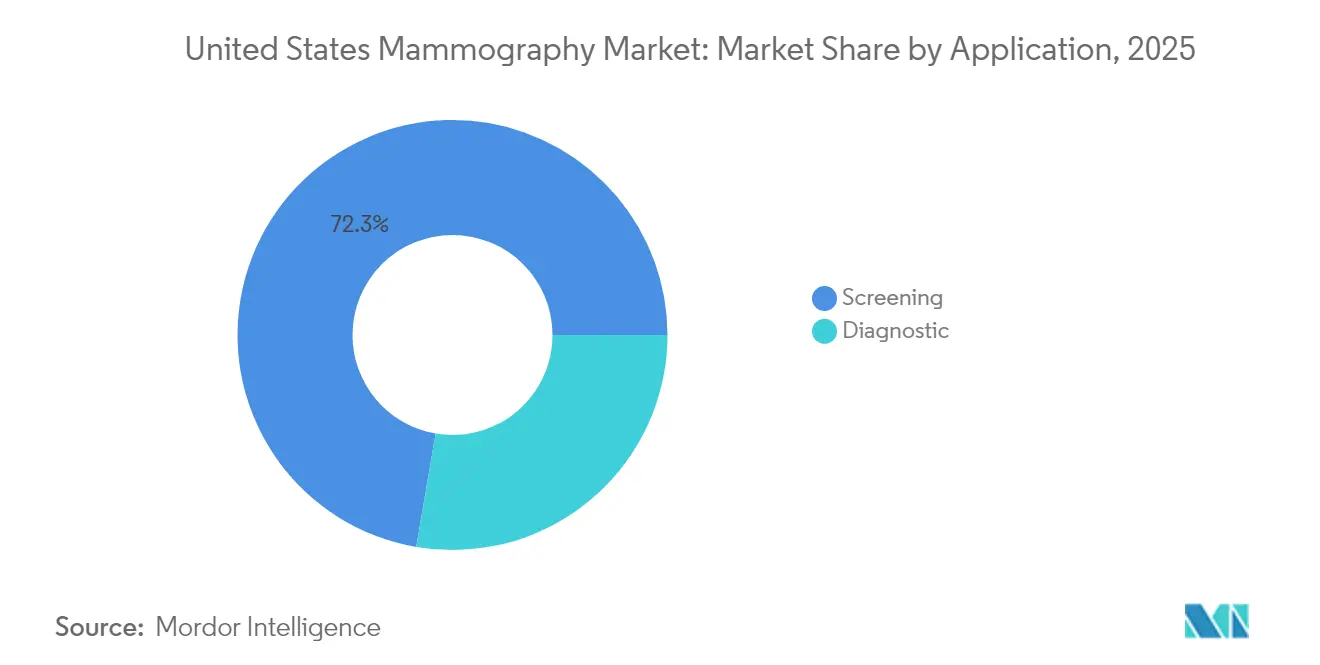
- By application, screening captured 72.30% of 2025 revenue, whereas interventional stereo-biopsy is advancing at a 10.05% CAGR through 2031.
- By end user, hospitals accounted for 44.10% of the revenue in 2025; however, diagnostic imaging centers are projected to grow at a 9.55% CAGR to 2031.
Note: Market size and forecast figures in this report are generated using Mordor Intelligence’s proprietary estimation framework, updated with the latest available data and insights as of 2026.
United States Mammography Market Trends and Insights
Drivers Impact Analysis*
| Driver | (~) % Impact on CAGR Forecast | Geographic Relevance | Impact Timeline |
|---|---|---|---|
| Growing Burden Of Breast Cancer | +1.5% | National, with higher impact in densely populated states | Medium term (2-4 years) |
| Federal Reimbursement For 3-D Tomosynthesis | +1.8% | National, accelerated in Medicare-heavy regions | Short term (≤ 2 years) |
| Rapid Technology Upgrades | +1.2% | National, concentrated in urban imaging centers | Medium term (2-4 years) |
| Expansion Of Breast Density-Notification Laws | +0.9% | State-specific, with 38 states currently mandating | Short term (≤ 2 years) |
| AI-Enabled Triage & Workflow Automation | +1.4% | National, prioritized by large imaging chains | Medium term (2-4 years) |
| Rise Of Mobile Outreach Vans In Rural U.S. | +0.8% | Rural and underserved urban areas | Long term (≥ 4 years) |
| Source: Mordor Intelligence | |||
Growing Burden of Breast Cancer
The incidence among women aged 40-49 years increased by 2% annually from 2015 to 2019, prompting the USPSTF to lower the screening age to 40 years[1]. The decision instantly widened the United States mammography market by roughly 20 million newly eligible women and increased demand on facilities already contending with radiologist shortages. Mortality among Black women remains 40% higher than that of White women, spurring inner-city programs to adopt contrast-enhanced mammography that delivers 88.9% sensitivity versus 27.8% for standard 2-D imaging. Workforce gaps estimated at 1,400 unfilled fellowship positions intensify reliance on AI decision support to maintain throughput. Dense breast tissue in up to half of women over 40 strengthens the case for tomosynthesis and photon-counting systems that reveal occult lesions. Together, these epidemiological pressures elevate capital expenditure and reinforce the long-run momentum of the United States mammography market.
Federal Reimbursement for 3-D Tomosynthesis
The Centers for Medicare & Medicaid Services (CMS) instituted national coverage for digital breast tomosynthesis, eliminating the historical USD 50–80 out-of-pocket differential that had suppressed uptake [2]. Commercial insurers quickly mirrored CMS, and today, 95% of privately insured members can access 3-D exams without prior authorization. Parity coincides with compelling clinical proof: DBT lowers callback rates by 41% and improves cancer detection by 29%. Revenue visibility accelerates the replacement of legacy 2-D units, shortening equipment lifecycles from 9 years to nearer 6 years. Providers serving Medicare-dominant catchments in Florida, Arizona, and Pennsylvania are upgrading first, creating a ripple effect that extends to second-tier markets, which are seeking competitive parity.
Rapid Technology Upgrades
FDA clearance of Clairity Breast in June 2025 introduced risk-prediction software that stratifies five-year cancer probability from a single mammogram. Photon-counting detectors promise 100-fold resolution improvement and 30–40% lower dose compared with current digital systems. The SCEMAM trial confirmed that contrast-enhanced mammography detects 10 additional cancers per 1,000 women versus 2-D imaging. Equipment makers bundle these innovations with AI-guided positioning and automated quality checks, shrinking exam time and freeing capacity. Siemens’ MAMMOMAT B.brilliant achieves 5-second 3-D capture, erasing motion artifacts. Collective gains motivate faster fleet turnover, and incremental spending is a key pillar of the United States mammography market expansion.
Expansion of Breast Density-Notification Laws
Mandated density disclosure in 38 states increases administrative workload and legal exposure for facilities that fail to advise women of supplemental options. Final FDA rules, effective September 2024, standardize language nationwide, permitting multi-state health systems to craft uniform protocols. Dense tissue prevalence of 40–50% among screened women channels demand toward tomosynthesis, automated breast ultrasound, and contrast-enhanced mammography. Hospitals upgrade to avoid malpractice liability that has averaged USD 1 million per missed dense-tissue cancer. Vendors highlight dose-reduced 3-D acquisitions, reassuring clinicians who balance image quality with safety.
Restraints Impact Analysis*
| Restraint | (~) % Impact on CAGR Forecast | Geographic Relevance | Impact Timeline |
|---|---|---|---|
| Radiation-Dose Safety Concerns | -1.1% | National, heightened in pediatric-adjacent facilities | Medium term (2-4 years) |
| High Capital & Service Costs Of DBT Units | -0.7% | Rural and independent imaging centers | Short term (≤ 2 years) |
| Shortage Of Fellowship-Trained Breast Radiologists | -1.3% | National, acute in rural and secondary markets | Long term (≥ 4 years) |
| Consolidation Of Imaging Centers Delaying Purchases | -0.9% | Metropolitan areas with high PE activity | Medium term (2-4 years) |
| Source: Mordor Intelligence | |||
Radiation-Dose Safety Concerns
DBT exposes patients to 15–25% higher dose than 2-D exams, with a mean glandular dose at 2.04–2.33 mGy versus 1.40–1.89 mGy for FFDM. Patient advocates amplify concerns about cumulative exposure, especially for the newly included 40-year-old cohort, who face decades of annual screening. FDA MQSA inspectors flag dose violations more frequently as facilities increase exam volumes. Manufacturers counter with AI-enhanced reconstruction and photon-counting detectors that deliver sub-2 mGy performance, yet lingering perceptions hinder rapid adoption in children’s hospitals and family clinics. Dose anxiety marginally tempers the United States mammography market, although technology improvements are steadily narrowing the gap.
High Capital & Service Costs of DBT Units
Tomosynthesis platforms range from USD 200,000 to USD 275,000, nearly double the cost of an entry-level digital system. Annual service contracts reach USD 41,500, straining cash flows for rural hospitals that process fewer than 1,200 screens per year. Financing obstacles lead some independents to defer purchases until consolidation resolves, fueling reliance on vendor leasing schemes or mobile vans. Non-profit outreach fleets now bridge the rural gap, but the economic hurdle still slows full penetration of 3-D systems, moderating near-term acceleration of the United States mammography market.
*Our forecasts treat driver/restraint impacts as directional, not additive. The impact forecasts reflect baseline growth, mix effects, and variable interactions.
Segment Analysis
By Product Type: Digital Systems Lead Market Evolution
Digital equipment captured 60.78% of the market in 2025, mirroring the near-complete exit of film units. Yet replacement momentum is shifting toward 3-D tomosynthesis, projected to advance at 9.88% CAGR through 2031 as payers equalize reimbursement and clinical evidence grows. Analog systems primarily remain in isolated clinics; retrofit kits prolong function but steadily lose relevance as regulatory pressure intensifies. Premium contrast-enhanced platforms, validated by SCEMAM, open a differentiated lane for tertiary centers seeking diagnostic superiority. Overall, rising preference for volumetric and contrast imaging is driving growth in the United States mammography market.
The value proposition of digital upgrades combines image clarity, workflow automation, and AI analytics, which reduce reading time by 30–40%. Providers view premium packages as not simple replacements, but rather as competitive assets that attract referrals and justify higher technical fees. As mobile fleets modernize their onboard suites, digital manufacturers enlarge after-market revenues for software licenses and detector swaps, further deepening the United States mammography market.

By Technology: AI Integration Transforms 2-D Digital Dominance
Full-field digital retains 50.40% share, but photon-counting detectors headline innovation because they pair ultra-high resolution with reduced exposure. Early adopters report sharper microcalcification visualization, translating to fewer false negatives and lower recall rates. AI-guided CAD and triage tools, such as ProFound Detection 4.0, reduce reading time and improve specificity, accelerating AI adoption across the United States mammography market.
3-D tomosynthesis gains reimbursement traction, while Clairity Breast's predictive capability signals a future shift from detection to risk-stratified screening. Vendors embed smart-worklist features that auto-route complex cases to fellowship specialists, easing the radiologist shortage. Integration of cloud deployment secures scalability for multisite chains, underscoring how software differentiation now defines competitive positioning in the United States mammography market.
By Application: Screening Dominance Faces Interventional Growth
Screening accounted for 72.30% of the volume in 2025, as demographic expansion and guideline revisions funnelled millions more women into annual exams. Yet, interventional stereobiopsy, driven by increased detection rates and precision guidance, is growing at a 10.05% CAGR. Hospitals integrate same-day biopsy with screening to limit patient drop-off, expanding per-visit revenue and raising the overall United States mammography market size, attributed to value-added procedures.
AI-driven lesion characterization reduces unnecessary biopsies, creating goodwill among patients and insurers while improving capacity utilization. Mobile vans are increasingly delivering both screening and ultrasound triage on board, thereby augmenting access in rural counties. This service model anchors incremental demand and diversifies revenue streams, illustrating how the evolving care pathway reinforces resilience in the United States mammography market.
By End User: Hospital Dominance Challenged by Imaging Center Consolidation
Hospitals generated 44.10% of their revenue in 2025 due to the implementation of integrated oncology pathways and budget latitude. Nonetheless, private-equity-backed diagnostic imaging centers expand at a 9.55% CAGR, leveraging centralized AI hubs to pool sub-specialist reads and capture spillover from overloaded hospital systems. Their cost-effective footprint resonates with patients who prefer shorter wait times, thereby strengthening their role within the industry.
Ambulatory surgical centers (ASCs) are further disrupted by bundling screening, biopsy, and outpatient lumpectomy under one roof, shortening care cycles. Rural regions rely on mobile suites operated by academic health systems, such as UC Davis, to improve equity while increasing throughput in the broader United States mammography market. Collectively, shifting site-of-service trends reshape vendor sales channels and service revenue distribution.
Geography Analysis
Regional dynamics illustrate how demographic density, policy adoption, and provider consolidation guide equipment allocation. Coastal states, including California, New York, and Texas, exhibit the deepest capital pools, installing photon-counting and contrast-enhanced systems ahead of reimbursement codes. Higher average reimbursements in these states drive market growth.
The density-notification rollout produces uneven supplemental-screening demand; states with early mandates, such as Connecticut and New York, exhibit higher 3-D adoption, whereas late-adopter states continue to transition. Private equity concentration clusters in metropolitan corridors, accelerates technology refresh, and drives the market share of chain operators. Future growth hinges on harmonizing policy with capacity expansion, enabling underserved zones to rise toward parity.
Regulatory Landscape
The United States mammography market operates under the FDA-administered Mammography Quality Standards Act (MQSA), codified in 21 CFR Part 900 (updated as of 2026-04-30). MQSA links facility certification to accreditation and annual inspections that review equipment performance, image quality, and the qualifications of physicians, technologists, and medical physicists. These requirements influence provider purchasing decisions and service-contract terms, particularly around compliance and quality assurance.
A key recent compliance inflection point is the MQSA Final Rule (published in 2023) that took effect on September 10, 2024. It requires standardized breast density notification for patients nationwide. Operational requirements such as timely release and transfer of digital mammograms (within 15 calendar days of a request) also shape PACS connectivity, workflow software selection, and multi-site protocol standardization for imaging chains operating across state lines.
Competitive Landscape
Key equipment makers, such as Hologic, GE HealthCare, and Siemens Healthineers, anchor the hardware supply; however, differentiation is increasingly driven by AI software ecosystems. Hologic’s Genius AI Detection integrates seamlessly into its 3D workflow, offering a 40% reduction in reading time that solidifies upgrade intent. GE HealthCare collaborates with RadNet to co-develop SmartTechnology algorithms embedded across 400 centers[3]. Siemens advances detector innovation with its 5-second 3D Mammomat B.brilliant, emphasizing dose efficiency.
Vertical integration intensifies as service chains acquire software vendors; RadNet’s USD 103 million purchase of iCAD merges 17% of the United States radiology practices under a shared AI umbrella, consolidating data and negotiating leverage. AI pure-plays, such as Volpara and ScreenPoint, align with imaging groups to integrate risk models into daily operations. This software-hardware fusion drives recurring license revenue and raises switching costs, embedding AI dynamics firmly in the United States mammography market.
United States Mammography Industry Leaders
-
Siemens AG
-
GE Healthcare
-
Koninklijke Philips N.V.
-
Fujifilm Holdings Corporation
-
Hologic, Inc.
- *Disclaimer: Major Players sorted in no particular order
Market Opportunities and Future Outlook
The MQSA density-notification requirement (effective September 2024) has pushed screening programs toward modalities and workflows that better address dense breast tissue pathways. It also creates whitespace for contrast-enhanced mammography (CEM), CEM-guided biopsy, and supplemental imaging triage integrated into routine operations. Siemens Healthineers receiving FDA clearance for Mammomat B.brilliant CEM and CEM biopsy capabilities provides a concrete platform example that can help facilities keep diagnostic workups in-house. This supports hospital systems and high-volume imaging centers that are bundling screening with downstream diagnostic and interventional services.
Enterprise deployment of AI-enabled breast imaging tools continues to be a visible commercialization lane. OEMs are embedding third-party algorithms and reconstruction into installed bases rather than limiting adoption to stand-alone pilots. GE HealthCare expanded its collaboration with RadNet subsidiary DeepHealth in April 2026 to integrate AI tools such as Safeguard Review and ProFound Pro into the Senographe Pristina platform. GE HealthCare also received FDA premarket authorization in late 2025 for Pristina Recon DL, a deep learning 3D reconstruction application. Together, these moves support opportunities around standardized, multi-site workflow packages (acquisition, reconstruction, triage, and review) that help imaging chains scale throughput and consistency while managing radiologist capacity constraints.
Recent Industry Developments
- June 2026: Siemens Healthineers announced FDA clearance for contrast-enhanced mammography (CEM) and CEM biopsy capabilities for the Mammomat B.brilliant. The regulatory clearance expands high-end imaging platform capabilities and enables broader deployment of next-gen B.brilliant systems in U.S. centers with integrated biopsy workflows.
- June 2026: GE HealthCare expanded mammography collaboration with RadNet subsidiary DeepHealth to distribute new Breast Suite applications across global markets. The collaboration scales AI-enabled breast imaging workflows and accelerates AI-driven mammography adoption across multiple centers and markets.
- April 2026: Lunit FDA clearance for next-generation 3D mammography AI Version 1.2. The new AI model capabilities for 3D readings strengthen AI-assisted detection offerings in the U.S. market and expand deployment.
Research Methodology Framework and Report Scope
Market Definition and Coverage
The market is defined as revenues generated from mammography imaging used for breast cancer screening and diagnostic workups in the United States, covering system sales and the related upgrades that enable imaging output in clinical settings.
Scope exclusions: It excludes broader breast imaging modalities not based on mammography, along with general oncology testing that is not tied to mammography procedures.
Segmentation Overview
- By Product Type
- Digital Systems
- 3-D Breast Tomosynthesis Systems
- Analog Systems
- Computed-Radiography Retrofit Kits
- Contrast-Enhanced Mammography Systems
- By Technology
- 2-D Full-field Digital
- 3-D / Tomosynthesis
- Photon-Counting Digital
- AI-enabled CAD & Image-triage
- By Application
- Screening
- Diagnostic
- By End User
- Hospitals
- Diagnostic Imaging Centers
- Ambulatory Surgical Centers
- Others
Data Sources, Market Sizing, and Validation
Desk Research
Desk research was used to build the starting view of mammography demand and supply in the United States, and then to set clear boundaries on what revenue is counted. Public and official sources were mainly used to anchor the screening eligible pool, the breast cancer burden, and the reimbursement and quality rules that influence adoption.
We referenced sources such as CDC screening statistics and cancer surveillance summaries, NCI and SEER program publications on breast cancer incidence, FDA pages related to mammography device oversight and quality requirements, and CMS fee schedules that affect provider economics for 2D and 3D exams. We also reviewed guideline and clinical practice materials from organizations such as the American Cancer Society, along with peer-reviewed journal articles that discuss screening utilization and modality performance. Company filings, investor presentations, and reputable press coverage were used to map product refresh cycles and provider purchasing behavior, and then paid subscriptions for company financials, news, and patent databases were used to cross-check directionally. The desk sources mentioned are illustrative only, and many other references were also used for data collection, validation, and research clarification.
Primary Interviews and Surveys
Primary work was used to validate assumptions that are not fully visible in public datasets, including typical system replacement timing, the mix of 2D versus 3D utilization, and how imaging sites plan capex when screening guidance changes. We engaged a mix of provider-side, clinical, and equipment-side experts across the United States so inputs on pricing, procedure throughput, and adoption timelines could be aligned before totals were finalized.
Distribution of primary research fieldwork respondents
| Company type | Respondent position |
|---|---|
| Top tier: 28% | CXOs: 15% |
| Mid tier: 57% | Functional/Unit leaders: 26% |
| Smaller Players: 15% | Managers: 59% |
Market-Sizing & Forecasting
Sizing was built using top-down and bottom-up logic, where national screening and diagnostic activity signals were first translated into imaging capacity needs and then converted into revenue using pricing and replacement assumptions. On the top-down side, procedure volume trends and the screening eligible population were used to reconstruct the demand pool, which was then adjusted for care setting mix and the ongoing shift from 2D to 3D.
To keep the model reproducible, we relied on a short list of market fingerprints as core inputs, including screening guidance and participation rates by age, 3D tomosynthesis penetration, average utilization per installed system, replacement cycles for older platforms, and realistic pricing spreads between 2D and 3D capable configurations. Forecasting used scenario analysis, where adoption speed, reimbursement sensitivity, and replacement cadence were flexed within ranges supported by expert feedback and observed policy direction. Results were corroborated with selective bottom-up approximations, such as sampled ASP times unit volumes and channel checks, and when smaller-site visibility was limited, proxy ranges based on similar site profiles were applied and then normalized back to national totals.
Data Validation & Update Cycle
Model outputs were validated through triangulation across independent indicators, followed by anomaly checks against expected relationships between procedure volumes, installed base behavior, and upgrade timing. If any split by setting or year created an unusual jump, the driver was rechecked and respondents were re-contacted when a clarification was needed.
Before sign-off, the work goes through multi-step analyst review so formulas, units, and currency treatment are consistent across the series. Reports are refreshed annually, with interim updates for material events such as guideline updates, reimbursement shifts, or major regulatory changes. Right before delivery, an analyst completes a fresh pass so clients receive the latest updated view available at that time.
Mordor Intelligence's United States Mammography Market Estimate Compared With Other Published Estimates
Published market values for US mammography do not always line up because authors often include different revenue layers and they do not always align on the same base year. In this space, the biggest gaps usually come from whether the number is equipment-focused or whether it blends in a wider set of breast screening and diagnostic services.
By checking 3D tomosynthesis penetration against reimbursement signals, refreshing installed base replacement timing, and tying volumes to screening participation, Mordor Intelligence keeps the total centered on mammography-specific demand and price progression rather than bundled breast diagnostics.
Benchmark comparison
| Source | Market Size | Gaps in Research Methodology |
|---|---|---|
| Mordor Intelligence | USD 1.15 B (2025) | |
| Trade Journal A | USD 0.79 B (2024) | The scope is not clearly stated and the base year is earlier, which can understate value if the 2D to 3D upgrade mix and ASPs are not refreshed in the same cycle. It also reads closer to an equipment-only view without transparent utilization and replacement checks. |
| Industry Bulletin B | USD 1.55 B (2024) | The label is broader (screening and diagnostic), which can blend mammography with adjacent breast diagnostics and biopsy-related revenue. If the mammography procedure pool is not separated cleanly, totals can appear higher for the same year. |
The spread across values is mainly explained by scope boundaries and base-year alignment, rather than small math differences. When the market is rebuilt from procedure demand signals, installed base behavior, and realistic pricing, the result is easier to audit and repeat year over year.
Key Questions Answered in the Report
How big is the United States Mammography Market?
The United States Mammography Market size is expected to reach USD 1.26 billion in 2026 and grow at a CAGR of 9.28% to reach USD 1.96 billion by 2031.
Which imaging modality is expanding fastest in the United States?
3-D breast tomosynthesis systems lead growth with a projected 9.88% CAGR through 2031, helped by full Medicare reimbursement and stronger clinical outcomes.
Who are the key players in United States Mammography Market?
Siemens AG, GE Healthcare, Koninklijke Philips N.V., Fujifilm Holdings Corporation and Hologic, Inc. are the major companies operating in the United States Mammography Market.
How did the new USPSTF guidance affect screening demand?
Lowering the start age to 40 years added almost 20 million eligible women, boosting annual screening volume and accelerating equipment upgrades.