
Market Overview
| Study Period | 2020 - 2031 |
|---|---|
| Forecast Data Period | 2026 - 2031 |
| Base Year Market Size (2025) | USD 93.17 Billion |
| Market Size (2026) | USD 94.72 Billion |
| Market Size (2031) | USD 102.86 Billion |
| Growth Rate (2026 - 2031) | 1.66 % |
| Market Concentration | Low |
Major Players-Market-comapny-logo.webp) *Disclaimer: Major Players sorted in no particular order Image © Mordor Intelligence. Reuse requires attribution under CC BY 4.0. | |
United States Maintenance, Repair, And Operations (MRO) Market Analysis by Mordor Intelligence
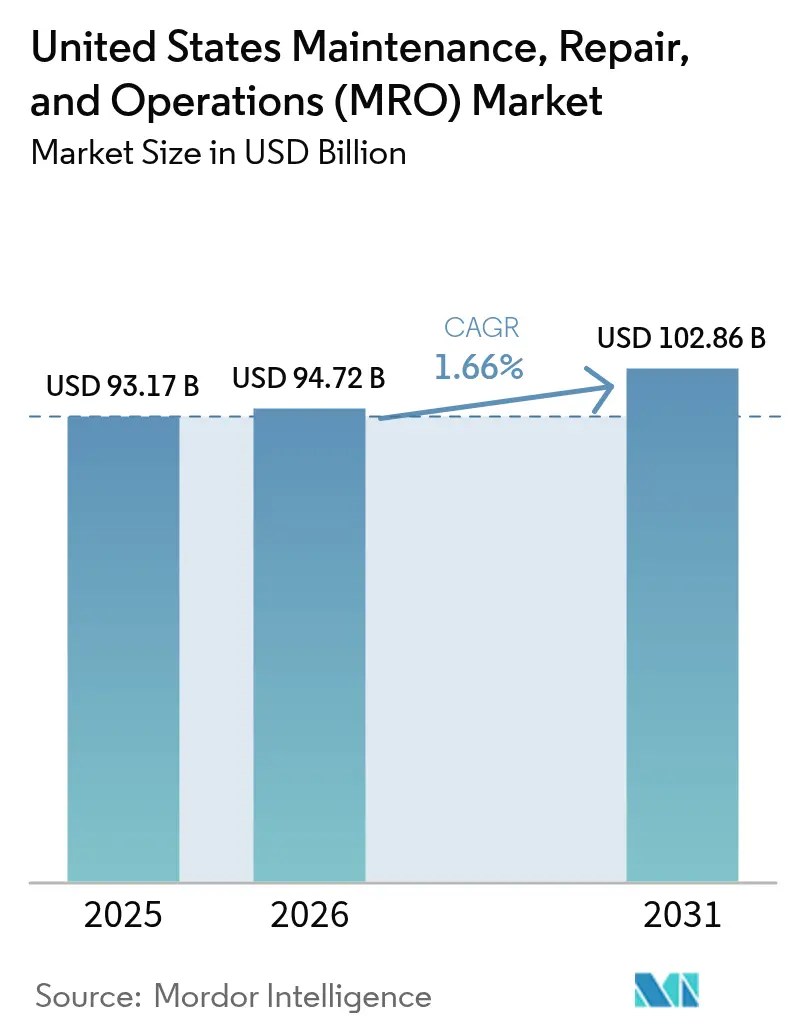
The United States Maintenance, Repair, And Operations Market size was valued at USD 93.17 billion in 2025 and estimated to grow from USD 94.72 billion in 2026 to reach USD 102.86 billion by 2031, at a CAGR of 1.66% during the forecast period (2026-2031). This outlook reflects the market’s maturity, limited by structural labor shortages yet supported by federal infrastructure spending and rapid digitalization of procurement. Moderate growth is anchored by an expanding installed base of industrial assets, rising demand for energy-efficient retrofits, and wider use of predictive maintenance software. Policy incentives from the Infrastructure Investment and Jobs Act, the CHIPS and Science Act, and the Inflation Reduction Act continue to stimulate capital investment in semiconductor fabs, battery plants, and clean-energy projects, all of which rely on high-value MRO services. At the same time, e-commerce penetration accelerates as buyers migrate to integrated online platforms that streamline sourcing, reduce transaction volume, and improve inventory visibility. Despite these opportunities, the market contends with acute skilled-labor shortages, shrinking distributor gross margins, and ongoing supply-chain volatility that inflates carrying costs and lengthens lead times. Consolidation among rental and distribution companies remains a primary competitive response, with more than USD 15 billion in recent acquisitions aimed at scale efficiencies and expanded geographic coverage.
Key Report Takeaways
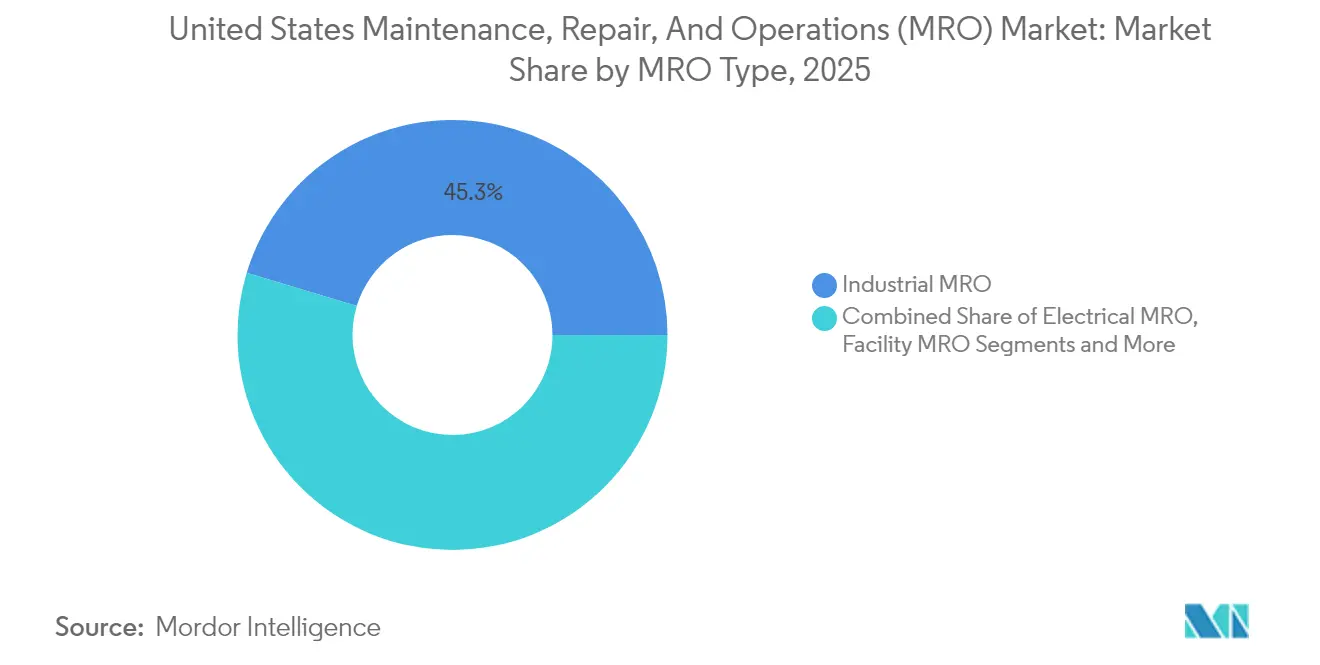
- By MRO type, industrial MRO led with 45.32% revenue share of the United States maintenance, repair, and operations market share in 2025, while electrical MRO recorded the highest projected CAGR at 2.75% through 2031.
- By end-user industry, manufacturing accounted for 37.62% share of the United States maintenance, repair, and operations market size in 2025, and healthcare is expanding at a 2.56% CAGR through 2031.
- By sourcing model, in-house maintenance held 51.36% share of the United States maintenance, repair, and operations market size in 2025; integrated supply is set to grow at a 1.78% CAGR over 2026-2031.
- By maintenance approach, preventive maintenance represented 57.48% share of the United States maintenance, repair, and operations market size in 2025, whereas predictive maintenance is forecast to rise at a 2.06% CAGR to 2031.
- By distribution channel, offline distributors maintained 63.25% share of the United States maintenance, repair, and operations market size in 2025, and online/e-commerce channels are advancing at a 1.88% CAGR over the forecast horizon.
Note: Market size and forecast figures in this report are generated using Mordor Intelligence’s proprietary estimation framework, updated with the latest available data and insights as of 2026.
Market Trends and Insights
Drivers Impact Analysis of United States Maintenance, Repair, And Operations (MRO) Market*
| Driver | (~) % Impact on CAGR Forecast | Geographic Relevance | Impact Timeline |
|---|---|---|---|
| Predictive maintenance driven cost savings | +0.4% | National, concentrated in manufacturing hubs | Medium term (2-4 years) |
| Aging industrial assets increasing repair cycles | +0.3% | National, emphasis on Rust Belt and Gulf Coast | Long term (≥ 4 years) |
| E-commerce penetration of MRO supplies | +0.2% | National, accelerated in urban centers | Short term (≤ 2 years) |
| Reshoring investments expanding installed base | +0.3% | Southeast, Southwest, and Great Lakes regions | Long term (≥ 4 years) |
| Federal incentives for energy-efficient retrofits | +0.2% | National, prioritizing industrial corridors | Medium term (2-4 years) |
| Additive manufacturing for on-demand spares | +0.1% | Aerospace clusters and advanced manufacturing zones | Long term (≥ 4 years) |
| Source: Mordor Intelligence | |||
Predictive Maintenance Driven Cost Savings
Organizations adopting predictive programs report eliminating more than 50% of unplanned downtime and cutting defects by over 70%, shifting MRO from a cost center to a value generator. Aviation operators increasingly embed condition-based monitoring in fleet management contracts, and industrial facilities pair IoT sensors with analytics platforms to secure service-level guarantees. Vendors capable of delivering data-backed uptime commitments command premium rates, while buyers benefit from lower lifecycle costs and higher equipment availability. The growing roster of government-funded Industrial Assessment Centers further diffuses predictive know-how across mid-sized manufacturers. [1] As predictive solutions scale, software fees and sensor retrofits become recurring revenue streams for service providers, reinforcing the positive CAGR contribution.
Aging Industrial Assets Increasing Repair Cycles
A large share of U.S. industrial machinery installed during the 1950s–1960s is now operating beyond its design life, driving more frequent maintenance events and higher spend per asset. Chemical and petrochemical facilities in the Gulf Coast face heightened regulatory scrutiny, prompting mandated overhauls of pressure vessels and piping systems. Public transit agencies report a USD 50-80 billion backlog for railcar, track, and facility rehabilitation . In aviation, the average certified mechanic age of 54 years underscores the urgency of asset-integrity management programs that minimize safety risks while extending service life. These dynamics collectively increase demand for inspection services, condition assessments, and refurbishment parts, supporting steady revenue growth for the United States MRO market.
E-commerce Penetration of MRO Supplies
Digital procurement platforms now list millions of SKUs, enabling buyers to compare specifications, price, and availability in real time. The shift online compresses purchasing cycles and facilitates vendor-managed inventory that lowers on-hand stock levels by up to 20%. Large distributors report that contractual e-commerce transactions comprise more than 70% of total MRO revenue, indicating a permanent change in buyer behavior. Widespread use of AI chatbots and guided search tools simplifies product selection, particularly for small and medium enterprises that previously lacked dedicated procurement teams. As penetration deepens, digital channels capture incremental share from local branches, adding modest tailwinds to market growth while intensifying price transparency.
Reshoring Investments Expanding Installed Base
Annual outlays for manufacturing construction have doubled to nearly USD 190 billion, fueled by reshoring incentives targeting semiconductors, electric vehicles, and renewable energy equipment. More than 50 chip-fabrication projects and 200 clean-energy facilities are underway or announced, predominantly in the Southeast, Southwest, and Great Lakes regions. Each new plant introduces thousands of assets, HVAC, automation, tooling, requiring ongoing MRO. Spending commitments by firms such as GE Aerospace, which earmarked almost USD 1 billion for U.S. site upgrades in 2025, illustrate how capital projects translate into long-tail service demand. The enlarged installed base bolsters the United States maintenance, repair, and operations market by widening its serviceable universe.
Restraints Impact Analysis of United States Maintenance, Repair, And Operations (MRO) Market*
| Restraint | (~) % Impact on CAGR Forecast | Geographic Relevance | Impact Timeline |
|---|---|---|---|
| Margin pressure from product commoditization | -0.2% | National, acute in competitive metropolitan markets | Short term (≤ 2 years) |
| Supply-chain volatility and inventory shortages | -0.3% | National, concentrated in import-dependent regions | Medium term (2-4 years) |
| Skilled MRO labor shortage | -0.4% | National, severe in aerospace and manufacturing hubs | Long term (≥ 4 years) |
| Cyber-security risks in connected equipment | -0.1% | National, critical in infrastructure and defense sectors | Medium term (2-4 years) |
| Source: Mordor Intelligence | |||
Margin Pressure from Product Commoditization
Price transparency on digital platforms reduces distributor mark-ups across standard fasteners, bearings, and consumables. During 2024, leading distributors reported sequential gross-margin declines as customers migrated to lowest-cost suppliers and expanded use of private-label alternatives. [2] With market leader Grainger holding only 7% share, no participant wields sufficient scale to set industry pricing. Distributors increasingly emphasize value-added services, such as on-site vending, kitting, and technical training, to preserve margins, yet these services entail upfront investment and longer payback periods that strain near-term profitability.
Supply-Chain Volatility and Inventory Shortages
Port congestion, geopolitical disputes, and component scarcity drive extended lead times and higher freight rates, forcing buyers to raise safety-stock levels. Import-dependent regions feel the impact most acutely, particularly for electrical components sourced from Asia. Distributors carry the financial burden of larger inventories, while OEMs confront production delays when critical parts are unavailable. Although federal incentives aim to localize manufacturing, new domestic capacity will take years to materially ease supply-chain pressure, keeping the drag on the United States maintenance, repair, and operations market in the medium term.
*Our forecasts treat driver/restraint impacts as directional, not additive. The impact forecasts reflect baseline growth, mix effects, and variable interactions.
United States Maintenance, Repair, And Operations (MRO) Market Segment Analysis
By MRO Type:
Industrial Core with Electrical MomentumIndustrial MRO generated 45.32% of 2025 revenue, underpinned by the extensive machinery base in manufacturing, mining, and process industries. The United States maintenance, repair, and operations market size for industrial applications is fueled by reshoring investments in semiconductor fabrication, automotive electrification, and aerospace assembly. High-hour utilization rates create steady replacement cycles for seals, bearings, and hydraulic components. Electrical MRO, projected to grow at 2.75% CAGR to 2031, benefits from grid-modernization grants and plant electrification mandates that boost demand for switchgear, drives, and sensors. As federal incentives accelerate energy-efficiency upgrades, service providers specializing in electrical retrofits capture incremental market share.
The facility MRO segment maintains stable demand from building-system upkeep, including HVAC, roofing, and plumbing, while the “other” category comprises specialized niches such as medical-device calibration and telecom-equipment servicing. Convergence of operational technology and IT blurs traditional boundaries, particularly as interconnected systems require technicians who can manage both mechanical and cyber-security tasks. Providers that integrate multi-disciplinary teams secure longer-term service agreements at favorable margins.

By End-User Industry:
Manufacturing Scale Meets Healthcare UpsideManufacturing commanded 37.62% of the United States maintenance, repair, and operations market share in 2025, supported by USD 57 billion in machinery upkeep and additional fault-related spending. Heavy-industry clusters in the Great Lakes and Gulf Coast create consistent demand for pump, valve, and gearbox overhauls. Yet healthcare leads in growth, advancing at 2.56% CAGR through 2031 as hospitals retrofit aging infrastructure and comply with stringent equipment-maintenance standards. Federal funding under the Infrastructure Investment and Jobs Act earmarks billions for hospital energy upgrades, further expanding the healthcare serviceable market.
Energy and utilities remain steady contributors, driven by pipeline-integrity programs and power-plant life-extension projects. Aerospace and defense demand rebounds alongside higher fleet-utilization rates, with engine-maintenance services surfacing as a high-margin niche. Construction cycles introduce volatility, but the rising prevalence of modular and off-site fabrication increases opportunities for pre-emptive maintenance planning and aftermarket parts supply.
By Sourcing Model:
From In-House Control to Integrated SupplyIn-house teams continue to manage 51.36% of maintenance expenditure as organizations prioritize direct oversight of mission-critical assets. However, the talent crunch and the need for digital tools propel integrated-supply models to a 1.78% CAGR, funneling spend to vendor-managed-inventory programs. These programs typically lower transaction counts by up to 10% and reduce carrying costs by double-digit percentages, making them attractive amid margin pressure. Outsourcing to third-party maintenance, repair, and operations specialists allows manufacturers to focus on core production while accessing scarce expertise in predictive analytics and cyber-security.
Integrated facility-management providers extend value by combining janitorial, grounds, and MRO services under unified contracts. Faster time-to-repair and reduced stockouts improve equipment availability, enhancing overall plant productivity and reinforcing the migration away from purely internal maintenance teams.

By Maintenance Approach:
Preventive Backbone, Predictive InflectionPreventive schedules account for 57.48% of market revenue, favored for regulatory compliance and ease of planning. Nevertheless, predictive strategies are taking hold, projected at 2.06% CAGR as sensor prices fall and analytics platforms mature. Plants deploying predictive protocols typically cut maintenance spend by 10-15% while raising uptime, strengthening the value proposition despite higher initial investment. Corrective/reactive work persists in cost-sensitive settings but increasingly faces scrutiny from insurers and regulators that penalize unplanned downtime and safety risks.
Scaling predictive maintenance depends on data integration across enterprise resource planning, computerized maintenance management systems, and asset-performance tools. Vendors offering seamless interoperability win contracts, positioning predictive services as a critical differentiator in the United States MRO market.
By Distribution Channel:
Offline Stronghold Meets Online SurgeOffline distributors held 63.25% share in 2025 through branch networks that provide immediate inventory and technical advice. Local stock remains vital for breakdown situations where downtime costs eclipse expedited-freight fees. Yet online and e-commerce channels are advancing at 1.88% CAGR as procurement departments digitize workflows and adopt punch-out catalogs within enterprise systems. Major distributors report double-digit growth in endless-assortment websites, signaling sustainable channel migration. Direct-from-OEM sales preserve relevance for proprietary components requiring engineering sign-off or warranty compliance.
Hybrid models emerge, combining local service centers with centralized digital marketplaces to deliver both speed and breadth. Distributors that integrate real-time inventory data, AI-enabled search, and automated order fulfillment position themselves to capture disproportionate share of the United States maintenance, repair, and operations market.

Geography Analysis
Industrial density and asset age create pronounced regional patterns in service demand. The Great Lakes and Midwest retain the largest share due to legacy automotive, steel, and chemicals plants that depend on routine overhaul of high-hour machinery. The Southeast and Southwest register the fastest growth as semiconductor fabs in Arizona and Texas and EV-battery plants in Tennessee and Georgia come online under CHIPS and Inflation Reduction Act incentives. Gulf Coast refineries and petrochemical complexes continue to anchor demand for corrosion-control and turnaround services.
California and Washington dominate aerospace MRO thanks to OEM final-assembly lines and airline hub operations, while Texas hosts a dense cluster of line-maintenance providers at Dallas-Fort Worth and Houston airports. Healthcare-related MRO distributes evenly, yet the Northeast and Midwest face elevated retrofit needs owing to older hospital buildings, increasing demand for HVAC upgrades and life-safety systems.
Regional policy also shapes opportunities: right-to-work states in the South attract greenfield factories that embed predictive maintenance from commissioning, whereas older facilities in unionized northern states prioritize refurbishment under asset-management regulations. Service providers with multi-regional footprints and mobile technician fleets are best positioned to address the varied geographic requirements of the United States MRO market.
Regulatory Landscape
The United States MRO market works within a layered compliance environment covering workplace safety, environmental handling, and sector-specific maintenance rules. OSHA requirements shape day-to-day MRO practices such as lockout/tagout, machine guarding, and hazardous communications, while hazardous-waste rules affect parts cleaning, solvents, and disposal workflows across industrial and facility maintenance operations.
Digital and connected-equipment adoption is also influenced by federal standards bodies and aviation safety frameworks. In May 2026, NIST released an initial public draft of SP 1800-41 for cyber incident response and recovery for industrial control systems in manufacturing, which increases the need for audit-ready security procedures in connected maintenance environments. In aviation, FAA guidance such as AC 120-106B anchors expectations for safety management practices, and the December 2025 SMS implementation requirement for U.S. Part 145 repair stations holding EASA approval under the U.S.-EU BASA MAG Change 10 adds documentation and process-control requirements that carry into MRO software, training, and quality systems.
Value Chain Analysis
The United States MRO value chain starts with OEMs and component manufacturers supplying repair parts, consumables, and engineered assemblies, alongside software and sensor providers that enable condition monitoring. Distributors and integrated-supply providers aggregate multi-brand catalogs, provide technical support and kitting, and increasingly connect inventory to CMMS/ERP systems to reduce transaction friction, while end users then conduct maintenance through in-house teams, third-party service partners, and specialized repair shops, particularly in aerospace/defense and process industries.
Two bottlenecks remain central: labor availability and parts lead times, which raise the role of predictive maintenance and supply-chain visibility. The parts constraint is especially acute in aviation, where chronic shortages have been reported for high-run fleets such as CFM56, Boeing 737NG, and Airbus A320ceo, leading operators to use pooling, alternative sourcing, and tighter planning for AOG events. On the services and digital layer, telecom and cloud providers are moving upstream into industrial operations, including AT&T's March 2026 launch of Connected AI for Manufacturing with MicroAI, NVIDIA, and Microsoft, showing how connectivity providers are operating as systems integrators for predictive maintenance data, edge analytics, and asset performance workflows.
Competitive Landscape
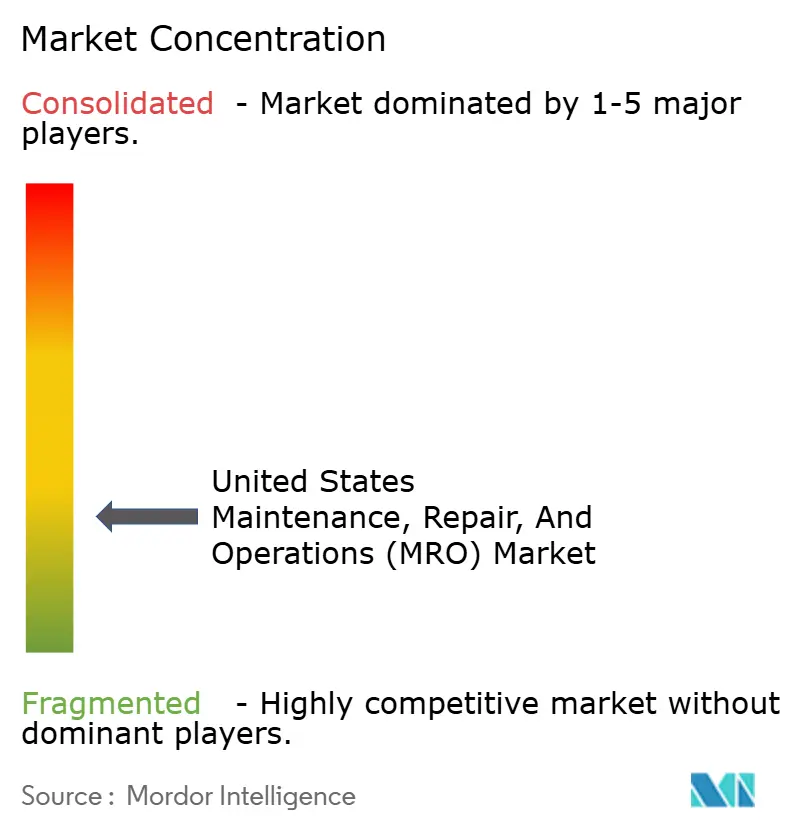
The United States maintenance repair and operations market remains fragmented. W.W. Grainger, Fastenal, MSC Industrial, Wesco, and Applied Industrial Technologies anchor the traditional distribution channel, yet each faces margin pressure from e-commerce competition and private-label encroachment. Recent M&A activity centers on fleet rental firms and specialty distributors seeking scale to negotiate supplier terms and invest in technology. For example, United Rentals’ USD 4.8 billion purchase of H and E Equipment Services added 64,000 fleet units and enhances cross-sell potential of maintenance packages to construction customers. [3]
Digital-native entrants leverage low-overhead platforms to offer broader assortments and dynamic pricing, challenging incumbents to accelerate omnichannel strategies. OEMs such as GE Aerospace increasingly bundle parts, software, and field services into performance-based contracts that bypass traditional distribution for high-end components. Compliance with OSHA’s hazardous-waste regulations and ISO 55000 asset-management standards constitutes a barrier to entry, favoring established providers with certified processes and documented safety records.
United States Maintenance, Repair, And Operations (MRO) Industry Leaders
-
Ferguson PLC
-
Motion Industries Inc. (Genuine Parts Company)
-
Airgas Inc. (Air Liquide SA)
-
DNOW Inc. (DistributionNOW)
-
HD Supply Holdings Inc.
- *Disclaimer: Major Players sorted in no particular order
United States Maintenance, Repair, And Operations (MRO) Market Companies Covered in this Report
- Ferguson PLC
- Motion Industries Inc. (Genuine Parts Company)
- Airgas Inc. (Air Liquide SA)
- DNOW Inc. (DistributionNOW)
- HD Supply Holdings Inc.
- MRC Global Inc.
- Fastenal Company
- MSC Industrial Direct Co. Inc.
- Applied Industrial Technologies
- WESCO International Inc.
- Sonepar SA
- Rexel Holdings USA (Rexel)
- Eastern Power Technologies Inc.
- Consolidated Electrical Distributors Inc.
- Elliot Electric Supply
- Border States Industrial Inc.
- Ferguson PLC
- W.W. Grainger Inc.
- Fastenal Company
- MSC Industrial Direct Co. Inc.
- Distribution Solutions Group Inc.
- The Home Depot Inc. (Interline Brands Inc.)
- Builders Firstsource
- Bluelinx Holdings
Read Analysis of United States Maintenance, Repair, And Operations (MRO) Companies
Market Opportunities and Future Outlook
A key opportunity involves scaling predictive and condition-based programs beyond pilots, particularly where labor shortages and asset aging make documentation and faster troubleshooting more valuable. The market also shows momentum around industrial-grade cybersecurity and standardized data practices for connected maintenance, supported by NIST activity in 2026, including the initial public draft of SP 1800-41 for industrial control system incident response and recovery. This creates room for MRO providers and distributors to package secure sensor retrofits, integration with CMMS/ERP, and field service execution into a single contract, rather than selling parts and labor separately.
Another opportunity comes from incremental MRO demand linked to new industrial capacity and major project buildouts financed through federal incentives already referenced in the market context (Infrastructure Investment and Jobs Act, CHIPS and Science Act, and the Inflation Reduction Act). As semiconductor, battery, and clean-energy supply chains commission new automation, electrical infrastructure, and HVAC systems, buyers are using integrated online procurement and vendor-managed inventory to control downtime and reduce inventory carrying costs. Consolidation and capability-led acquisitions also create space for specialized MRO categories, as buyers look for providers with deeper technical coverage in areas such as flow control, valves, and corrosion management.
Recent Industry Developments in United States Maintenance, Repair, And Operations (MRO) Market
- July 2026: Ferguson announced a definitive agreement to acquire FloWorks for about USD 1.6 billion, expanding its non-residential and industrial flow control footprint. The deal adds specialized capabilities across valves, automation, and related services that align with industrial MRO spend. It also strengthens Ferguson’s ability to bundle technical solutions with distribution for process-industry customers.
- April 2026: Air Liquide announced an investment of over USD 350 million to expand its industrial footprint in Louisiana, including a new air separation unit at the Koch Methanol site to supply HYUNDAI-POSCO Louisiana LLC. The project increases onshore supply of industrial gases that are used as inputs for manufacturing uptime and maintenance routines. Co-locating production with large industrial sites supports reliability and reduces logistics risk for high-consumption end users.
- October 2024: Air Liquide signed an agreement to supply oxygen to LG Chem for its electric vehicle battery plant in the United States. The supply commitment links industrial gas infrastructure to the commissioning and operation of new advanced manufacturing capacity. It also reflects how greenfield plants increase demand for installed-asset maintenance, spare parts, and contracted service coverage once production ramps.
United States Maintenance, Repair, And Operations (MRO) Market Report Scope and Research Methodology
Market Definition and Coverage
For this report, the market covers spending on maintenance, repair, and operations products used to keep facilities and production assets running across the United States, including common categories like industrial spares, electrical supplies, and facility upkeep consumables, as they flow through typical purchasing and distribution channels.
Scope exclusions: We exclude major capital equipment purchases that expand capacity (rather than maintain it), and we also exclude direct raw materials that become part of a manufactured end product.
Segments Covered in This Report
- By MRO Type
- Industrial MRO
- Electrical MRO
- Facility MRO
- Other MRO Types
- By End-User Industry
- Manufacturing
- Energy and Utilities
- Aerospace and Defense
- Construction
- Healthcare
- Other End-user Industries
- By Sourcing Model
- In-house
- Outsourced (3rd-party/IFM)
- Integrated Supply (VMI/Integrated-MRO)
- By Maintenance Approach
- Preventive / Scheduled
- Corrective / Reactive
- Predictive / Condition-based
- By Distribution Channel
- Offline Distributors
- Online / E-commerce
- Direct from OEM
Data Sources, Market Sizing, and Validation
Desk Research
Desk work started with building a clear demand map for US maintenance spending, and then aligning it to what is usually treated as MRO in purchasing and accounting. We referenced public sources such as the US Census Bureau (manufacturing and construction activity series), Bureau of Labor Statistics (employment, wages, and producer price signals), and Bureau of Economic Analysis (industry output and investment trends) to understand where maintenance intensity is rising or easing.
To ground the industrial and facility workload, we also reviewed sources such as the US Energy Information Administration for operating activity in energy, and Occupational Safety and Health Administration publications for safety-driven maintenance practices that can shift replacement cycles. Company filings, investor presentations, and reputable trade press were used to sanity check channel mix changes, distributor margin commentary, and procurement digitization trends. Where required for cross-checking, we used paid subscriptions for company financial intelligence, news and financials, patent databases, and shipment-level import and export visibility. These examples are not exhaustive, and many other public and paid sources were used to collect data, validate assumptions, and clarify open questions.
Primary Interviews and Surveys
Primary work focused on validating what buyers and sellers count as MRO in the US context, and on confirming the split between industrial, electrical, and facility buying patterns. We spoke with a mix of distributors, manufacturers, and large end users, and then re-checked critical assumptions with procurement, plant maintenance, and operations leaders across major US regions so that pricing and volume logic stayed realistic.
Distribution of primary research fieldwork respondents
Distribution of primary research fieldwork respondents
| Company type | Respondent position |
|---|---|
| Top tier: 28% | CXOs: 13% |
| Mid tier: 52% | Functional/Unit leaders: 32% |
| Smaller Players: 20% | Managers: 55% |
Market-Sizing & Forecasting
Sizing was built using top-down and bottom-up logic, starting with a top-down demand pool that reconstructs MRO needs from US industrial activity, facility operating intensity, and replacement and upkeep cycles. When the activity signals line up, the model expands, and when they soften, the model tightens, which keeps the totals tied to a repeatable set of indicators.
Key inputs used to shape the value totals included (illustrative) manufacturing output and capacity utilization direction, construction and infrastructure activity, maintenance labor availability and wage pressure, MRO product price movement (where producer price signals exist), and the mix shift toward digital procurement and centralized buying. The market value was then corroborated with selective bottom-up checks such as sampled distributor revenue exposure to MRO categories, sampled average selling price bands for fast-moving consumables versus critical spares, and channel checks on inventory turns. Where a company or channel did not disclose clean MRO breakouts, gaps were handled through conservative allocation based on product mix cues and then re-validated through interviews.
Forecasting used scenario analysis supported by expert consensus on industrial output direction, infrastructure-related maintenance pull, and price normalization trends. We kept the assumptions easy to trace back to the input variables so the forecast can be revisited when new macro or sector signals change.
Data Validation & Update Cycle
Outputs were checked in several steps so that unusual jumps did not pass through without a reason. We compared model totals against independent signals such as industrial production direction, construction activity, and visible price trends, and then reviewed variances at category and end-use levels before sign-off.
When an assumption moved the market value more than expected, analysts re-contacted sources and re-checked the desk evidence until the driver was clearly explained. Reports are refreshed annually, and interim updates are made when material events occur, such as major policy-driven capex shifts, supply disruptions, or sharp price swings. Before delivery, a final review pass is done so clients receive the latest updated view aligned to the current data cut.
Mordor Intelligence's United States Maintenance Repair and Operations MRO Market Size Compared Against Other Published Estimates
Published market sizes for US MRO can look far apart because firms often mix different demand pools and then apply different price and channel assumptions. In practice, the gap usually comes from what is counted as MRO, whether the estimate is end-user consumption or distributor sales, and how pricing is carried through the forecast years.
Electronics and commercial MRO categories sit outside Mordor Intelligence's scope, which helps explain why some broader demand studies look much larger when they combine industrial, facility, and additional product sectors into one total.
Benchmark comparison
| Source | Market Size | Gaps in Research Methodology |
|---|---|---|
| Mordor Intelligence | USD 93.17 B (2025) | |
| Trade Analytics Publisher A | USD 907.00 B (2024) | Uses an end-user demand view that spans additional product sectors beyond industrial, electrical, and facility upkeep, and it also bakes in broad category coverage that lifts the total far above a distributor-focused MRO definition. |
| Industry Research Outlet B | USD 91.52 B (2024) | Anchors on a different base year and growth window, and it can vary on what gets treated as maintenance spend versus operations supplies, which changes the value even when the geography stays the United States. |
The table indicates that the biggest spread is driven by category breadth and whether the number represents total end-user consumption or a tighter MRO spend construct. By keeping inclusions tied to observable operating activity and by cross-checking pricing and volume logic with market participants, the estimate stays traceable to clear variables and can be repeated when new data is released.
Key Questions Answered in the Report
How big is the United States Maintenance, Repair, And Operations Market?
The United States Maintenance, Repair, And Operations Market size is expected to reach USD 94.72 billion in 2026 and grow at a CAGR of 1.66% to reach USD 102.86 billion by 2031.
What is the current United States Maintenance, Repair, And Operations Market size?
In 2026, the United States Maintenance, Repair, And Operations Market size is expected to reach USD 94.72 billion.
Who are the key players in United States Maintenance, Repair, And Operations Market?
DNOW Inc. (DistributionNOW), Airgas Inc. (Air Liquide SA), Ferguson PLC, Motion Industries Inc. (Genuine Parts Company) and HD Supply Holdings Inc. are the major companies operating in the United States Maintenance, Repair, And Operations Market.
What years does this United States Maintenance, Repair, And Operations Market cover, and what was the market size in 2025?
In 2025, the United States Maintenance, Repair, And Operations Market size was estimated at USD 93.17 billion. The report covers the United States Maintenance, Repair, And Operations Market historical market size for years: 2020, 2021, 2022, 2023, 2024 and 2025. The report also forecasts the United States Maintenance, Repair, And Operations Market size for years: 2026, 2027, 2028, 2029, 2030 and 2031.