
Market Overview
| Study Period | 2020 - 2031 |
|---|---|
| Forecast Data Period | 2026 - 2031 |
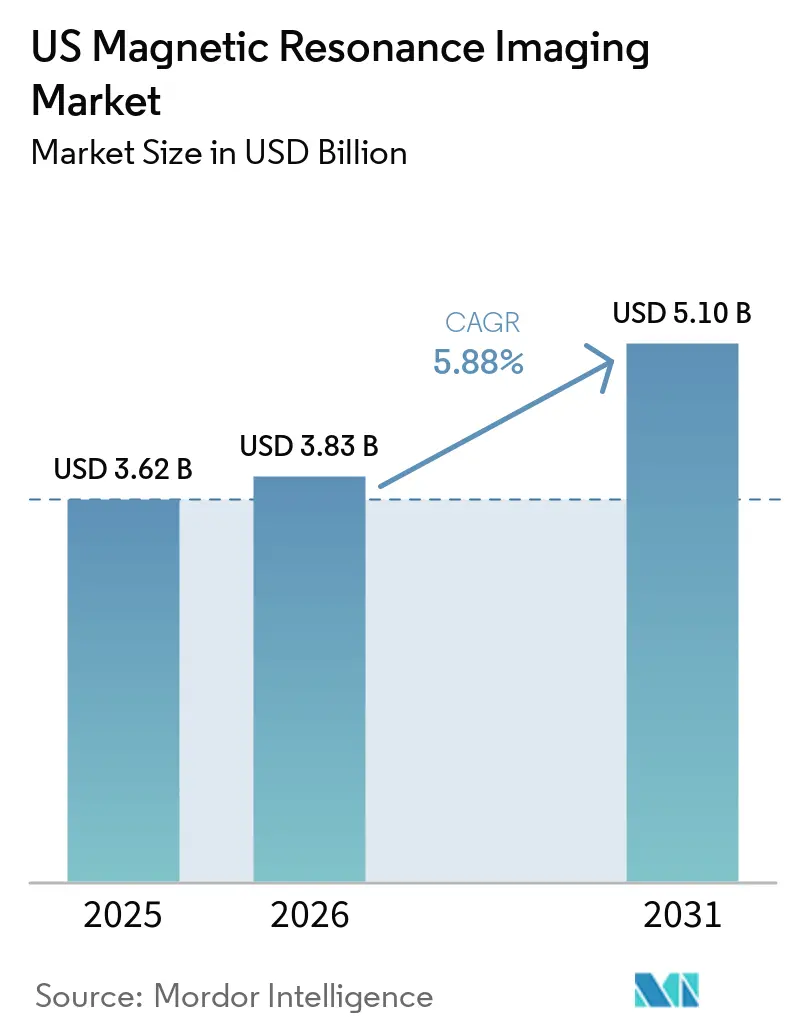
| Base Year Market Size (2025) | USD 3.62 Billion |
| Market Size (2026) | USD 3.83 Billion |
| Market Size (2031) | USD 5.10 Billion |
| Growth Rate (2026 - 2031) | 5.88 % |
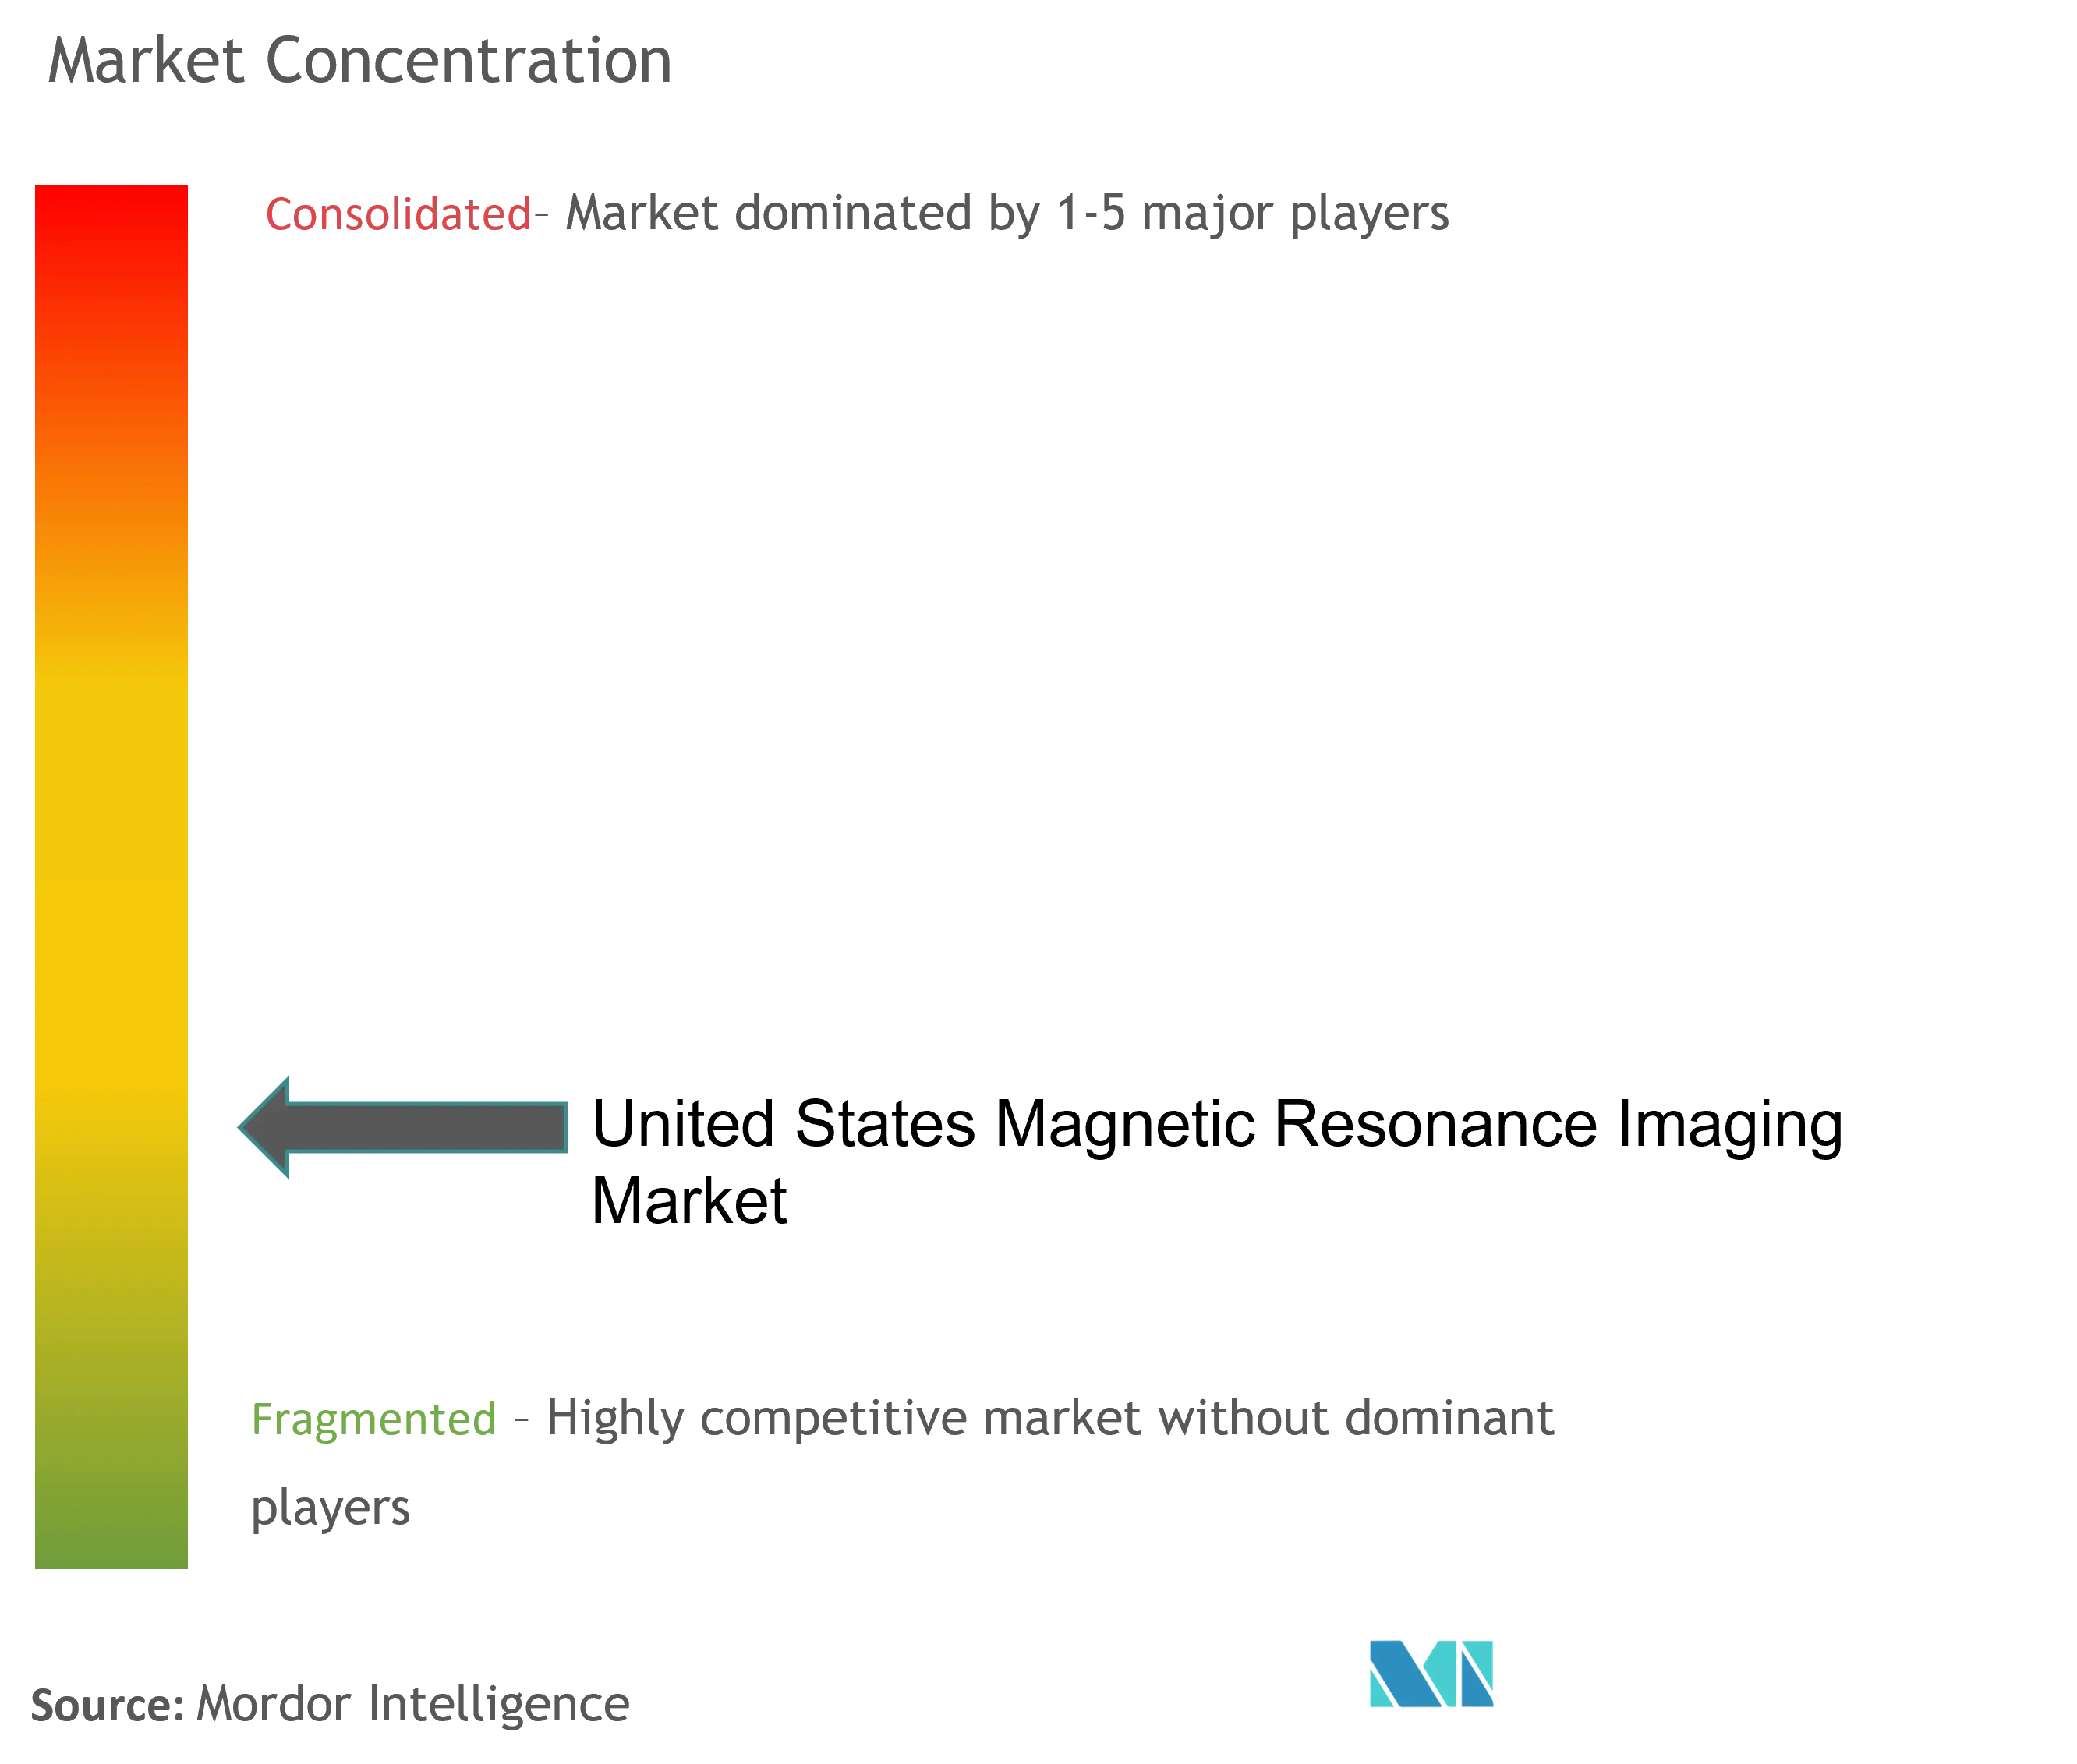
| Market Concentration | Medium |
Major Players *Disclaimer: Major Players sorted in no particular order Image © Mordor Intelligence. Reuse requires attribution under CC BY 4.0. | |
US Magnetic Resonance Imaging Market Analysis by Mordor Intelligence
US MRI market size in 2026 is estimated at USD 3.83 billion, growing from 2025 value of USD 3.62 billion with 2031 projections showing USD 5.1 billion, growing at 5.88% CAGR over 2026-2031. Demographic aging, the broad rise of chronic diseases, and continuous modernization of both hospital and outpatient imaging infrastructure collectively sustain demand. Closed‐bore systems remain the clinical workhorse, yet portable and ultra‐low‐field platforms gain ground as providers seek flexibility and lower capital outlays. Reimbursement policy gradually becomes more supportive because Medicare Advantage enrollment growth balances fee-for-service pressure. Artificial intelligence reduces scan times and improves image quality, which allows providers to boost scanner throughput without additional magnets. Competitive differentiation now centers on workflow software, helium-free magnets, and service partnerships that guarantee uptime.
Key Report Takeaways
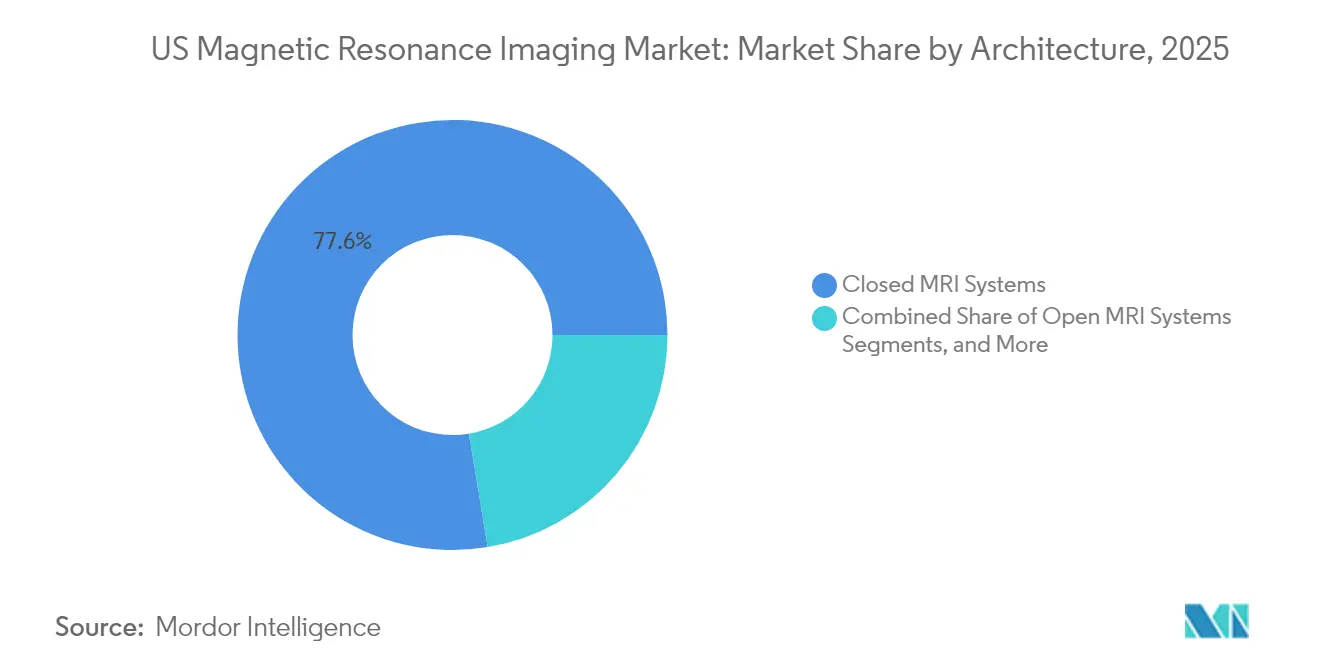
- By architecture, closed systems led with 77.62% of US MRI market share in 2025, while portable units are projected to post a 6.31% CAGR through 2031.
- By field strength, the mid-field 1.5 T category held 47.62% of the US MRI market share in 2025; ultra-high-field platforms are advancing at a 5.98% CAGR to 2031.
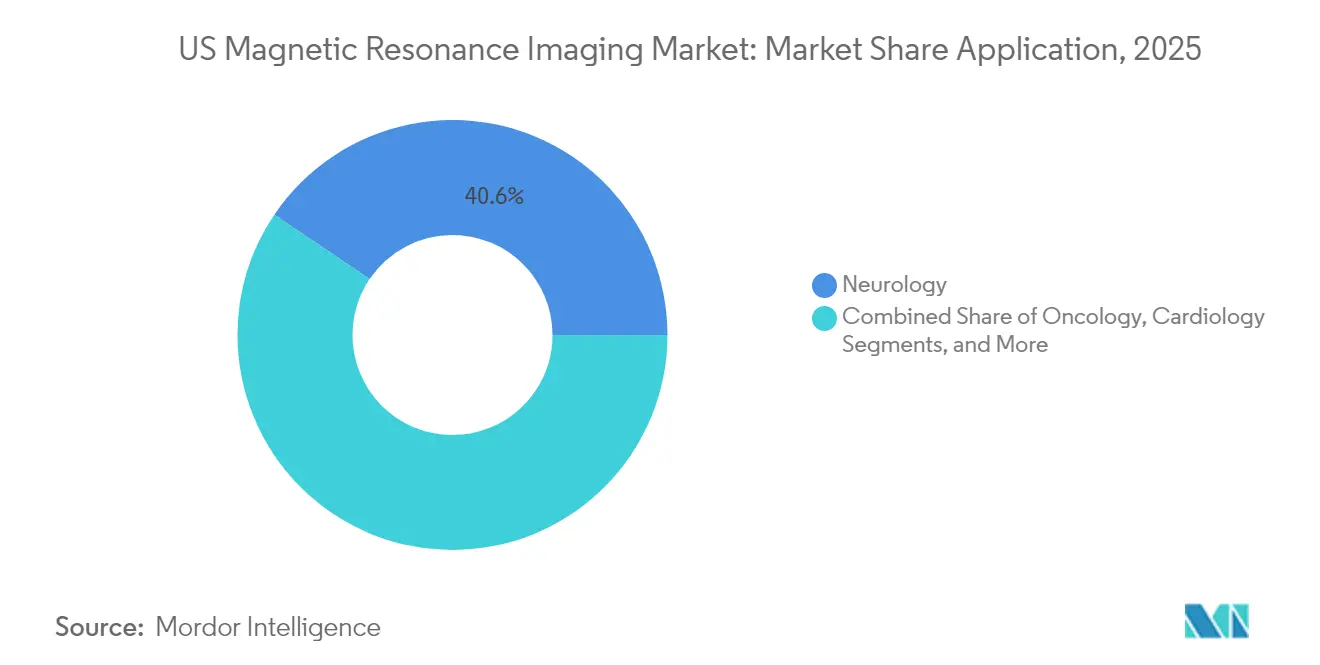
- By application, neurology accounted for a 40.55% share of the US MRI market size in 2025; oncology imaging is set to widen fastest at a 6.86% CAGR over the forecast window.
Note: Market size and forecast figures in this report are generated using Mordor Intelligence’s proprietary estimation framework, updated with the latest available data and insights as of 2026.
Market Trends and Insights
Drivers Impact Analysis of US Magnetic Resonance Imaging Market*
| Driver | (~) % Impact on CAGR Forecast | Geographic Relevance | Impact Timeline |
|---|---|---|---|
| Rising global burden of chronic and age-related diseases | +1.5% | National, with higher concentration in aging population centers and metropolitan areas | Long term (≥ 4 years) |
| Increasing reimbursement coverage and government support for high-value imaging modalities | +1.0% | National, with emphasis on Medicare Advantage expansion and state Medicaid programs | Medium term (2-4 years) |
| Technological breakthroughs in MRI | +1.2% | National, with early adoption in major metropolitan areas and academic medical centers | Medium term (2-4 years) |
| Steady growth in healthcare spending and modernization of hospital & outpatient imaging infrastructure worldwide | +0.8% | National, with accelerated growth in underserved rural areas and suburban markets | Long term (≥ 4 years) |
| Expanding clinical indications for MRI | +0.6% | National, with concentration in specialty care centers and research institutions | Medium term (2-4 years) |
| Shift toward patient-centric, non-ionizing diagnostic alternatives | +0.5% | National, with higher adoption in consumer-focused healthcare markets | Long term (≥ 4 years) |
| Source: Mordor Intelligence | |||
Rising Global Burden of Chronic and Age-Related Diseases
Seventy-six point four percent of US adults reported at least one chronic condition in 2025, a pattern that translates into sustained MRI utilization for neurological, oncological, and cardiac evaluations. Providers favor the modality’s soft-tissue contrast to diagnose Alzheimer’s, multiple sclerosis, and ischemic stroke, where early detection improves therapeutic outcomes. FDA clearance for GE HealthCare’s head-only SIGNA MAGNUS 3.0 T platform exemplifies industry response, delivering specialized neuro-imaging in shorter sessions [1]. The same demographic shift accelerates oncology imaging because precision medicine protocols rely on repeat, high-resolution tumor mapping. Collectively, the chronic disease burden adds a 1.8-percentage-point lift to long-term market growth.
Increasing Reimbursement Coverage and Government Support for High-Value Imaging Modalities
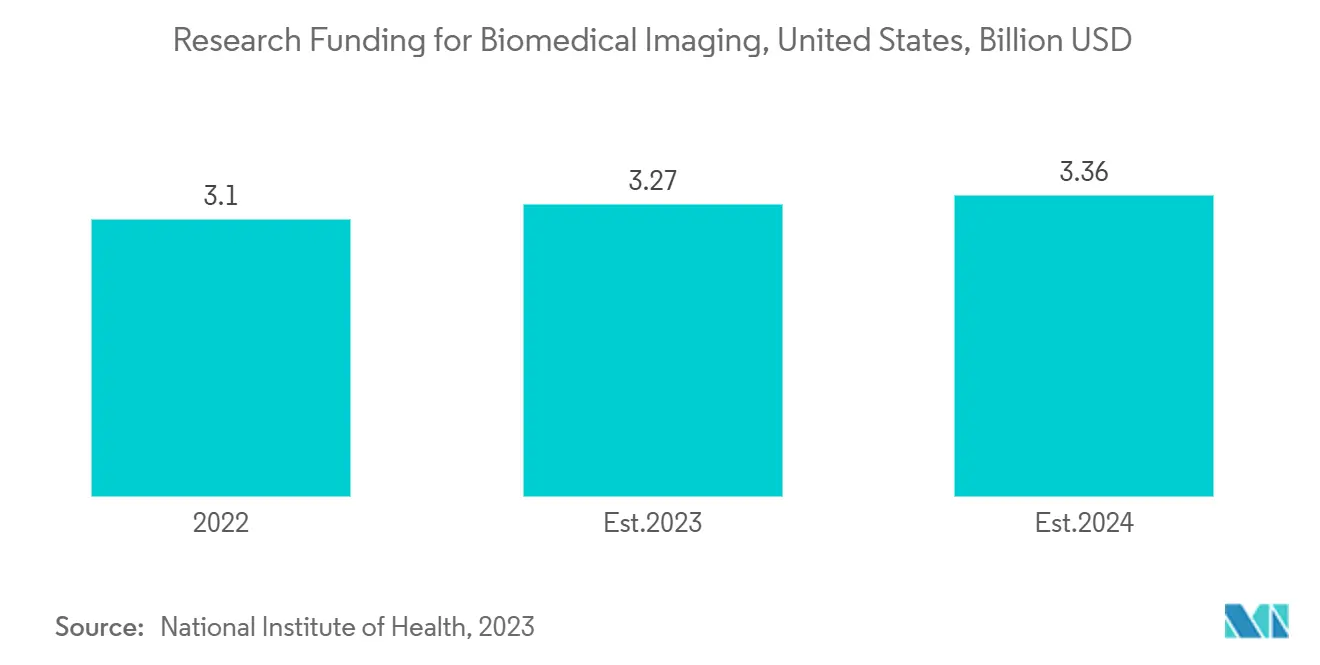
CMS finalized a 5.06% rate hike for Medicare Advantage plans in 2026, releasing more than USD 25 billion in extra funding that will flow into diagnostic imaging volumes [2]. Administrative relief also arrived when CMS removed the lumbar-spine MRI measure from quality reporting, easing provider workflow. Commercial payers follow suit by steering patients to cost-efficient outpatient centers, which often invest in new scanners to win network contracts. These moves collectively add 1.2-percentage-points to medium-term growth while reducing historical revenue volatility tied to fee-schedule cuts.
Technological Breakthroughs in MRI
Deep-learning reconstruction shrinks scan times by roughly 30%, lifting daily scanner capacity by as much as one-third without sacrificing image quality. Philips’ SmartSpeed Precise engine doubles this benefit by pairing two AI algorithms to enhance sharpness 80% and cut exam time by a factor of three. At the opposite end of the spectrum, 0.05 T ultra-low-field prototypes plug into standard wall power and waive RF-shielding needs, trimming install cost close to 90%. Bayer’s gadoquatrane contrast agent lowers gadolinium exposure 60%, a safety gain for renally impaired patients. Collectively, technology adds 1.5 percentage-points to CAGR as hospitals adopt AI suites and helium-free magnets.
Steady Growth in Healthcare Spending and Modernization of Hospital & Outpatient Imaging Infrastructure Worldwide
Allegheny Valley Hospital invested USD 12 million to expand its radiology suite, inserting a mobile MRI to open 40 new weekly slots. Certificate-of-need reform quickens outpatient build-outs; US Radiology Specialists plans 12 freestanding centers in 2025 to extend reach into underserved communities. Vizient projects advanced outpatient imaging to climb 13% over the next decade, a shift that supports the US MRI market trajectory. GE HealthCare’s seven-year pact with Sutter Health covers 300 facilities and integrates AI triage tools, illustrating how vendors secure long-run volume through enterprise deals.
Restraints Impact Analysis of US Magnetic Resonance Imaging Market*
| Restraint | (~) % Impact on CAGR Forecast | Geographic Relevance | Impact Timeline |
|---|---|---|---|
| High cost of MRI systems | -0.8% | National, with pronounced impact in rural and underserved areas, community hospitals | Long term (≥ 4 years) |
| Shortage of Certified MRI Technologists | -1.2% | National, with severe shortages in rural areas, secondary markets, and non-metropolitan regions | Short term (≤ 2 years) |
| Declining reimbursement rates for advanced imaging | -0.9% | National, with particular impact on Medicare-dependent providers and rural hospitals | Short term (≤ 2 years) |
| Safety and compatibility concerns for patients | -0.4% | National, with higher impact in facilities serving elderly populations and patients with implants | Medium term (2-4 years) |
| Source: Mordor Intelligence | |||
High Cost of MRI Systems
A high-field scanner typically costs more than USD 225,000 and demands expensive site prep that includes RF shielding and cryogenic cooling [3]. Rural hospitals already under fiscal strain defer such purchases, contributing to more than 100 facility closures since 2010 that removed imaging access for nearly one-fifth of rural residents. Technology is starting to blunt the barrier: ultra-low-field hardware priced near USD 22,000 eliminates helium, while Philips BlueSeal magnets save 5 million liters of helium and 40 MWh of energy per system since 2018. Even as acquisition costs erode, price remains a drag of 0.8-percentage-points on long-term growth.
Shortage of Certified MRI Technologists
Vacancy rates for radiologic technologists stood at 18.1% in 2025 compared with 6.2% three years earlier [4]. Staffing gaps lengthen wait times and force some departments to curtail evening or weekend schedules, limiting throughput by up to 20%. Salaries climbed to a median USD 83,740, yet training capacity lags demand. Providers respond with apprenticeship programs like US Radiology Specialists’ Technologist Advancement Academy, which graduated 19 technologists and enrolled 27 trainees in 2025. AI automation lightens repetitive positioning and protocol selection, but human oversight of patient safety and quality assurance remains non-negotiable, subtracting 1.2-percentage-points from short-term growth.
*Our forecasts treat driver/restraint impacts as directional, not additive. The impact forecasts reflect baseline growth, mix effects, and variable interactions.
US Magnetic Resonance Imaging Market Segment Analysis
By Architecture:
Closed Systems Dominate Despite Portable InnovationClosed units held 77.62% of the US MRI market in 2025, confirming the modality’s reliance on full-body, high-field imaging for complex neuro and oncology cases. The canonical wide-bore 70 cm format eases patient anxiety without compromising gradient performance, a mix ideal for community hospitals that require versatility. Extremity-specific magnets cater to orthopedic clinics, yet their impact on total revenue remains modest. Portable systems contribute the fastest growth at 6.31% CAGR through 2031 as emergency departments, intensive-care units, and rural sites seek point-of-care diagnostic options. Hyperfine’s FDA-cleared Swoop employs NVIDIA AI to improve brain image quality and demonstrates a mobile install footprint the size of a ventilator cart. Open magnets retain relevance for claustrophobic or bariatric patients, though their lower field strength limits nuanced neurovascular work compared with closed 1.5 T or 3 T designs.
Portable MRI’s rise intersects with value-based care goals because bedside imaging avoids costly patient transport and lowers sedation risk. Yet reimbursement codes still favor conventional rooms, so adoption concentrates within academic centers able to fund pilots. Vendors now bundle financing and AI software to convert pilot orders into fleet rollouts, a tactic reflecting broader competition on total cost of ownership rather than sticker price. Hospitals that replace aging 1.5 T scanners often opt for helium-free magnets to hedge against commodity volatility, a choice that further cements closed architecture leadership while portable units carve new revenue streams in non-traditional settings.

By Field Strength:
Mid-Field Dominance with Ultra-High GrowthOne-point-five-tesla scanners represented 47.62% of the US MRI market size for field strength in 2025, favored for balanced acquisition cost, maintenance, and clinically adequate signal-to-noise ratios. Community hospitals prefer 1.5 T because gradient upgrades and AI reconstruction now rival 3 T performance in many body and cardiac applications. Low-field magnets under 0.3 T stay relevant where metal implants or cost constraints preclude high-field use, but their share declines as portable high-performance options emerge. GE SIGNA Sprint pushes 1.5 T gradient power to 200 mT/m, blurring the historical performance gap with 3 T systems.
Ultra-high-field platforms above 7 T log a 5.98% CAGR through 2031, primarily within research hospitals that require micro-structural brain imaging or spectroscopy. FDA cleared 7 T for limited clinical use, and presurgical mapping for epilepsy benefits from submillimeter resolution that guides resection margins. However, siting a 7 T unit entails reinforced flooring and new power feeds, which caps volumes to top neurology centers. Very-high-field 3 T maintains an important niche in advanced musculoskeletal and prostate work, where higher signal-to-noise ratios permit multiparametric protocols without contrast. Investors weigh ultra-high-field revenue potential against utilization risk; therefore many choose 3 T upgrades combined with AI acceleration as an interim path toward precision imaging.
By Application:
Neurology Leadership with Oncology AccelerationNeurology retained 40.55% of the US MRI market size by application in 2025, underscoring MRI’s dominant role in stroke triage, dementia workups, and multiple sclerosis monitoring. Coils rated for 3 T magnets controlled 46.1% of MRI coils market share in 2024, reflecting the modality’s indispensability in neuro-oncology, advanced cardiac and cartilage studies. The SIGNA MAGNUS head-only platform signals manufacturers’ commitment to neurology, where focused field homogeneity yields superior cortical detail. Cardiac applications grow steadily thanks to contrast advances such as flurpiridaz that sharpen perfusion mapping. Musculoskeletal imaging benefits from dedicated extremity coils, serving sports medicine and aging baby boomers seeking joint replacements.
Oncology commands the fastest trajectory at a 6.86% CAGR, reflecting both incidence trends and precision therapy. Abbreviated breast MRI protocols bring exam time under ten minutes, making high-risk screening feasible in busy outpatient centers. The University of Waterloo’s synthetic diffusion sequence makes malignant tissue glow, allowing surgeons to plan margins with confidence. AI drives lesion segmentation and response assessment, giving radiologists quantitative biomarkers that translate directly into clinical trial endpoints. As payers link reimbursement to outcomes, such analytics elevate MRI from anatomical snapshot to longitudinal decision platform.
Geography Analysis
The United States exhibits regional contrasts that influence scanner mix and procedure volume. Major metro areas such as New York, Los Angeles, and Chicago account for the densest concentration of 3 T and experimental 7 T installations owing to academic medical centers and higher per-capita health expenditure. CMS projects national health-spending growth of 5.6% annually through 2032, a trend that funds continued fleet renewal in these hubs. Northeast and West Coast providers execute early AI rollouts because strong capital reserves offset software subscription fees. Patients in these regions receive MRI earlier in the diagnostic chain, which raises utilization to levels that eclipse national averages.
Rural communities house nearly 20% of the population yet witnessed more than 100 hospital closures since 2010, creating imaging deserts that pressure state health agencies to subsidize point-of-care solutions. Hyperfine and other portable vendors position ultra-low-field units as bridge technology that brings neuroimaging to critical-access hospitals without infrastructure overhaul. Southern and Midwest states show mixed dynamics; urban centers invest in 3 T upgrades while farming counties struggle with staffing shortages. Regional Certificate-of-Need reform loosens restrictions, enabling outpatient developers to open imaging centers near growing suburbs, a change likely to lift regional scan volumes over the next five years.
Medicare Advantage penetration varies widely, topping 55% in Florida yet below 25% in Wyoming, which shapes reimbursement appetites for new technology. States with generous Medicaid expansion also channel demand; community hospitals in California leverage supplemental payments to finance helium-free magnets as part of decarbonization pledges. The 300-facility Sutter Health–GE pact in California illustrates how vendor-provider alliances expand AI capability statewide, while Mid-Atlantic systems pursue similar deals to counter competitive threat from regional for-profit chains.
Regulatory Landscape
MRI systems in the United States are regulated by the US Food and Drug Administration (FDA), Center for Devices and Radiological Health (CDRH). Conventional magnetic resonance diagnostic devices are generally regulated as Class II devices (21 CFR 892.1000), which commonly requires 510(k) clearance prior to commercialization. For non-substantially equivalent devices, clinical investigations can require an Investigational Device Exemption (IDE), depending on the risk determination.
Compliance expectations have also moved toward harmonized quality systems. The FDA Quality Management System Regulation (QMSR) became effective on February 2, 2026, and it incorporates ISO 13485:2016-aligned requirements, shaping OEM design controls, supplier qualification, and post-market processes. In parallel, FDA guidance on testing and labeling for safety in the MR environment continues to influence labeling, accessory compatibility, and site safety practices at hospitals and outpatient imaging centers.
Value Chain Analysis
The US MRI value chain includes upstream component suppliers for superconducting magnets, cryogenics or sealed magnet technologies, gradient and RF subsystems, coils, and electronics, followed by OEM system integration, software configuration, and quality assurance. Value capture tends to concentrate in final assembly and integration, workflow and reconstruction software, installation services (including site planning and RF shielding when required), and lifecycle service contracts that support uptime and fleet standardization for large health systems.
Sourcing dynamics remain a key differentiator, since high-field magnet assemblies and certain precision subsystems are often imported from established manufacturing bases in Europe and Japan. Distribution and service are then carried out through OEM field organizations and third-party service providers. The FDA Office of Supply Chain Resilience (OSCR) also adds an institutional anchor for medical device supply monitoring, reinforcing the strategic importance of supplier diversification, parts availability, and remote monitoring for installed-base performance.
Competitive Landscape
The US MRI market shows moderate concentration as three multinationals—GE HealthCare, Siemens Healthineers, and Philips—control the broadest portfolios. Each invests over USD 1 billion in R&D yearly and secures enterprise contracts that lock in service revenue. GE paired with Sutter Health for a seven-year, system-wide imaging refresh and separately joined RadNet to pilot SmartTechnology AI suites that promise double-digit productivity gains. Siemens counters with DeepResolve reconstruction and an open subscription model that bundles software updates for the life of the magnet. Philips focuses on sustainability; BlueSeal helium-free magnets minimize downtime linked to global helium scarcity.
Disruptors attack niche pain points. United Imaging gained FDA clearance for the uMR Jupiter 5 T scanner and offers a white-glove delivery model that compresses site planning timelines from months to weeks. Hyperfine monetizes bedside neuroimaging in stroke units, a workflow incumbents find difficult to replicate without cannibalizing flagship products. Patent activity remains brisk: Philips filed 594 medical-technology applications at the European Patent Office during 2024 alone, signaling continued arms race in magnet design, AI, and workflow orchestration.
Price competition intensifies around mid-field systems where a crowded vendor slate—Canon, Fujifilm, Esaote, and Neusoft—offers robust performance at lower cost. Service differentiation emerges through remote monitoring that predicts coil failures and prescribes maintenance parts before downtime occurs. Tier-two hospitals weigh multivendor service contracts to rationalize fleets featuring mixed brands, forcing OEMs to prove value beyond the hardware sale. Overall, market rivalry rewards suppliers that blend hardware, software, and lifecycle financing into a single proposition that aligns with provider cost constraints and quality metrics.
US Magnetic Resonance Imaging Industry Leaders
-
Fujifilm Holdings Corporation
-
Siemens Healthcare GmbH
-
GE HealthCare
-
Canon Inc. (Canon Medical Systems Corporation)
-
Koninklijke Philips N.V
- *Disclaimer: Major Players sorted in no particular order
US Magnetic Resonance Imaging Market Companies Covered in this Report
- GE Healthcare
- Siemens Healthineers
- Koninklijke Philips
- Canon Inc. (Canon Medical Systems)
- Fujifilm Holdings Corp. (incl. Hitachi MRI)
- United Imaging Healthcare
- Shenzhen Anke High-Tech
- Esaote
- Neusoft Medical Systems Co.
- Aurora Imaging Technology
- Fonar Corp.
- Hyperfine, Inc.
- Bruker Corp.
- Imris (Deerfield Imaging)
- Aspect Imaging
- Paramed Medical Systems
- Medtronic plc (MRI-guided surgical systems)
- Insightec Ltd. (MRI-guided focused ultrasound)
- Hitachi Ltd. (legacy installed base)
- Synaptive Medical
- Time Medical Systems
Market Opportunities and Future Outlook
Replacement demand and modernization create a broad addressable pool for vendors and service partners, especially as providers focus on throughput and staffing efficiency alongside an 18.1% radiologic technologist vacancy rate reported in 2025. AI-enabled reconstruction and workflow automation open whitespace in mid-field and high-field upgrades (1.5 T and 3 T), where providers can increase exam capacity without adding rooms. These enterprise purchasing patterns are visible in agreements such as GE HealthCare’s seven-year pact with Sutter Health, which covers 300 facilities and reflects bundled software, service, and standardization.
Sustainability-driven choices also extend near-term opportunity across new placements and refresh cycles, including helium-free or virtually helium-free magnet designs and lower-energy operation. Recent FDA clearances and 2026 launches, such as Siemens Healthineers’ virtually helium-free MAGNETOM Flow 1.5 T platform and Philips solutions spanning AI cardiac planning and MR-enabled radiotherapy simulation, also point to product pathways that broaden MRI use beyond routine diagnostics into oncology treatment workflows and more standardized cardiac MR adoption across sites.
Recent Industry Developments in US Magnetic Resonance Imaging Market
- May 2026: Philips introduced Philips 4D MR-RT for radiotherapy simulation with FDA 510(k) clearance. The launch expands MR-enabled radiotherapy planning capabilities; AI/contrast integration enhances workflow efficiency and precision.
- February 2026: SIGNA Sprint Elite 1.5T MRI cleared/implemented at Inova for cardiac, oncologic, and pediatric imaging. The capacity addition strengthens GE's AI-enabled pipeline in core US hospital networks; potential multi-site scalability impact.
- January 2026: Magnetom Flow 1.5T MRI platform FDA clearance (virtually helium-free). The sustainability-focused chassis upgrades signal a trend toward low/no-helium magnets in US market and support broader adoption of helium-free technology.
US Magnetic Resonance Imaging Market Report Scope and Research Methodology
Market Definition and Coverage
For this study, the market is the value of new magnetic resonance imaging (MRI) scanners sold and installed in the United States across hospitals, imaging centers, and similar care settings, counted in current USD for the year of sale.
Scope exclusions: We exclude revenue from service contracts, software-only upgrades, coils and consumables sold separately, and refurbished or pre-owned MRI systems.
Segments Covered in This Report
- By Architecture
- Closed MRI Systems
- Open MRI Systems
- Wide-Bore MRI Systems
- Extremity MRI Systems
- By Field Strength
- Low Field MRI Systems (≤0.3 T)
- Mid Field MRI Systems (0.3 T–1.0 T)
- High Field MRI Systems (1.5 T)
- Very-High Field MRI Systems (3 T)
- Ultra-High Field MRI Systems (≥7 T)
- By Application
- Oncology
- Neurology
- Cardiology
- Gastroenterology
- Musculoskeletal
- Other Applications
Data Sources, Market Sizing, and Validation
Desk Research
Desk research is used to build the starting structure for the model and to set realistic ranges for demand and pricing across the United States. We relied on public healthcare utilization and payment signals, and then matched them with equipment deployment context so assumptions remain aligned with how MRI is actually used in U.S. care settings.
Key references included non-paywalled sources such as the Centers for Medicare and Medicaid Services (CMS) datasets and fee schedules, CDC health statistics, the FDA device and safety communications pages, and OECD health indicators for cross-checking imaging intensity. We also used hospital and health system capital budget notes in public filings, accredited association publications, peer-reviewed radiology journals, and reputable press coverage to verify replacement cycle narratives. Select paid subscriptions for company financials and intelligence, news and financials, and patent databases were used to confirm timelines and commercialization signals. These examples are not exhaustive, and many other public sources were reviewed for data collection, validation, and clarification.
Primary Interviews and Surveys
Primary work focused on validating what is hard to observe from public data, especially average selling price ranges by field strength, buying triggers for replacement versus expansion, and how outpatient imaging centers differ from hospital procurement in the United States. We spoke with a mix of providers, radiology operations leaders, biomedical engineering teams, and distribution and service channel participants, and the checks were kept U.S.-specific so reimbursement and utilization realities were reflected.
Distribution of primary research fieldwork respondents
| Company type | Respondent position |
|---|---|
| Top tier: 37% | CXOs: 13% |
| Mid tier: 46% | Functional/Unit leaders: 37% |
| Smaller Players: 17% | Managers: 50% |
Market-Sizing & Forecasting
Sizing starts with a top-down build where U.S. MRI demand is reconstructed from imaging procedure volumes, site capacity additions, and replacement activity tied to the installed base age. Once that demand pool is formed, it is translated into unit needs by typical throughput per system and the share of exams that stay on MRI versus adjacent modalities.
To keep the numbers grounded, we corroborate totals with selective bottom-up approximations, such as sampled unit shipments discussed in channel checks, provider purchase patterns, and a practical ASP x volume build for key configurations. Inputs that mattered most included Medicare and commercial reimbursement direction, outpatient imaging center expansion, magnet utilization and scheduling intensity, field strength mix shifts (for example 1.5T versus 3T), and price movement linked to helium and component availability. Forecasts were produced using scenario analysis supported by expert views, and then smoothed using trend logic so one-time procurement spikes do not get projected forward. Where bottom-up visibility was thin, gaps were handled through conservative adoption shares that were re-tested in follow-up calls before locking the final run.
Data Validation & Update Cycle
Outputs are checked against independent signals, including procedure growth, facility expansion news, and import and production indicators that can explain short-term supply changes in the U.S. market. When a variance looks large, the assumptions are re-opened, the unit-to-revenue conversion is recalculated, and respondents are re-contacted if the shift cannot be explained by a clear market event.
A multi-step internal review is followed, where model logic, inputs, and year-to-year movements are examined before sign-off. The report is refreshed annually, and interim updates are triggered when material events change pricing, replacement cycles, or purchasing budgets. Before delivery, we run a final pass to incorporate the latest public releases so clients receive an updated view of the United States MRI scanner market.
Mordor Intelligence's United States Magnetic Resonance Imaging Market Size Compared Against Other Published Estimates
Published MRI market numbers for the United States can look far apart because each publisher draws the market box differently and then applies different unit-to-revenue conversions. The biggest swings usually come from what is counted as revenue, how refurbished equipment is treated, and whether the model is anchored to procedure demand or to supplier shipment assumptions.
Some estimates expand the scope into service contracts, software upgrades, or coils and accessories, which naturally inflates the total even if scanner shipments are stable. In Mordor Intelligence, the value is limited to new, factory-built MRI systems sold into U.S. care settings, and totals are kept in line using replacement cycle checks and configuration-level ASP ranges validated in interviews.
Benchmark comparison
| Source | Market Size | Gaps in Research Methodology |
|---|---|---|
| Mordor Intelligence | USD 3.62 B (2025) | |
| Regional Consultancy A | USD 2.00 B (2024) | Uses a narrower product view that drops certain system types and applies older ASP assumptions, and then scales the U.S. number from limited shipment signals without a full replacement cycle check. |
| Trade Journal B | USD 2.09 B (2024) | Relies on global-to-U.S. share splits and a single demand proxy, which can miss outpatient expansion and configuration mix changes that move scanner ASP and revenue even when unit growth is modest. |
Across the three figures, the spread is mainly explained by scope choices and the conversion from units and utilization into revenue. By tying demand to U.S. procedure and capacity signals, and then stress-testing it with practical ASP x volume checks, the estimate stays traceable to inputs that can be rechecked and updated.
Key Questions Answered in the Report
How big is the US Magnetic Resonance Imaging Market?
The US Magnetic Resonance Imaging Market size is expected to reach USD 3.83 billion in 2026 and grow at a CAGR of 5.88% to reach USD 5.1 billion by 2031.
Which MRI architecture holds the largest share?
Closed-bore systems commanded 77.62% of US MRI market share in 2025 owing to superior image quality and scan versatility.
Who are the key players in US Magnetic Resonance Imaging Market?
Fujifilm Holdings Corporation, Siemens Healthcare GmbH, GE HealthCare, Canon Inc. (Canon Medical Systems Corporation) and Koninklijke Philips N.V are the major companies operating in the US Magnetic Resonance Imaging Market.
What main challenge limits market growth?
A shortage of certified MRI technologists remains the most immediate bottleneck, with vacancy rates at 18.1% in 2025.