Market Overview
| Study Period | 2020 - 2031 |
|---|---|
| Base Year For Estimation | 2025 |
| Forecast Data Period | 2026 - 2031 |
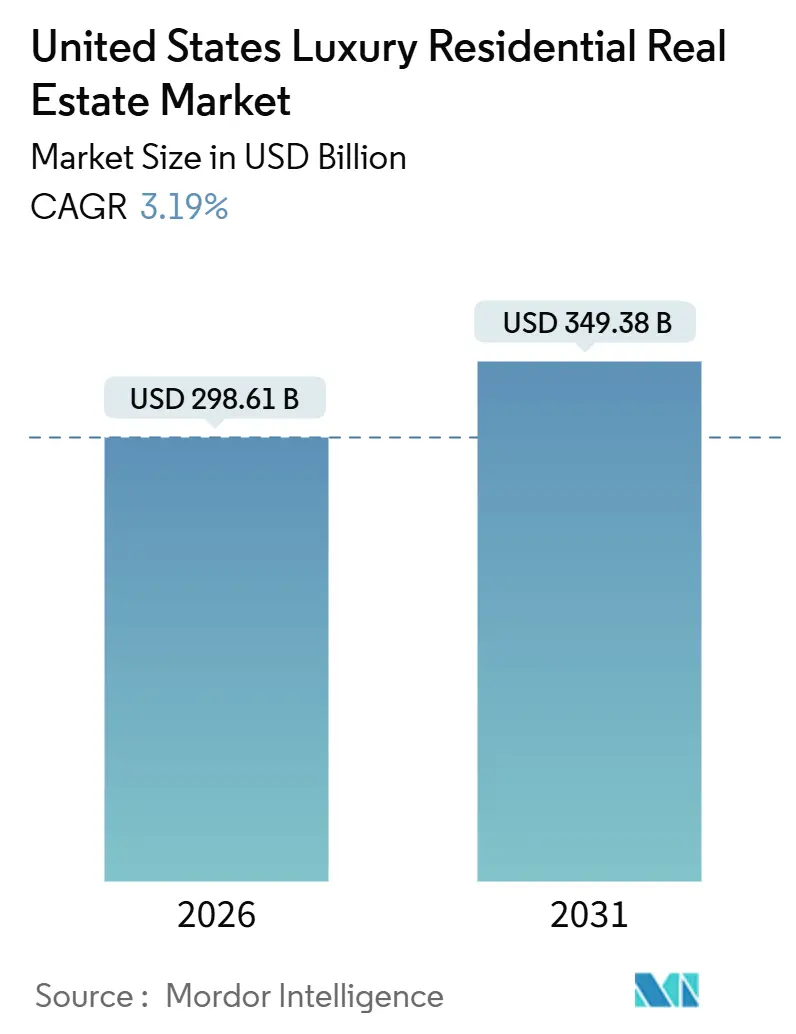
| Market Size (2026) | USD 298.61 Billion |
| Market Size (2031) | USD 349.38 Billion |
| Growth Rate (2026 - 2031) | 3.19% CAGR |
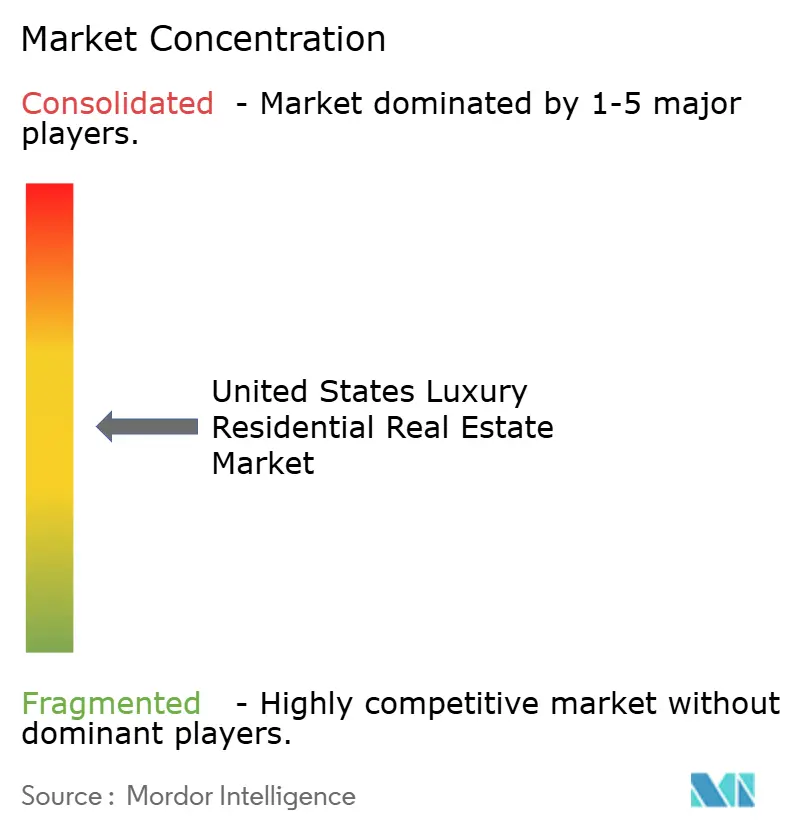
| Market Concentration | Medium |
Major Players *Disclaimer: Major Players sorted in no particular order Image © Mordor Intelligence. Reuse requires attribution under CC BY 4.0. | |
United States Luxury Residential Real Estate Market Analysis by Mordor Intelligence
The United States Luxury Residential Real Estate Market size is estimated at USD 298.61 billion in 2026, and is expected to reach USD 349.38 billion by 2031, at a CAGR of 3.19% during the forecast period (2026-2031).
Buyers in this tier are shaped by ultra-low luxury resale inventory in prime ZIP codes and a steady pipeline of green-certified new product that signals quality and long-run asset protection. The segment continues to diverge from entry-level housing because a deep cash-buyer pool remains active as a hedge against equity market swings and rate sensitivity. Policy shifts and capital market innovations are also relevant, including EB-5 investor-visa set-asides and the liquidity boost following the approval of spot Bitcoin ETFs in 2024. At the same time, beneficial-owner transparency requirements set by FinCEN are expected to restrain anonymous LLC purchases in several high-priced transaction categories beginning in 2026.[1]https://www.fincen.gov/
Key Report Takeaways
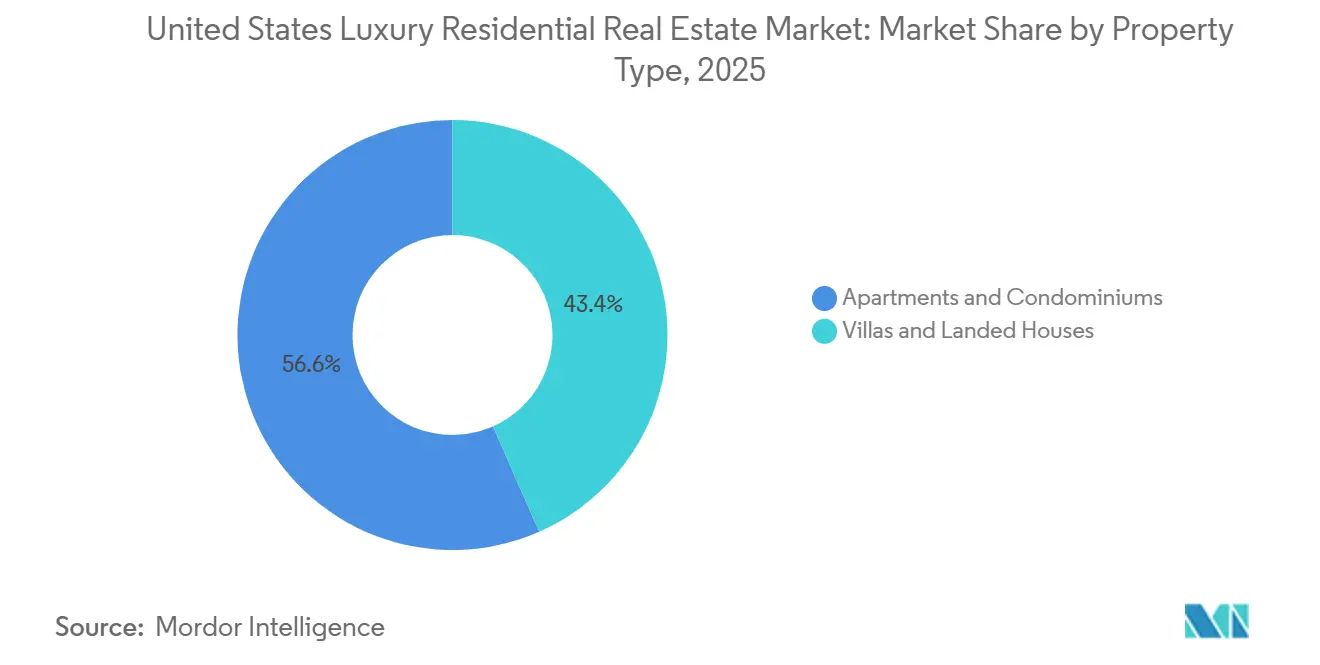
- By property type, Apartments and Condominiums led with 56.62% revenue share in 2025, and Villas and Landed Houses are projected to grow at a 3.10% CAGR through 2031.
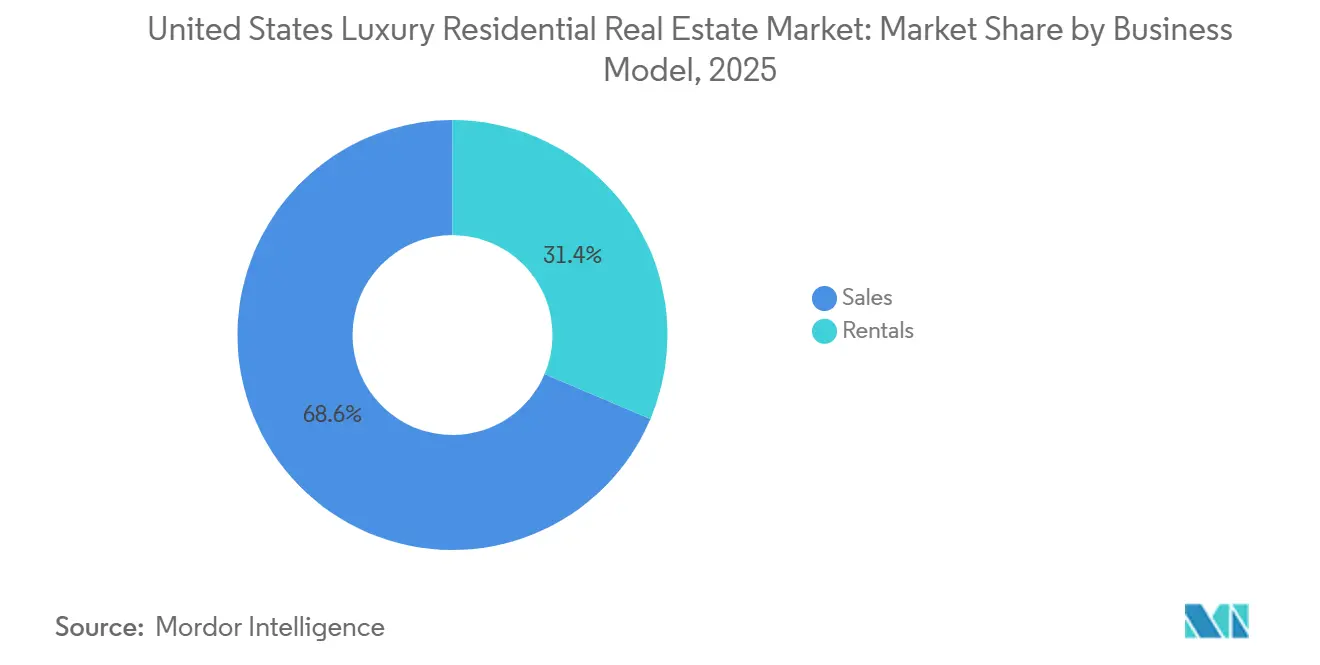
- By business model, Sales accounted for 68.62% of revenue in 2025, while Rentals are forecast to expand at a 3.16% CAGR through 2031.
- By mode of sale, Secondary captured a 62.62% share in 2025, and Primary is projected to grow at a 3.22% CAGR through 2031.
- By region, the West held a 31.62% share in 2025, and the Southeast is projected to be the fastest-growing at a 3.13% CAGR through 2031.
Note: Market size and forecast figures in this report are generated using Mordor Intelligence’s proprietary estimation framework, updated with the latest available data and insights as of January 2026.
United States Luxury Residential Real Estate Market Trends and Insights
Drivers Impact Analysis
| Drivers | (~) % Impact on CAGR Forecast | Geographic Relevance | Impact Timeline |
|---|---|---|---|
| Ultra-low existing-home inventory in prime ZIP codes | +0.8% | West (California coastal markets), Northeast (Hamptons, Manhattan), Southeast (Miami, Naples) | Medium term (2-4 years) |
| Resilient cash-buyer segment hedging against equity & rate volatility | +0.7% | National, with spillover intensity in Florida, Texas, and Arizona | Short term (≤ 2 years) |
| Surge in green-certified luxury builds | +0.6% | Global, with early gains in California (LEED), Massachusetts, Colorado, and Washington state | Long term (≥ 4 years) |
| EB-5 investor-visa quota expansion unlocking fresh foreign capital (2025 rule change) | +0.5% | APAC core, spillover to Southeast (Florida), West (California), Northeast (New York) | Medium term (2-4 years) |
| Approval of spot Bitcoin ETFs unleashing crypto-investor liquidity into trophy homes | +0.4% | West (California, tech hubs), Southeast (Miami), select Southwest (Austin) | Short term (≤ 2 years) |
| Source: Mordor Intelligence | |||
Ultra-Low Existing-Home Inventory in Prime ZIP Codes
Ultra-low existing-home inventory in prime U.S. luxury ZIP codes is driven by a persistent lock-in effect from sub-4% mortgage rates held by existing owners, discouraging resale. Wealth preservation behavior among high-net-worth households favors holding trophy assets amid market volatility. Zoning restrictions, slow permitting, and community opposition constrain new supply in elite neighborhoods. Additionally, intergenerational wealth transfers, foreign capital inflows, and cash-heavy buyers reduce turnover, while premium lifestyle migration to tax-advantaged states intensifies demand, further compressing available inventory in top-tier luxury markets.
Resilient Cash-Buyer Segment Hedging Against Equity and Rate Volatility
Resilient cash-buyer segment is driven by elevated equity-market volatility, prolonged high interest rates, and growing demand for capital preservation. High-net-worth individuals increasingly deploy cash to avoid financing costs, execution delays, and credit-market uncertainty while securing negotiating leverage and price discounts. Wealth migration, strong stock-market gains over prior cycles, and rising allocations toward hard assets further support cash purchases, positioning luxury homes as inflation-resilient stores of value and portfolio diversification tools amid macroeconomic uncertainty.
Surge in Green-certified Luxury Builds (LEED, WELL)
Ultra-low luxury resale inventory continues to define the United States luxury residential real estate market, steering demand to new-builds and supporting pricing in core ZIP codes. Even with a 2026 national inventory uptick forecast, ultra-prime areas remain structurally tight, which benefits developers with ready-to-build entitlements. Cash buyers are particularly active as they are less sensitive to rate swings, which helps stabilize contract activity during periods of broader market volatility. In practice, this has reinforced absorption for branded and amenitized towers in technology and finance employment hubs. The net effect is steady transaction throughput at the high end despite mixed signals in mass-market housing.
EB-5 Processing Bottlenecks and Carryover Visas
While EB-5 set-asides are a tailwind, ongoing administrative bottlenecks have slowed the conversion of interest into completed investments. FY2024 ended with nearly 2,900 carryover visas unused, reflecting a gap between program design and on-the-ground execution. For developers relying on EB-5-linked presales or financing, longer processing timelines can impact project phasing. The constraint is time-bound and solvable, but it affects near-term capital availability and staging decisions. As processing efficiency improves, the medium-term drag is likely to ease, unlocking deferred demand.[2]https://iiusa.org/
Restraints Impact Analysis
| Restraints | (~) % Impact on CAGR Forecast | Geographic Relevance | Impact Timeline |
|---|---|---|---|
| Construction-input inflation squeezing developer margins | -0.7% | National, with acute pressure in the West (California), the Northeast (New York) | Short term (≤ 2 years) |
| Climate-risk-driven insurance-premium spikes & carrier withdrawals in coastal/wildfire zones | -0.6% | Southeast (Florida), West (California, wildfire zones), Southwest (Texas coastal) | Medium term (2-4 years) |
| FinCEN's nationwide beneficial-owner disclosure rule dampening anonymous LLC purchases | -0.4% | National, with concentrated impact in Florida, New York, California | Short term (≤ 2 years) |
| Proposed federal luxury-home transfer tax (2–5%) creating price uncertainty for USD 5 million-plus deals | -0.3% | National, if enacted; precedent set by state/local levies (New Jersey, Los Angeles, Rhode Island) | Long term (≥ 4 years) |
| Source: Mordor Intelligence | |||
Construction-input Inflation Squeezing Developer Margins
U.S. residential construction costs remain elevated despite post-2022 moderation, with renewed pressure in 2025 driven by steel, lumber, gypsum inflation, and higher tariffs. Margin compression is prompting project delays, while scale luxury builders protect profitability through pricing power. Developers are increasingly adopting modular construction to shorten timelines and reduce material waste, despite higher upfront capital requirements.
Climate-risk-driven Insurance-premium Spikes & Carrier Withdrawals in Coastal/Wildfire Zones
U.S. homeowners insurance stress has intensified, with non-renewals in Florida and California exceeding 3% in 2024 as major insurers reduced exposure amid rising construction costs and climate risk. California’s FAIR Plan exposure surged to USD 650 billion by mid-2025. Luxury homes face higher non-renewal risk, constraining liquidity, while escalating disaster losses and insurance inflation drive underinsurance despite selective self-insurance by ultra-wealthy buyers.
Segment Analysis
By Property Type: Apartments and Condominiums define the center of gravity
Sales accounted for the largest revenue slice at 68.62% in 2025, while Rentals are forecast to expand at a 3.16% CAGR through 2031, signalling a durable two-track model for the sector. Sales retain primacy in gateway and resort markets favored by global wealth, while high-end rentals benefit from flexibility demand among executives and relocating families. The United States luxury residential real estate market size attached to Rentals is indirectly supported by institutional platforms that professionalize management and amenity delivery, which improves tenant retention. Notable portfolio moves include partnerships that scale single-family rental operations and sharpen asset-light strategies across cycles. In urban cores, luxury lease-up periods remain healthy when projects are tied to employment clusters and transit.
The United States luxury residential real estate industry is also seeing rental offerings integrate ESG-forward designs and hospitality-grade services. Operators are layering co-working spaces, wellness amenities, and concierge services to attract tenants who value experience parity with ownership properties. Asset managers and developers continue to rebalance exposure as capital costs shift and as valuations normalize from post-pandemic peaks. Sales channels remain strong in the ultraluxury tier, supported by cash buyers and international interest where policy and tax profiles are favourable. Over the forecast horizon, both channels should contribute meaningfully to the United States luxury residential real estate market as consumer preferences diversify.[3]https://www.kennedywilson.com/
Get Detailed Market Forecasts at the Most Granular Levels
Download PDF
By Mode of Sale: Secondary listings lead while new-builds quicken
Secondary transactions captured 62.62% of activity in 2025, reflecting the depth of existing luxury neighborhoods and the trading of legacy trophy assets across top metros. Primary is projected to accelerate at a 3.22% CAGR through 2031 because resale supply in ultra-prime areas remains constrained despite broader inventory gains expected in 2026. Longer marketing timelines in late 2025 show normalization from the post-2021 surge, which improves buyer optionality and deal diligence at the top end. Developers with strong presale strategies and brand affiliations remain well-positioned to benefit from tight resale conditions. The United States luxury residential real estate market size for new-builds is supported by projects that combine climate resilience, hospitality services, and curated amenities.
The United States luxury residential real estate industry will continue to balance resale depth with targeted ground-up deliveries in high-demand corridors. In metros where urban rezoning and master-planned communities unlock scale, primary supply can grow without overshooting demand. Where legacy neighborhoods dominate, renovations and conversions will shape a portion of inventory turnover while preserving character assets. The interplay of these pathways supports steady absorption and price discipline into the forecast period. Market participants will use pricing, staging, and capital partnerships to align offerings with evolving household portfolios.
By Business Model: Sales dominate while rentals gain favor
Sales accounted for the largest revenue slice at 68.62% in 2025, while Rentals are forecast to expand at a 3.16% CAGR through 2031, signaling a durable two-track model for the sector. Sales retain primacy in gateway and resort markets favored by global wealth, while high-end rentals benefit from flexibility demand among executives and relocating families. The United States luxury residential real estate market size attached to Rentals is indirectly supported by institutional platforms that professionalize management and amenity delivery, which improves tenant retention. Notable portfolio moves include partnerships that scale single-family rental operations and sharpen asset-light strategies across cycles. In urban cores, luxury lease-up periods remain healthy when projects are tied to employment clusters and transit.
The United States luxury residential real estate industry is also seeing rental offerings integrate ESG-forward designs and hospitality-grade services. Operators are layering co-working spaces, wellness amenities, and concierge services to attract tenants who value experience parity with ownership properties. Asset managers and developers continue to rebalance exposure as capital costs shift and as valuations normalize from post-pandemic peaks. Sales channels remain strong in the ultraluxury tier, supported by cash buyers and international interest where policy and tax profiles are favorable. Over the forecast horizon, both channels should contribute meaningfully to the United States luxury residential real estate market as consumer preferences diversify.
Get Detailed Market Forecasts at the Most Granular Levels
Download PDF
Geography Analysis
The West held 31.62% of the United States luxury residential real estate market share in 2025, while the Southeast is projected to be the fastest-growing region at a 3.13% CAGR through 2031. California’s technology corridors and coastal enclaves continue to anchor luxury demand, supported by branded residences and trophy projects that attract global buyers. Timed openings near major corporate campuses enhance absorption, especially where premium amenities and sustainability features are standard. Arizona’s large-scale master plans and Nevada’s entertainment-led urban cores add breadth to the West’s pipeline. Transaction pacing reflects a normalization from the 2021 to 2022 rush, yet cash-ready buyers sustain clearance for scarce high-quality listings.
The Southeast benefits from a favorable tax profile, influx of corporate relocations, and year-round lifestyle, all of which draw primary and second-home buyers to Florida’s coastal metros. Miami’s luxury ecosystem continues to benefit from international capital, hospitality brands, and finance and technology migration, lifting presales for branded towers and high-end waterfront homes. Brokerage network expansions into Northeast Florida further broaden reach in growth corridors anchored by significant urban redevelopment. South Florida remains a focal point for penthouse launches and hospitality-branded residences that extend services and cachet to owners. Across major Southeastern metros, new luxury offerings balance design, amenities, and location to meet rising expectations from global buyers.
The Northeast retains a deep base of legacy luxury neighborhoods in Manhattan and coastal Connecticut, while Boston’s biotech economy sustains high-end condo demand. Trophy developments in New York City continue to set benchmarks for design and height, appealing to global collectors of iconic addresses. In the Mid-Atlantic, Virginia’s master-planned communities are seeing new institutional and multinational developer partnerships that broaden high-end rental and for-sale supply. The Midwest remains selective, with demand strongest in central business districts and lakefront corridors where new-build efficiency and amenities meet lifestyle expectations. Overall, the United States luxury residential real estate market remains diversified by geography, with each region leveraging distinct demand drivers and development models.
Competitive Landscape
Competitive intensity is rising as scale players consolidate brokerage networks and developers streamline capital structures for asset-light growth. In January 2026, Compass completed a USD 1.7 billion all-stock acquisition of Anywhere Real Estate, bringing Century 21, Coldwell Banker, and Sotheby’s International Realty under a combined platform of 340,000 agents with USD 225 million to USD 255 million in expected annual cost synergies. The transaction expands luxury reach and suburban coverage and creates broader lead-generation and cross-referral capabilities in top-tier ZIP codes. Luxury buyers and sellers benefit from improved data, marketing reach, and multi-brand matching across the same corporate umbrella. This consolidation theme supports the operational backbone of the United States luxury residential real estate market in 2026.
Developers are also refining portfolios through targeted acquisitions and divestitures to enhance focus and liquidity. In November 2025, Kennedy Wilson closed on the acquisition of Toll Brothers Apartment Living’s platform for USD 347 million, adding USD 5 billion in assets under management and an 18-property GP interest footprint along with a 29-site development pipeline, which strengthens institutional capabilities in luxury multifamily. In February 2025, Lennar expanded into five states through the acquisition of Rausch Coleman Homes’ homebuilding operations, while separately spinning off land assets to Millrose Properties as part of an asset-light strategy. These moves show how operators are balancing development risk with scalable management platforms and capital-efficient structures. Together, these shifts underpin a resilient base for the United States luxury residential real estate market through the forecast window.
Product differentiation at the top end continues to hinge on hospitality partnerships, climate resilience, and experiential amenities. High-visibility launches and penthouse offerings signal continued appetite for nine-figure and eight-figure trophy homes in coastal destinations with strong global connectivity. Select developers are also channeling large capital programs into data center adjacencies and mixed-use hubs that bring employment and infrastructure benefits to surrounding luxury neighborhoods. Brokerage brands are expanding internationally and deepening footprints in high-growth U.S. metros, helping to match global buyers with differentiated U.S. listings across formats and price tiers. The result is a competitive field where brand strength, capital agility, and ESG-aligned design set the pace in the United States luxury residential real estate market.
United States Luxury Residential Real Estate Industry Leaders
Toll Brothers City Living
Lennar Corp (CalAtlantic Luxury)
Howard Hughes Corp
Related Companies
Extell Development
- *Disclaimer: Major Players sorted in no particular order
Need More Details on Market Players and Competitors?
Download PDF
Recent Industry Developments
- January 2026: Compass Inc. completed its landmark USD 1.7 billion all-stock acquisition of Anywhere Real Estate, combining forces with Century 21, Coldwell Banker, and Sotheby's International Realty to create a platform controlling 340,000 agents and projecting USD 225-255 million in annual cost synergies, effectively doubling Compass's footprint in luxury and suburban housing markets.
- December 2025: Toll Brothers announced Vista Ventana, a 42-unit townhome community in La Mirada, California, slated to open for sale in summer 2026, featuring two- to four-bedroom designs starting in the high USD 700,000s, marking the company's continued push into Southern California's townhome-style luxury segment.
- November 2025: KB Home launched Platinum View within San Jose's Communications Hill master plan, offering four-bedroom, three-and-a-half-bath single-family homes starting from USD 1.8 million, targeting Silicon Valley's tech workforce with ENERGY STAR certification and proximity to Google, Apple, Adobe, NVIDIA, Intel, Meta, and Cisco Systems.
- November 2025: Kennedy Wilson completed its USD 347 million acquisition of Toll Brothers' Apartment Living platform, adding USD 5 billion in assets under management, including general partner interests in 18 apartment and student housing properties totaling USD 2.2 billion and a 29-site development pipeline representing USD 3.6 billion in invested capital upon completion.
Research Methodology Framework and Report Scope
Market Definitions and Key Coverage
Our study defines the United States luxury residential real-estate market as every sale or rental of newly built or existing homes that fall in the top five percent of local price distributions or clear widely accepted luxury thresholds, roughly starting near USD 1 million for condominiums and USD 3 million for detached houses. The universe spans apartments, condos, villas, and landed estates, and each transaction is captured at its full closing value.
Scope exclusion: commercial mixed-use towers, fractional ownership schemes, timeshares, and hotel-style serviced apartments lie outside this scope.
Segmentation Overview
- By Property Type
- Apartments and Condominiums
- Villas and Landed Houses
- By Business Model
- Sales
- Rentals
- By Mode of Sale
- Primary (New-Build)
- Secondary (Existing-Home Resale)
- By Region
- Northeast
- Midwest
- Southeast
- West
- Southwest
Detailed Research Methodology and Data Validation
Primary Research
Mordor analysts interview luxury brokers across New York, Miami, Los Angeles, Austin, and Aspen, wealth advisers who track HNWI portfolio moves, and city planners overseeing high-rise permits. Their insight clarifies foreign-buyer ratios, amenity premiums, and pipeline supply gaps unseen in public records.
Desk Research
We begin with authoritative public sets such as the U.S. Census Bureau's monthly new-home sales, Bureau of Economic Analysis disposable-income tables, Internal Revenue Service migration filings, Federal Reserve Survey of Consumer Finances, and National Association of Realtors existing-home datasets. White papers from the Urban Land Institute, state realtor boards, and county recorder offices give inventory depth, absorption pace, and permit pipelines. Company 10-Ks, builder earnings calls, and SEC 8-K land-bank notes reveal average selling prices and upscale backlog values. Paid libraries, D&B Hoovers for builder revenue splits and Dow Jones Factiva for transaction news, round out the desk work. These sources are illustrative, not exhaustive; many others underpin our evidence base.
Market-Sizing & Forecasting
A top-down and bottom-up blend guides the model. We first layer luxury-home penetration rates onto total residential turnover, then validate totals through sampled closing-price × volume screens and selected builder roll-ups. Critical drivers, HNWI household growth, cash-sale share, 30-year jumbo-mortgage rates, listings above USD 1 million, and interstate migration flows, inform multivariate regression, before an ARIMA overlay smooths cyclical swings to 2030. Where builder disclosures miss markets, county deed averages close the gaps.
Data Validation & Update Cycle
Outputs face anomaly checks against Federal Reserve wealth tables, CoreLogic repeat-sales indices, and county deed logs. Senior reviewers flag variances, and re-contact triggers fire when quarterly luxury closings stray beyond two standard deviations. The model refreshes annually, with interim updates after major tax or regulatory shifts.
Why Mordor's US Luxury Residential Real Estate Baseline Commands Credibility
Published estimates differ because firms adopt distinct price cut-offs, exclude rentals, or refresh infrequently. By anchoring thresholds to local percentiles and blending national deed data with living interviews, we offer a balanced, current baseline.
Some publishers track only new builds or sales above USD 10 million, while others include second-home buys yet ignore rentals; varying inflation adjustments and currency translations widen spreads. Mordor's stated scope and annual cadence narrow those gaps.
Benchmark comparison
| Market Size | Anonymized source | Primary gap driver |
|---|---|---|
| USD 289.38 B (2025) | Mordor Intelligence | - |
| USD 164.68 B (2024) | Regional Consultancy A | Omits rentals and resales; upper limit USD 2 M |
| USD 2.0 B (2024) | Industry Analytics B | Counts only new builds above USD 10 M in select coastal metros |
The table shows how scope choices alone can shift values dramatically; our disciplined, transparent pathway gives decision-makers the most dependable starting point.
Need A Different Region or Segment?
Customize Now
Key Questions Answered in the Report
What is the size and expected growth of the United States luxury residential real estate market by 2031?
The market has a 2026 market size of USD 298.61 billion and is projected to reach USD 349.38 billion by 2031 at a 3.19% CAGR.
Which property type leads and which is growing fastest in U.S. luxury housing?
Apartments and Condominiums led with 56.62% share in 2025, while Villas and Landed Houses are the fastest growing at a projected 3.10% CAGR through 2031.
How are sales and rentals performing in high-end U.S. housing?
Sales accounted for 68.62% of 2025 activity, while Rentals are projected to grow at a 3.16% CAGR through 2031 as institutional platforms scale premium offerings.
Which sales channel is stronger today in U.S. luxury housing, and how will new-builds trend?
Secondary listings held a 62.62% share in 2025, while Primary new-builds are projected to grow at a 3.22% CAGR due to tight resale supply.
Which U.S. region currently leads and which is forecast to grow fastest in luxury housing?
The West led with 31.62% share in 2025, and the Southeast is projected to be the fastest-growing region at a 3.13% CAGR through 2031.
What regulatory and capital-market shifts are affecting luxury real estate buyers in the U.S.?
EB-5 set-asides are unlocking foreign capital, spot Bitcoin ETFs have added liquidity for some buyers, and FinCEN’s beneficial-owner rule is curbing anonymous LLC purchases.


