
Market Overview
| Study Period | 2021 - 2031 |
|---|---|
| Forecast Data Period | 2026 - 2031 |
| Base Year Market Size (2025) | USD 112.68 Billion |
| Market Size (2026) | USD 115.58 Billion |
| Market Size (2031) | USD 131.34 Billion |
| Growth Rate (2026 - 2031) | 2.59 % |
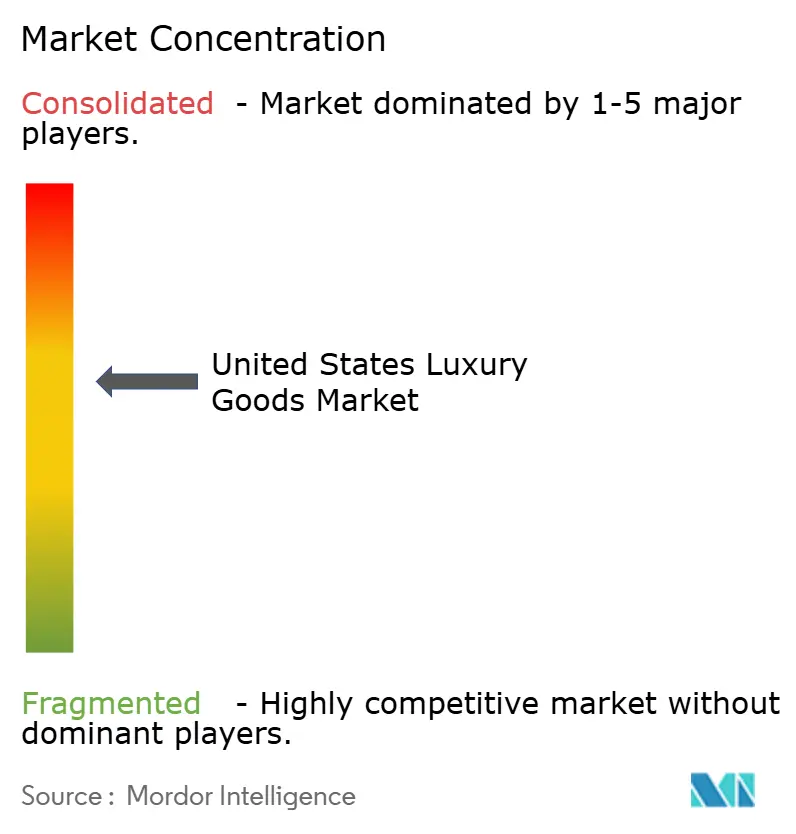
| Market Concentration | Medium |
Major Players *Disclaimer: Major Players sorted in no particular order Image © Mordor Intelligence. Reuse requires attribution under CC BY 4.0. | |
United States Luxury Goods Market Analysis by Mordor Intelligence
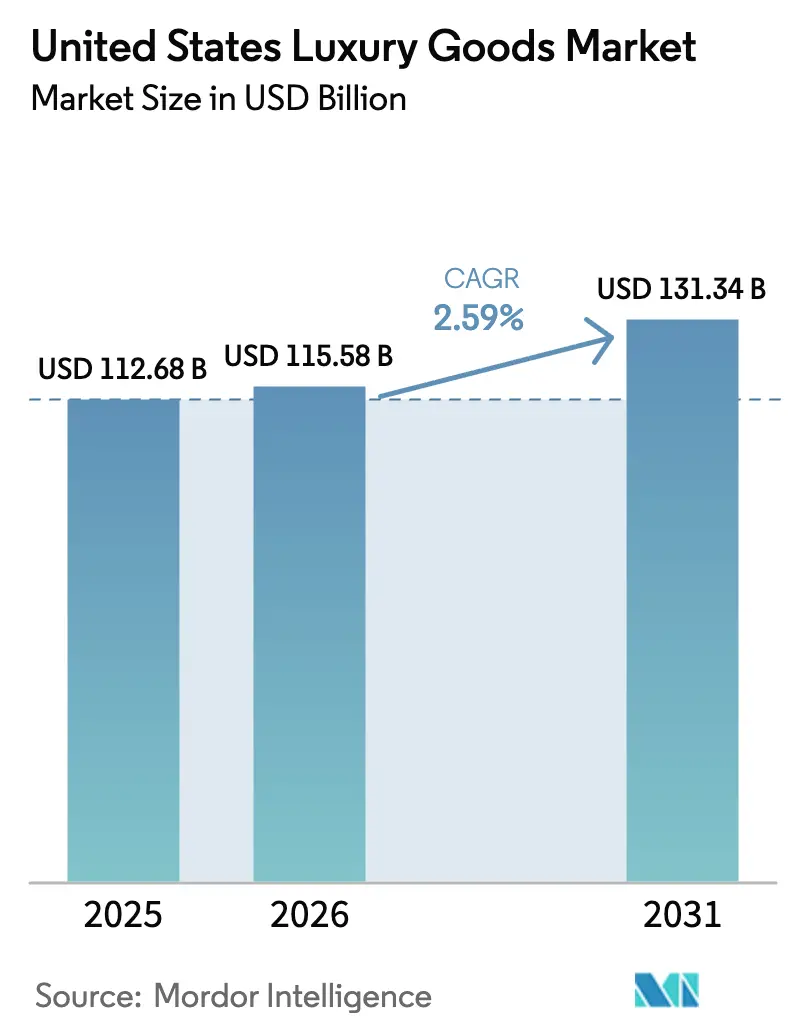
The United States Luxury Goods Market size was valued at USD 112.68 billion in 2025 and is estimated to grow from USD 115.58 billion in 2026 to reach USD 131.34 billion by 2031, at a CAGR of 2.59% during the forecast period (2026-2031). A mature domestic base means the next leg of growth comes from converting younger shoppers and nudging wallet share rather than delivering large-volume jumps. Accessories enjoy higher pricing power than ready-to-wear, while digital convenience, sustainability credentials, and celebrity-fueled visibility collectively expand reach. Competitive intensity remains moderate, anchored by a handful of European groups, yet accessible-luxury players use omnichannel tools to chip away at incumbent share. Persistent counterfeit activity, prime-retail rent inflation, and price-sensitive consumers outside gateway metros temper upside, underscoring the importance of supply-chain control, destination flagships, and differentiated storytelling.
Key Report Takeaways
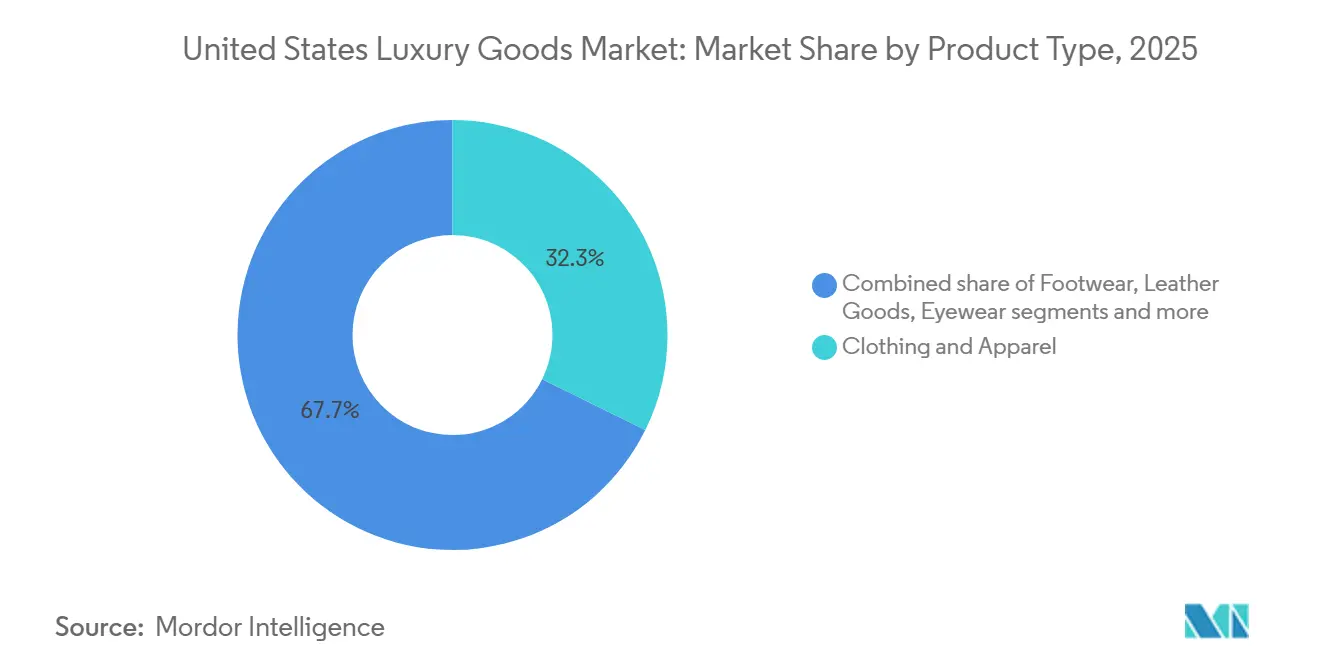
- By product type, clothing and apparel led with a 32.29% market share in 2025, while leather goods are expected to reach a CAGR of 2.76% through 2031.
- By end user, women held a market share of 54.84% in 2025, and the men segment is expected to reach a CAGR of 3.07% during the forecast period 2026-2031.
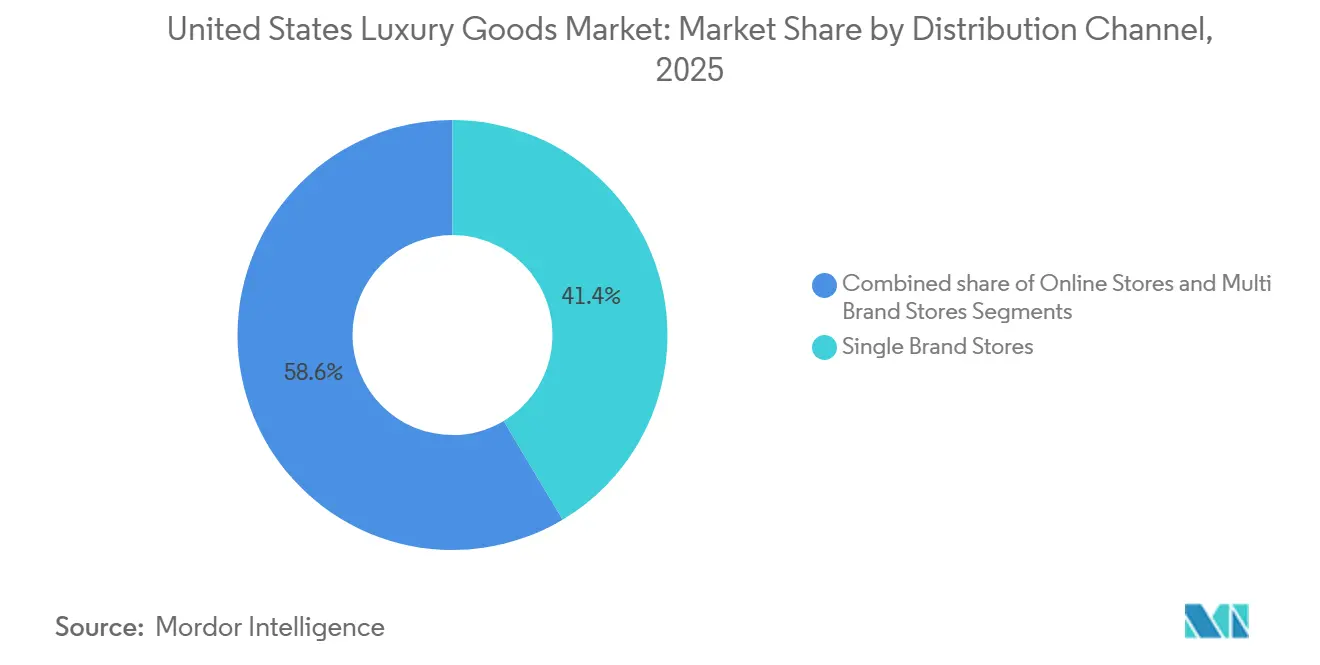
- By distribution channel, single-brand stores hold a market share of 41.44% in 2025, and online stores are expected to reach a CAGR of 3.58% through 2031.
Note: Market size and forecast figures in this report are generated using Mordor Intelligence’s proprietary estimation framework, updated with the latest available data and insights as of January 2026.
United States Luxury Goods Market Trends and Insights
Drivers Impact Analysis*
| Driver | (~) % Impact on CAGR Forecast | Geographic Relevance | Impact Timeline |
|---|---|---|---|
| Consumer emphasis on sustainability | +0.4% | National, with stronger influence in coastal metropolitan areas | Medium term (3-4 years) |
| Influence of social media and celebrity endorsement | +0.6% | National, with higher impact in urban centers | Short term (≤ 2 years) |
| Increasing strategic investment and initiatives propelling the market | +0.5% | National, concentrated in fashion hubs like New York and Los Angeles | Medium term (3-4 years) |
| Product innovation in terms of raw material and design | +0.7% | National, with early adoption in innovation centers | Long term (≥ 5 years) |
| Rising number of high net worth individuals | +0.6% | National, with concentration in financial centers and tech hubs | Medium term (3-4 years) |
| Digital-first luxury purchases by gen Z and millennials | +0.5% | National, with higher adoption in tech-forward metropolitan areas | Short term (≤ 2 years) |
| Source: Mordor Intelligence | |||
Consumer emphasis on sustainability
Environmental responsibility has become a fundamental business requirement in the US luxury market. Luxury brands are adopting circular economy practices, with companies like Stella McCartney incorporating deadstock fabrics and recycled materials in their high-quality collections to reduce environmental impact. This approach demonstrates the industry's commitment to sustainable practices while maintaining premium quality standards. Moreover, a Stifel survey from October 2023 indicated that 22% of Generation Z and 20% of Millennial consumers in the United States make purchases exclusively from brands demonstrating sustainability practices or value alignment [1]. This purchasing pattern has impacted the U.S. luxury goods market, prompting luxury brands to allocate resources toward ethical sourcing, environmentally friendly materials, and supply chain transparency in order to maintain their market position. For instance, in December 2024, Rolex introduced sustainable packaging for its watches, utilizing plywood and recycled cardboard materials, demonstrating how luxury brands can maintain their premium positioning while embracing environmental stewardship.
Influence of social media and celebrity endorsement
In 2024, Chanel teamed up with Hailey Bieber, while Louis Vuitton featured Zendaya in a 2025 campaign. Both collaborations, launched just 72 hours apart, saw a surge in search intent and conversions, each boasting double-digit percentage increases. In 2024, Swiss watchmakers, who had long relied on print media and sponsorships, made a strategic shift. They turned to TikTok and partnered with creators, leading to limited-edition drops. Collaborations with platforms like Hodinkee resulted in these exclusive items selling out in mere minutes. The influence of social proof on perceived scarcity is undeniable: when a celebrity dons a piece, prices for similar items in the secondary market can jump by 20 to 30 percent. Brands, keenly aware of this dynamic, strategically time their product releases to coincide with red-carpet events and award shows. The 0.3 percentage-point CAGR uplift is notably seen in short-cycle categories, fragrances, cosmetics, and small leather goods, where impulse buying is prevalent, and digital attribution is most accurate.
Increasing strategic investment and initiatives propelling the market
In a bold move, LVMH has pledged over USD 200 million to acquire and revamp Rodeo Drive sites, setting the stage for flagship stores of Tiffany and Louis Vuitton in 2024 and 2025. This investment underscores LVMH's belief in the enduring power of physical retail for brand storytelling and securing high-value sales. Meanwhile, Richemont, with a keen eye on the U.S. market, allocated EUR 865 million (approximately USD 945 million) to retail and manufacturing capital expenditures in fiscal 2024. This move underscores the company's strategic focus on strengthening its domestic infrastructure. In a bid to enhance online order deliveries, Tapestry inaugurated a fulfillment center in Las Vegas in 2024. This initiative not only slashed last-mile costs by 12 percent but also boosted customer satisfaction ratings. Dior, in a strategic move to amplify foot traffic, unveiled its expansive 47,900-square-foot flagship in Beverly Hills in November 2025. Designed by the renowned Peter Marino, the flagship boasts a Monsieur Dior restaurant and exclusive VIP suites, positioning it as a prime destination. The 0.2 percentage-point CAGR contribution is a testament to the dual benefits of new locations: direct revenue and the 'halo effect', where heightened brand visibility in major cities amplifies desirability in secondary markets, drawing consumers eager for flagship experiences.
Product innovation in terms of raw material and design
Product innovation serves as a key differentiator in the US luxury market, as brands utilize advanced materials and design techniques to support premium pricing and appeal to environmentally conscious consumers. Luxury fashion brands are incorporating eco-friendly materials, including mycelium-based leather and organic cotton. This shift toward sustainable materials reflects a broader industry transformation, where environmental responsibility meets luxury craftsmanship. For instance, in October 2023, sustainable luxury footwear brand Koio launched 99% biodegradable shoes. Koio offers a growing collection of carbon-neutral shoes, which are made using leathers from regenerative farms in the Swiss Alps. Moreover, the trend extends beyond materials to product functionality, particularly in the beauty segment, where multi-purpose products are gaining traction as consumers seek value amid increasing living costs. Beauty brands are developing innovative formulations that combine skincare, makeup, and protection benefits in single products. This approach resonates with consumers looking to streamline their routines while maintaining luxury experiences. The convergence of sustainability and functionality in luxury products demonstrates the market's evolution in meeting changing consumer demands while maintaining premium positioning.
Restraints Impact Analysis*
| Restraint | (~) % Impact on CAGR Forecast | Geographic Relevance | Impact Timeline |
|---|---|---|---|
| Availability of counterfeit products | -0.3% | National, with higher impact in major urban centers | Medium term (3-4 years) |
| Lesser demand from price sensitive consumers | -0.5% | National, with stronger effect in regions with lower disposable income | Short term (≤ 2 years) |
| Escalating rents on prime retail locations | -0.4% | Concentrated in major luxury retail corridors in New York, Los Angeles, and Miami | Medium term (3-4 years) |
| Higher prices and limited accessibility | -0.6% | National, with greater impact on aspirational luxury consumers | Short term (≤ 2 years) |
| Source: Mordor Intelligence | |||
Availability of counterfeit products
In fiscal 2024, U.S. Customs and Border Protection (CBP) seized goods with a manufacturer's suggested retail price (MSRP) of USD 5.4 billion, marking a staggering 93% surge from the USD 2.8 billion seized in fiscal 2023. Notably, jewelry constituted a significant portion at USD 1.65 billion, followed closely by watches at USD 1.44 billion, and handbags at USD 1.09 billion. According to CBP, a staggering 90% of the seized counterfeit items, by quantity, originated from China and Hong Kong[2]. These regions adeptly exploited express-consignment and de-minimis shipment channels, successfully evading traditional cargo screenings. In January 2025, Louisville CBP officers underscored the magnitude of the illicit trade by seizing 28 shipments of counterfeit jewelry, collectively valued at an MSRP of USD 27.5 million. This highlights the scale of counterfeit operations flowing through regional hubs. Further emphasizing the trend, Buffalo Port intercepted 14 counterfeit Rolex watches in July 2025, with a combined value of USD 257,000, spotlighting the allure of high-value items to organized crime networks. The -0.35 percentage-point CAGR drag on the market can be attributed to revenue leakage. Consumers, often unaware, purchase counterfeits either online or through third-party marketplaces, inadvertently diminishing legitimate sales. Moreover, brand dilution occurs as these subpar fakes tarnish the perceived exclusivity of genuine products.
Lesser demand from price-sensitive consumers
In 2024, inflation-adjusted discretionary spending fell by 2.3%, putting pressure on middle-income households. These households have traditionally turned to accessible-luxury brands like Coach and Kate Spade during special moments, according to the U.S. Bureau of Economic Analysis. Tapestry's Kate Spade brand saw a 10% revenue drop in the second quarter of fiscal 2025. This decline was attributed to waning foot traffic in outlet malls and a sense of promotional fatigue among its core customers. Burberry, in 2024, issued a profit warning, pointing to a 15% sales drop in the Americas. The luxury brand noted that price-sensitive shoppers were either postponing purchases or opting for fast-fashion alternatives. Data from the National Retail Federation highlighted a shift in consumer behavior: 18% more shoppers postponed luxury buys in 2024 than in 2023. Many are now prioritizing essential needs and debt repayment over luxury splurges. The impact of a -0.25 percentage-point CAGR is felt most strongly in non-gateway markets. Here, the absence of flagship experiences means brand equity hinges on wholesale distribution. However, this distribution lacks the service differentiation needed to justify premium pricing.
*Our forecasts treat driver/restraint impacts as directional, not additive. The impact forecasts reflect baseline growth, mix effects, and variable interactions.
Segment Analysis
By Product Type: Leather Goods Outpace Apparel Growth
In 2025, the clothing and apparel sector captured 32.29% of the market share, driven by a fusion of casual wear and athleisure that combines luxury with performance. Meanwhile, leather goods, bags, and small leather accessories are on a growth trajectory, expanding at an annual rate of 2.76% through 2031, marking the fastest pace among product categories. Handbags, with their higher average unit retail and frequent repeat purchases, outpace ready-to-wear items. Tapestry's Coach brand celebrated mid-teens average unit retail gains in fiscal 2025, as consumers gravitated towards its signature leather lines. In contrast, Kate Spade faced a 10 percent revenue dip, attributed to its reliance on promotions in the nylon and canvas segments. Jewelry and watches command a notable market presence, underscored by Chopard's Alpine Eagle TimeForArt 2024 edition and Rolex's Land-Dweller 2025, boasting 32 new patents, a testament to how innovation bolsters pricing power. The beauty and personal care sector, spanning fragrances, cosmetics, and skincare, witnessed mid-single-digit growth in 2024 and 2025. This uptick was largely fueled by Estée Lauder's Balmain Beauty debut in August 2024 and Jo Malone's AI Scent Advisor launch in December 2025, both of which curbed return rates and enhanced conversions.
Footwear and eyewear, while holding smaller market shares, showcase unique trends. Tapestry's February 2025 divestiture of Stuart Weitzman for USD 105 million underscores the challenges faced by footwear brands without vertical integration, especially when pitted against conglomerate-backed competitors. Eyewear enjoys the advantage of prescription-driven repeat purchases and licensing deals, enabling brands to profit from their intellectual property without the burden of inventory. However, online disruptors like Warby Parker have introduced margin pressures. Home décor and luxury items cater to a niche audience, primarily ultra-high-net-worth individuals with multiple residences. In 2024, charm bracelets surged in popularity, with Lyst noting a 150 percent spike in search volumes. Dior, capitalizing on the trend, reported a staggering 750 percent increase in charm-related queries, highlighting the potent influence of social media in driving fleeting demand surges.

By End User: Men's Luxury Closes the Gender Gap
In 2025, women accounted for 54.84% of end-user demand, underscoring the historical female skew in categories such as handbags, jewelry, cosmetics, and apparel. However, men's luxury is on the rise, expanding at an annual rate of 3.07% through 2031, outpacing the overall market. This growth is fueled by heightened interest in grooming, athleisure, and tailored casualwear, which command higher average retail prices. Ralph Lauren's Modern Sportswear line, with prices ranging from USD 79.50 for Henley shirts to USD 898 for doeskin blazers, showcases how brands strategically position price points to appeal to both aspirational and affluent male consumers. Meanwhile, Rolex's Land-Dweller 2025 and Patek Philippe's limited-edition releases cater to male collectors who view mechanical watches as a symbol of portable wealth. This segment experienced a 12% growth in 2024, driven by financial market volatility and heightened demand for alternative assets. In the first quarter of fiscal 2026, Tapestry welcomed over 2.2 million new customers globally, with about 35% being Gen Z[3]. Notably, a significant portion of these new male buyers gravitated towards Coach's leather accessories and sneakers.
While unisex offerings remain modest in scale, they play a pivotal role in brand-building, signaling inclusivity and cultural relevance. Moncler's October 2024 collaboration with Rick Owens, featuring gender-neutral silhouettes, sold out in just 48 hours, underscoring the commercial potential of non-binary design. Historically, men's grooming and fragrance lagged behind women's beauty, but the gap is narrowing. Brands like Dior and Tom Ford are launching premium-priced dedicated lines, while Jo Malone's December 2025 introduction of the AI Scent Advisor tailors recommendations for male users, demystifying fragrance counters for those previously hesitant. The 3.07% CAGR for men's luxury is attributed to the expansion of categories like tailored casualwear, sneakers, and tech accessories entering the luxury realm, alongside demographic shifts. Millennial and Gen Z men are now dedicating a larger portion of their discretionary spending to personal appearance than earlier generations.
By Distribution Channel: Online Gains Share from Physical Retail
In 2025, single-brand stores accounted for 41.44% of the distribution landscape, utilizing immersive environments and exclusive product offerings to justify their premium pricing. However, online channels, propelled by Gen Z and millennial shoppers, are on a growth trajectory, advancing at an annual rate of 3.58% through 2031. Dior's flagship store in Beverly Hills, spanning 47,900 square feet and inaugurated in November 2025, boasts a Monsieur Dior restaurant and private VIP suites, elevating the venue to a hotspot for foot traffic and social media buzz. In October 2025, Hermès unveiled a new U.S. store, curating exclusive product allocations for high-net-worth individuals that aren't available through wholesale or online channels, highlighting the strategic importance of controlled distribution. Meanwhile, multi-brand outlets, including department giants like Saks and Neiman Marcus, grapple with structural challenges. Despite Saks Global's ambitious USD 2.7 billion takeover of Neiman Marcus in 2024, aimed at consolidating buying power and trimming redundant overheads, both chains sounded alarms of financial distress in December 2025, citing dwindling foot traffic and squeezed wholesale margins.
Tapestry reported a robust high-teens percentage surge in digital revenue for fiscal 2025, with Coach's handbag lineup playing a pivotal role, bolstered by dynamic pricing and tailored recommendations. Estée Lauder's foray into Amazon's Premium Beauty store in October 2024, featuring virtual try-ons and same-day delivery in select metros, is successfully siphoning customers from traditional department-store counters, which can't match that level of convenience. Ralph Lauren, during its Investor Day 2025, unveiled ambitions to amplify a digitally-centric ecosystem across the top 30 U.S. cities. They recognized that existing geographic voids limit growth potential and emphasized the importance of omnichannel strategies, such as 'buy online, pick up in store' and virtual appointments, to seamlessly merge the physical and digital realms. The projected 3.58% CAGR for online platforms is a testament to evolving customer preferences for 24/7 access, diverse product assortments, and smooth checkouts, coupled with operational efficiencies stemming from scaling fulfillment costs and maturing last-mile networks.
Geography Analysis
In fiscal 2024, Richemont identified the U.S. as its leading revenue source, underscoring the nation's significance as the primary market for many European luxury giants. The conglomerate further solidified its commitment by allocating approximately USD 945 million to retail and manufacturing capital expenditures, thereby bolstering its domestic infrastructure. Los Angeles is eclipsing New York City as the favored site for inaugural U.S. outlets, spurred by the 2028 Olympics and lower occupancy rates than on Fifth Avenue. LVMH's strategic investment of over USD 200 million to acquire and revamp Rodeo Drive sites for Tiffany and Louis Vuitton flagship stores in 2024 and 2025 highlights this westward momentum. Despite Beverly Hills rents soaring to USD 960-1,200 per square foot in 2025, brands deem the locale vital for narrative-building and high-value sales. Esteemed names like Givenchy, Cartier, Patek Philippe, and Rolex are either expanding or renovating their stores on Rodeo Drive. Savills' Global Luxury Retail 2024 report highlighted a 12 percent uptick in North American store openings compared to 2022, with cities in the Sun Belt, including Miami, Dallas, and Phoenix, reaping the lion's share, thanks to an influx of affluent retirees and remote workers from high-tax states.
While New York City holds its symbolic stature, foot traffic in its flagship areas dipped by 8% in 2024. This decline, attributed to organized retail crime and shifts in remote work, diminished both tourist and commuter presence, as reported by the National Retail Federation. Rents on Fifth Avenue surged by 12 percent year-over-year in 2024. In response, brands like Saks consolidated their operations, shuttering underperforming outlets. Meanwhile, Target ventured into SoHo in 2024, experimenting with urban-format stores. This move underscores New York's status as a testing ground for omnichannel retailing, even among mass-market players. Miami's Design District has solidified its position as a luxury nexus. Flagship stores from Hermès, Louis Vuitton, and Dior cater not only to Latin American tourists but also to domestic clientele enticed by Florida's tax benefits. Las Vegas, long synonymous with outlet shopping, is now embracing full-price luxury. Tapestry, in a bid to enhance online order deliveries, inaugurated a fulfillment center in 2024, achieving a 12 percent reduction in last-mile costs.
Residents in mid-tier cities like Phoenix, Charlotte, and Nashville find themselves without flagship stores from most European luxury brands. This absence compels them to either journey to major metropolitan areas or shop online, often missing the in-person experience and consequently seeing a 25 to 30% dip in conversion rates. Ralph Lauren, during its Investor Day 2025, spotlighted this market gap. The brand unveiled a three-year blueprint to cultivate a digitally-driven ecosystem across the top 30 U.S. cities, with plans to explore an additional 20, harnessing data analytics to pinpoint promising markets. Despite gateway metros, which account for 65% of luxury revenue, housing only 25% of the affluent populace, presenting lucrative opportunities in secondary markets, challenges like high occupancy costs and intricate logistics dampen the enthusiasm for many brands.
Regulatory Landscape
The United States luxury goods market operates under a fragmented regulatory environment spanning the FTC (advertising and labeling claims), FDA (cosmetics oversight), and U.S. Customs and Border Protection (CBP) for import enforcement and anti-counterfeiting. CBP data highlights the intensity of IP enforcement at the border, with fiscal 2024 seizures of counterfeit goods reported at an MSRP of USD 5.4 billion, up sharply year over year, and with jewelry, watches, and handbags among the largest categories. Online channels also face tighter rules through marketplace seller-verification requirements under the INFORM Consumers Act, which increases compliance expectations for luxury brands and resale platforms that rely on third-party sellers.
Compliance obligations are rising most visibly in beauty and in origin claims. The Modernization of Cosmetics Regulation Act (MoCRA) expands FDA requirements around facility registration, product listing, and adverse-event reporting, favoring scaled operators with established regulatory and quality systems. Separately, Made in USA marketing is an active enforcement area under the FTC, with legal and compliance focus on substantiation of domestic-origin claims, particularly as brands evaluate supply-chain localization and pricing actions amid trade and tariff dynamics.
Competitive Landscape
The U.S. luxury goods market is moderately concentrated, with major players such as LVMH, Kering, Richemont, Chanel, and Hermès dominating it. This concentration leaves opportunities for accessible-luxury brands like Tapestry and mid-tier specialists, who are leveraging omnichannel strategies and data-driven planning to carve out their share. Kering faced a 15% revenue dip in Q3 2024, with Gucci plummeting 26%. This downturn underscores the risks of brand fatigue and the consequences of delayed creative updates, even in a burgeoning market. In contrast, Tapestry's Coach brand thrived, boasting double-digit revenue growth in fiscal 2025 by appealing to Gen Z and millennials with its leather accessories and sneakers.
Strategic maneuvers are evident: LVMH bolsters its retail presence with acquisitions on Rodeo Drive, while Richemont's EUR 265 million (around USD 290 million) buyout of Gianvito Rossi in fiscal 2024 underscores a push for tighter control over supply chains and retail spaces. Digital initiatives are also a focus, as seen with Estée Lauder's Amazon Premium Beauty store and Ralph Lauren's digital ecosystem strategy, both aimed at countering direct-to-consumer threats. There's untapped potential in men's grooming, lagging 40 percentage points behind women's beauty in market penetration, and in home décor. The latter, while appealing to ultra-high-net-worth individuals with multiple residences, remains largely overlooked by many fashion brands.
New entrants are capitalizing on sustainability and transparency: In July 2024, Uncaged Innovations secured USD 5.6 million in seed funding to expand its plant-based leather alternatives, posing a challenge to traditional tanneries supplying European giants. Adoption of technology is inconsistent across the board; Rolex's 32 patents for the Land-Dweller 2025 highlight how mechanical advancements can bolster pricing power. Meanwhile, Jo Malone's AI Scent Advisor and Estée Lauder's virtual foundation tool showcase the potential of digital innovations, not as replacements, but as enhancements to traditional in-person services by reducing return rates and boosting conversions. New regulations, like the FDA's 2024 Modernization of Cosmetics Regulation Act, mandate registration and adverse-event reporting. Such requirements tend to benefit larger entities with established compliance infrastructures, inadvertently sidelining smaller indie brands and further consolidating market share among industry stalwarts.
United States Luxury Goods Industry Leaders
-
LVMH Moët Hennessy Louis Vuitton
-
Kering SA
-
Compagnie Financière Richemont SA
-
Chanel Limited
-
Hermès International SA
- *Disclaimer: Major Players sorted in no particular order
Market Opportunities and Future Outlook
Tariff and trade-cost uncertainty is creating room for brands that can adjust sourcing, manufacturing, and routing while maintaining luxury positioning. Reuters has highlighted that LVMH already operates manufacturing sites in California and Texas, giving it an operational lever that can partially buffer US exposure compared with fully import-reliant peers. This backdrop supports opportunities tied to selective localization (or nearshoring) of repair, personalization, small leather goods assembly, and other controllable activities where speed-to-market and authenticity assurances matter, without requiring a full shift of iconic production away from Europe.
A second opportunity is emerging where digital commerce, anti-counterfeiting, and compliant marketplace growth intersect. With CBP reporting elevated counterfeit seizures and the INFORM Consumers Act tightening seller verification for high-volume marketplace merchants, brands and authorized partners can push authenticated resale, serialized product records, and tighter distribution control, especially in high-risk categories such as watches, jewelry, and handbags. Investment patterns already visible in the market, including flagship-led storytelling in gateway metros and brands using stores as omnichannel service and fulfillment nodes, also support expansion into underserved US cities through controlled DTC models (appointments, clienteling, and ship-from-store) while maintaining price integrity and service standards.
Recent Industry Developments
- July 2026: L’Oréal announced an exclusive 50-year worldwide license with Kering for Gucci, effective July 1, 2027. The deal reshapes the premium beauty licensing landscape and aligns a leading cosmetics player with a marquee fashion house. It also strengthens direct-to-consumer control over a marquee brand and accelerates portfolio consolidation in luxury cosmetics.
- July 2026: Hermès reopened a relocated store at the Westfield UTC mall in San Diego. The US flagship expansion places the brand in a high-profile gateway market and broadens its retail reach. It supports direct-to-client footprint expansion and reinforces brand experience and pricing power in key market areas.
- June 2026: Richemont reported a strong start to the year with sales up by constant currencies for the first quarter ended 30 June 2026. The result indicates resilient consumer demand in the luxury segment and supports strategic confidence. It also backs continued investment in owned retail and multi-brand distribution strategies, with implications for pricing power and category mix.
Research Methodology Framework and Report Scope
Market Definition and Coverage
For this report, the United States luxury goods market is defined as consumer spending on premium, brand-led personal goods sold through retail and digital channels within the country, measured in value terms in USD.
Scope exclusions: We exclude luxury vehicles, yachts, private aviation, hospitality, and real estate to keep the market tied to personal goods demand.
Segmentation Overview
- By Product Type
- Clothing and Apparel
- Footwear
- Leather Goods (Bags and Small Leather Accessories)
- Jewelry
- Watches
- Beauty and Personal Care (Fragrances, Cosmetics, Skincare)
- Eyewear
- Home Décor and Fine Living Items
- By End User
- Women
- Men
- Unisex
- By Distribution Channel
- Single Brand Stores
- Multi-Brand Stores
- Online Stores
Data Sources, Market Sizing, and Validation
Desk Research
Desk research starts with mapping the addressable luxury demand pool in the United States and then linking it to observable category signals. We rely on public sources such as the US Census Bureau retail trade datasets, Bureau of Economic Analysis consumption series, Bureau of Labor Statistics CPI components for apparel and personal care, and US International Trade Commission import and tariff data for relevant HS codes.
To keep the inputs grounded, we also review materials from trade and industry bodies such as the World Jewelry Confederation (CIBJO) and the Gemological Institute of America, along with peer reviewed work on premium consumption and counterfeiting impacts. For company context, we use annual reports, 10-Ks, investor presentations, and credible press coverage, and then a paid company financials and news database is used to fill gaps on brand-level US exposure where disclosures are limited. The sources listed here are illustrative, and additional public datasets and documents were also reviewed for data collection, validation, and clarification.
Primary Interviews and Surveys
Primary work is used to pressure test the market boundaries and the pricing and volume assumptions behind each category. We speak with a mix of brand-side leaders, retail and distribution managers, and category specialists across major US demand centers, and then reconcile their inputs with desk findings so the final sizing stays consistent and explainable.
Distribution of primary research fieldwork respondents
| Company type | Respondent position |
|---|---|
| Top tier: 31% | CXOs: 17% |
| Mid tier: 48% | Functional/Unit leaders: 40% |
| Smaller Players: 21% | Managers: 43% |
Market-Sizing & Forecasting
Market sizing is built using a top-down and bottom-up cross-check approach, where consumer spend and trade-linked category flows reconstruct the demand pool, and then selective supplier and channel checks are used to validate totals. In practice, we start from US personal consumption and retail signals, and then allocate shares to luxury-relevant categories based on observed penetration and price positioning.
Key model inputs include category level price trends (using CPI proxies where suitable), import reliance for luxury items (for example jewelry and watches), store footprint and online mix shifts, tourist versus resident buying patterns in gateway cities, and the cadence of brand-led price increases. These variables matter because they help separate value growth driven by pricing from growth driven by unit movement and mix into higher-ticket items.
For forecasting, scenario analysis is used around pricing cadence and discretionary income sensitivity, and then the year-by-year path is smoothed using simple time-series checks so the trajectory does not jump without a clear driver. Where direct volumes are not consistently observable, gaps are handled by using proxy indicators like category imports, retailer count trends, and price index movements, which are then reconciled back to primary feedback.
Data Validation & Update Cycle
Validation is done through triangulation across independent signals, and then any unusual variance is investigated before results are locked. We compare totals against category import movements, price index direction, and visible retail expansion signals, and then re-check assumptions when the model deviates from these indicators.
A second analyst review is built into the workflow so key inputs and calculations are re-tested, followed by re-contact triggers when primary respondents flag a meaningful shift in pricing, demand, or channel mix. The report is refreshed annually, and interim updates are made when material events change demand conditions, and then a final pre-delivery pass is completed so clients receive the latest view.
Mordor Intelligence's United States Luxury Goods Market Size Compared With Other Published Estimates
Published market sizes can differ even when everyone is talking about luxury goods, because the category boundaries are not consistent and the pricing logic is not always shown. Differences usually show up around what product groups get counted, whether resale and experiences are included, and which year is used as the anchor for USD conversion.
By tracking price index movements, import-linked category signals, and channel mix shifts, Mordor Intelligence keeps the sizing limited to personal luxury goods sold to consumers in the United States, which prevents items like luxury travel, autos, and real estate from being mixed into the total.
Benchmark comparison
| Source | Market Size | Gaps in Research Methodology |
|---|---|---|
| Mordor Intelligence | USD 112.68 B (2025) | |
| Industry Association A | USD 105.20 B (2025) | Often narrows the counted categories to core hard luxury and designer apparel, and it can exclude prestige cosmetics and eyewear, which lowers the reported total. |
| Trade Journal B | USD 128.90 B (2025) | May add resale activity and luxury experiences, and it can apply aggressive average selling price uplift assumptions without clearly separating US-only sales from global brand revenue. |
The table shows that most of the spread comes from what is included in the market and from how pricing and mix are carried forward year to year. When the totals are checked against repeatable demand signals and kept tied to personal goods, the estimate remains easy to explain and update consistently.
Key Questions Answered in the Report
How large is the United States luxury goods market today?
It generated USD 115.58 billion in 2026 and is forecast to rise to USD 131.34 billion by 2031 at a 2.59% CAGR.
Which product segment is growing fastest?
Leather goods are pacing at a 2.76% CAGR through 2031, outstripping apparel.
Why is men’s luxury important?
Men’s categories grow at a 3.07% CAGR, faster than the overall market, driven by grooming, sneakers, and tech-infused apparel.
How big is the counterfeit problem?
CBP seized USD 5.4 billion worth of fake luxury items in fiscal 2024, up 93% year over year.
What share did single-brand stores hold in 2025, and how fast are online sales growing?
Single-brand stores held 41.44% of sales in 2025, and online store sales are expanding at 3.58% annually through 2031.