| Study Period | 2017 - 2030 |
| Base Year For Estimation | 2024 |
| Forecast Data Period | 2025 - 2030 |
| Market Size (2025) | USD 114 Billion |
| Market Size (2030) | USD 139.6 Billion |
| CAGR (2025 - 2030) | 4.13 % |
| Market Concentration | Low |
Major Players*Disclaimer: Major Players sorted in no particular order |
 Market Size")
United States Less than-Truck-Load (LTL) Market Analysis
The United States Less than-Truck-Load (LTL) Market size is estimated at 114 billion USD in 2025, and is expected to reach 139.6 billion USD by 2030, growing at a CAGR of 4.13% during the forecast period (2025-2030).
The U.S. LTL market is experiencing significant transformation driven by substantial infrastructure investments and modernization initiatives. In March 2024, the U.S. Department of Transportation's Maritime Administration announced USD 450 million in funding through the Port Infrastructure Development Program to modernize coastal and inland ports, strengthen supply chains, and improve economic security. Additionally, the Federal Aviation Administration revealed a USD 110 million investment from the Bipartisan Infrastructure Law to enhance over 70 U.S. airports, with USD 43 million specifically allocated for Charlotte Douglas International Airport's taxiway construction. These investments demonstrate the government's commitment to developing robust transportation infrastructure that supports efficient freight transportation.
Cross-border trade dynamics are reshaping the LTL industry, with notable shifts in international trade patterns. Mexico has surpassed China as the largest exporter of goods to the United States, with Mexican exports reaching USD 475.6 billion in 2023, marking a 5% increase from 2022. This shift has prompted carriers to enhance their cross-border capabilities, as evidenced by XPO's expansion of its U.S.-Mexico service through XPO Mexico+ in July 2024, which now covers 99% of postal codes in Mexico. The evolving trade patterns are driving carriers to adapt their networks and service offerings to meet changing customer demands in the less than truckload sector.
The industry is witnessing significant regulatory changes and sustainability initiatives that are reshaping operational practices. Federal regulators have postponed several trucking regulations, including the speed limiter rule for trucks over 26,000 pounds, which has been delayed to May 2025. This regulatory adjustment provides carriers additional time to prepare for compliance while maintaining operational efficiency. In June 2024, gas prices demonstrated an unusual trend, falling to USD 3.44 per gallon during the peak summer season, providing temporary relief to carriers' operational costs in the ground transportation sector.
Technological advancement and operational efficiency improvements are becoming increasingly crucial in the LTL sector. In June 2024, Norwegian solar company NorSun announced a USD 620 million investment in Tulsa, Oklahoma, for its first U.S. manufacturing plant, highlighting the growing emphasis on domestic manufacturing capabilities and sustainable technologies. The industry is also witnessing increased adoption of automation and digital solutions, with carriers investing in advanced tracking systems, automated dock operations, and real-time visibility solutions to enhance service reliability and customer experience. These technological investments are crucial for maintaining competitiveness and meeting evolving customer expectations in the digital age, thereby influencing the LTL market size.
United States Less than-Truck-Load (LTL) Market Trends
United States leads regional GDP with 86% contribution, driven by infrastructure and supply chain investments
- In September 2024, the FAA, under the US Department of Transportation, allocated USD 1.9 billion in grants for 519 projects. These projects span 48 states, Guam, Puerto Rico, and other territories, all part of the Airport Improvement Program (AIP). Additionally, USD 269 million in Supplemental Discretionary Grants for 2023 will back 62 projects at 56 U.S. airports. This competitive initiative aids airport owners and operators in enhancing the U.S. airport system. Marking its largest round yet, this fifth AIP grant cycle funds diverse projects, from airport safety and sustainability upgrades to noise reduction. The grants cater to airports nationwide, regardless of size.
- With infrastructure development and the e-commerce boom, the transportation and storage sector is set for a job surge. The Bureau of Labor Statistics (BLS) projects a 0.8% annual growth rate from 2022 to 2032, translating to nearly 570,000 new jobs. Notably, the couriers and messengers industry, alongside warehousing and storage, is expected to drive about 80% of this job growth.
,-Share---Of-GDP,-United-States,-2017---2023.svg)
Understand The Key Trends Shaping This Market
Download PDF
The United States remained a net crude oil importer in 2022, importing about 6.28 million bpd of crude oil from 80 countries
- Gasoline prices in the US are expected to drop below USD 3 a gallon for the first time in over three years by October 2024, just before the presidential election. Lower fuel prices are mainly due to weaker demand and falling oil prices, providing relief to consumers who have faced high costs that fueled inflation. This could also help Vice President Kamala Harris and other Democrats counter Republican criticism over high gas prices. In September 2024, the average price for regular gas was USD 3.25 a gallon, down 19 cents from last month and 58 cents from last year.
- According to US Energy Information Administration (EIA), crude oil prices will stay steady in 2024 compared to 2023, then decrease in 2025. The US' introduction of new refining capacities in 2023 will boost its operable capacity, alleviating price strain on oil products in 2024 and 2025. Furthermore, the Middle East, particularly Kuwait, will add new international refining capacities, which will help ease global price pressure on gasoline and diesel. Also, it is expected, narrowing crack spreads in 2024 are likely to lead to lower average US retail fuel prices in both 2024 and 2025. Gasoline prices are projected to USD 3.36/gal in 2024 and USD 3.24/gal in 2025.

OTHER KEY INDUSTRY TRENDS COVERED IN THE REPORT
- Retail sales in the United States expanded by 3.2% YoY in 2023 supported by consumer spending
- The number of e-commerce users in the United States is expected to reach 333 million by 2029 from 273 million in 2024
- United States leads regional GDP with 86% contribution, driven by infrastructure and supply chain investments
- Road infrastructure investments under the Bipartisan Infrastructure Law (2022-2026) focus on repairing existing roads and launching new road projects
- US imports from Mexico reached USD 475.6 billion in 2023, up 5% from 2022
- Over 12,000 medium- and heavy-duty electric trucks were put into service across the US between 2019 and 2023
- Investment in infrastructure worth USD 550 billion by 2026, to boost road freight volumes in the United States
- Rising government efforts to support land (road and rail) mode of transport, with rising infrastructure investments
- US oil production stabilizes at 13.2 million barrels per day, while major companies pursue mergers for Permian Basin output
- Small- and medium-sized manufacturers (SMMs) comprise 98% of the US manufacturing firms as of 2023
- US boosts highway investment by 55% to improve infrastructure, targeting supply chain efficiency by 2026
- The United States is projected to become the world's fifth-largest rice exporter, with 3.1 million tons by 2031-32
- The trucking industry is expected to recruit nearly 1.2 million drivers over the next ten years to replace drivers leaving
- New commercial truck sales declined in Q2 2024, due to drop in Class 8 truck sales
- Growing exports and imports of petroleum, along with growing truck driver wages, are driving road freight pricing in the US despite a decline in fuel price
- Residue impact of economic shutdown on global supply chains led to an increase in food and energy prices
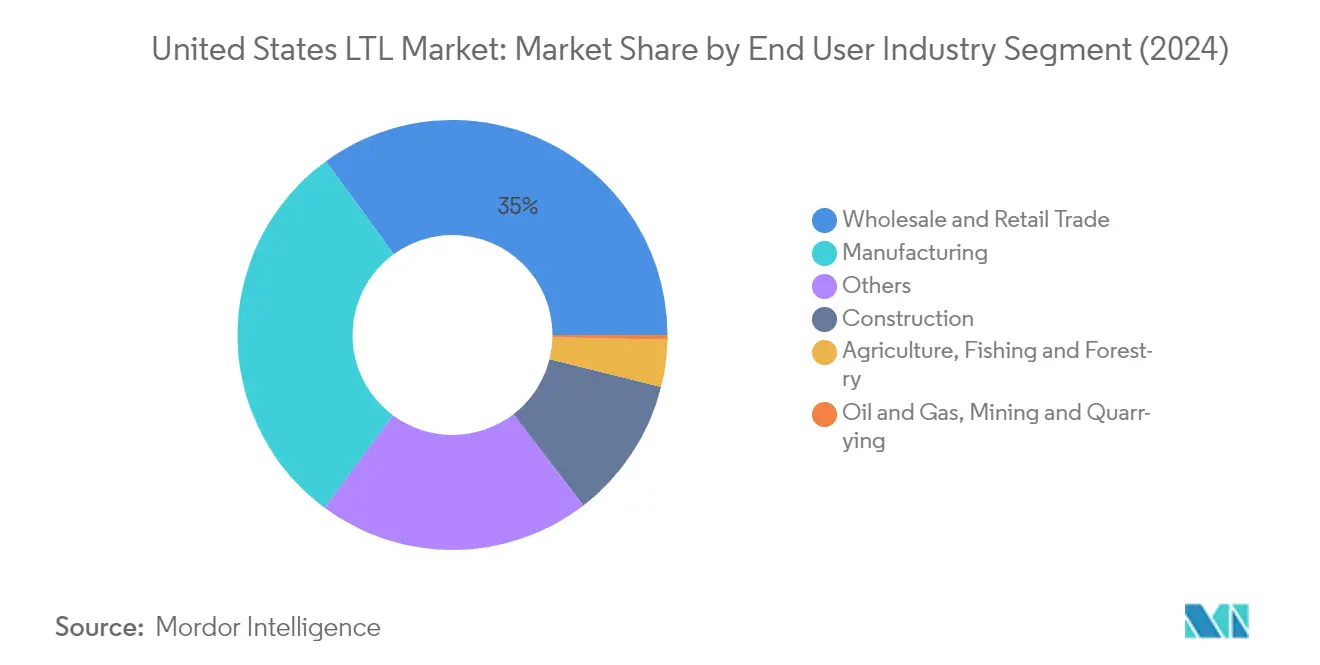
Segment Analysis: End User Industry
Wholesale and Retail Trade Segment in United States LTL Market
The Wholesale and Retail Trade segment dominates the United States Less-than-Truckload (LTL) market, commanding approximately 35% market share in 2024. It is also the fastest-growing segment, with a projected growth rate of around 5% during 2024-2029. This segment's prominence is largely driven by the robust growth in e-commerce, with the sector experiencing a 14% year-over-year growth in 2023. The continued penetration of e-commerce into the retail sector, despite economic uncertainties, has been particularly notable, with holiday shopping and online deals contributing significantly to this growth. Major developments in the segment include TikTok Shop's launch in the US in September 2023, which has introduced seamless product purchasing through creator content. Furthermore, the segment's growth is supported by projections indicating that total retail sales in the United States will reach USD 7.9 trillion by 2026, while the number of online buyers is expected to grow to 291.2 million by 2025, representing about 80.4% of the total population.
Remaining Segments in End User Industry
The manufacturing segment represents the second-largest portion of the market, benefiting from significant developments such as NorSun's USD 620 million investment in its first U.S. manufacturing plant in Tulsa, Oklahoma. The construction segment has been bolstered by substantial infrastructure investments, including the FAA's USD 110 million investment from the Bipartisan Infrastructure Law. The agriculture, fishing, and forestry segment has seen growth through government initiatives like the USD 110 million investment in meat and poultry processing. The oil and gas, mining, and quarrying segment maintains its presence in the market, supported by developments such as Chevron's operations at Jack/St. Malo and Tahiti facilities. The "Others" segment encompasses various industries, including environmental services and waste management, with notable developments like Clean Harbors' acquisition of HEPACO for USD 400 million.
Segment Analysis: Destination
Domestic Segment in United States Less-than-Truckload (LTL) Market
The domestic segment continues to dominate the United States Less-than-Truckload (LTL) market, commanding approximately 77% of the total market value in 2024. This substantial market share is supported by the segment's robust infrastructure network, comprising over 900 new dock doors nationally by Q1 2024. The segment's strength is further reinforced by major players like XPO Logistics, which reported EBITDA of more than USD 1 billion in the LTL segment and has been actively expanding its capacity through strategic investments. The domestic segment's dominance is also attributed to the growing e-commerce sector, established infrastructure, and increasing expansion opportunities across the country. Companies are focusing on investing in capacity before demand rises, which helps them gain profitable market share by offering top-quality service to customers.
International Segment in United States Less-than-Truckload (LTL) Market
The international segment is projected to be the fastest-growing segment in the United States Less-than-Truckload (LTL) market, with an expected growth rate of approximately 4% from 2024 to 2029. This growth is primarily driven by increasing cross-border trade activities, particularly with Mexico and Canada. Major developments supporting this growth include XPO's expansion of its cross-border service between the U.S. and Mexico with XPO Mexico+, which now covers 99% of postal codes in Mexico. The segment's growth is further supported by significant cross-border trade volumes, particularly in high-value goods such as computers and electronic parts. The implementation of strategic partnerships and service expansions by major carriers is expected to continue driving this segment's growth trajectory in the coming years.
United States Less than-Truck-Load (LTL) Industry Overview
Top Companies in United States Less-than-Truckload (LTL) Market
Leading companies in the market are focusing on technological innovation and digital transformation to enhance operational efficiency and customer experience. Companies are investing heavily in automation, artificial intelligence, and real-time tracking systems to optimize route planning and improve delivery accuracy. Fleet modernization initiatives, including the adoption of electric and alternative fuel vehicles, demonstrate the industry's commitment to sustainability. Strategic expansion moves include establishing new terminals, service centers, and cross-dock facilities across key geographic locations to strengthen network coverage. Companies are also forming strategic partnerships and collaborations to extend their service reach, particularly in cross-border operations with Canada and Mexico, while simultaneously developing specialized solutions for e-commerce fulfillment and last-mile delivery services. The less-than-truckload companies are thus at the forefront of innovation, driving the market forward.
Market Dominated by Established Regional Players
The US LTL market structure is characterized by a mix of large national carriers and regional specialists, with established players holding significant market share through their extensive networks and infrastructure. The market demonstrates moderate fragmentation, with the top five companies accounting for a substantial portion of the market share, while numerous regional and specialized carriers serve specific geographic areas or industry niches. The competitive landscape is evolving through strategic acquisitions and consolidations, as larger carriers seek to expand their geographic footprint and service capabilities through targeted acquisitions of regional players and technology-focused logistics companies.
The market has witnessed significant merger and acquisition activity, particularly among mid-sized carriers looking to achieve economies of scale and expand their service offerings. These consolidation trends are driven by the need to enhance operational efficiency, expand geographic coverage, and acquire technological capabilities. Companies are increasingly focusing on building comprehensive end-to-end logistics services through strategic acquisitions, particularly in areas such as final-mile delivery and specialized freight handling capabilities, while also investing in digital platforms and automation technologies to remain competitive in an evolving market landscape.
Innovation and Network Optimization Drive Success
Success in the LTL market increasingly depends on companies' ability to leverage technology for operational efficiency while maintaining service quality and coverage. Incumbent players are focusing on expanding their digital capabilities, implementing advanced analytics for pricing optimization, and developing value-added services to maintain their market position. Network density and optimization remain crucial factors, with companies investing in strategic terminal locations and cross-dock facilities to improve service coverage and reduce transit times. The ability to offer specialized services, such as temperature-controlled transportation and handling of hazardous materials, while maintaining cost efficiency, has become a key differentiator in the market.
For contenders looking to gain market share, success factors include developing niche specializations, building a strong regional presence before expanding nationally, and investing in technology infrastructure. Companies must focus on building strong relationships with key customers while maintaining operational flexibility to adapt to changing market conditions. The increasing focus on sustainability and environmental regulations presents both challenges and opportunities, with companies needing to invest in green technologies and sustainable practices to meet evolving customer expectations and regulatory requirements. Additionally, the ability to provide integrated logistics solutions and value-added services while maintaining competitive pricing will be crucial for long-term success in the market. The LTL freight industry is also seeing a rise in freight forwarding services, which are becoming integral to comprehensive less-than-truckload solutions.
United States Less than-Truck-Load (LTL) Market Leaders
-
C.H. Robinson
-
Estes Express Lines
-
FedEx
-
Old Dominion Freight Line
-
XPO, Inc.
- *Disclaimer: Major Players sorted in no particular order
Market/1735919622170-UnitedStatesLessthan-Truck-Load(LTL)Market-market-concentration.svg)
Need More Details on Market Players and Competiters?
Download PDF
United States Less than-Truck-Load (LTL) Market News
- September 2024: FedEx partnered with and invested in Nimble, an AI robotics and autonomous e-commerce fulfillment technology company, to scale FedEx Fulfillment with their fully autonomous 3PL model. FedEx offered a comprehensive approach to help e-commerce and omnichannel brands make faster, smarter supply chain decisions. With more than 130 warehouse and fulfillment operations in North America and 475 million returns processed annually, FedEx Supply Chain helped brands consolidate functions, increase agility, and accelerate click-to-door speed to maximize supply chain value. To support this alliance, FedEx invested in Nimble.
- August 2024: FedEx introduced new digital visibility products, enhancing the experience for shippers and recipients by merging digital solutions with essential data. These paid solutions catered to the rising market demand for advanced data analytics. Businesses harnessed near real-time insights and predictive analytics, refining their customers' post-purchase experience. FedEx also offered paid data integration solutions, granting third-party providers access to shipment tracking information, including the Track API, Track EDI, and new webhook subscriptions, all designed to enhance premium post-purchase tracking and supply chain visibility.
- August 2024: Daylight Transport expanded its service reach, extending from the United States into Canada. The company inaugurated new routes in Eastern Canada, launching its services directly from Texas. This strategic expansion ensured that all shipments benefited from team service and minimal handling, guaranteeing speed, efficiency, and damage-free delivery. Notably, Daylight Transport already provided expedited door-to-door services to Ontario and Quebec, leveraging its Northeast routes from California and successfully reducing transit times by 2-3 days.
Free With This Report
We provide a complimentary and exhaustive set of data points on global and regional metrics that present the fundamental structure of the industry. Presented in the form of 60+ free charts, the section covers difficult to find data on various regions pertaining to e-commerce industry trends, economic contribution of the transportation & storage sector, export and import trends among other key indicators.


United States Less than-Truck-Load (LTL) Market Report - Table of Contents
1. EXECUTIVE SUMMARY & KEY FINDINGS
2. REPORT OFFERS
3. INTRODUCTION
- 3.1 Study Assumptions & Market Definition
- 3.2 Scope of the Study
- 3.3 Research Methodology
4. KEY INDUSTRY TRENDS
- 4.1 GDP Distribution By Economic Activity
- 4.2 GDP Growth By Economic Activity
-
4.3 Economic Performance And Profile
- 4.3.1 Trends in E-Commerce Industry
- 4.3.2 Trends in Manufacturing Industry
- 4.4 Transport And Storage Sector GDP
- 4.5 Logistics Performance
- 4.6 Length Of Roads
- 4.7 Export Trends
- 4.8 Import Trends
- 4.9 Fuel Pricing Trends
- 4.10 Trucking Operational Costs
- 4.11 Trucking Fleet Size By Type
- 4.12 Major Truck Suppliers
- 4.13 Road Freight Tonnage Trends
- 4.14 Road Freight Pricing Trends
- 4.15 Modal Share
- 4.16 Inflation
- 4.17 Regulatory Framework
- 4.18 Value Chain & Distribution Channel Analysis
5. MARKET SEGMENTATION (includes market size in Value in USD, Forecasts up to 2030 and analysis of growth prospects)
-
5.1 End User Industry
- 5.1.1 Agriculture, Fishing, and Forestry
- 5.1.2 Construction
- 5.1.3 Manufacturing
- 5.1.4 Oil and Gas, Mining and Quarrying
- 5.1.5 Wholesale and Retail Trade
- 5.1.6 Others
-
5.2 Destination
- 5.2.1 Domestic
- 5.2.2 International
6. COMPETITIVE LANDSCAPE
- 6.1 Key Strategic Moves
- 6.2 Market Share Analysis
- 6.3 Company Landscape
-
6.4 Company Profiles
- 6.4.1 A. Duie Pyle, Inc.
- 6.4.2 ArcBest
- 6.4.3 Averitt Express, Inc.
- 6.4.4 C.H. Robinson
- 6.4.5 Day & Ross
- 6.4.6 Daylight Transport, LLC
- 6.4.7 Dayton Freight Lines, Inc.
- 6.4.8 DHL Group
- 6.4.9 Estes Express Lines
- 6.4.10 Fastfrate Inc.
- 6.4.11 FedEx
- 6.4.12 Knight-Swift Transportation Holdings Inc.
- 6.4.13 Landstar System Inc.
- 6.4.14 Oak Harbor Freight Lines, Inc.
- 6.4.15 Old Dominion Freight Line
- 6.4.16 Pitt Ohio Transportation Group
- 6.4.17 R+L Carriers, Inc.
- 6.4.18 Roadrunner Freight
- 6.4.19 Saia Inc.
- 6.4.20 Schneider National, Inc.
- 6.4.21 Southeastern Freight Lines
- 6.4.22 TFI International Inc.
- 6.4.23 United Parcel Service of America, Inc. (UPS)
- 6.4.24 Ward Transport and Logistics Corporation
- 6.4.25 Werner Enterprises Inc.
- 6.4.26 XPO, Inc.
- *List Not Exhaustive
7. KEY STRATEGIC QUESTIONS FOR ROAD FREIGHT CEOS
8. APPENDIX
-
8.1 Global Logistics Market Overview
- 8.1.1 Overview
- 8.1.2 Porter’s Five Forces Framework
- 8.1.3 Global Value Chain Analysis
- 8.1.4 Market Dynamics (Market Drivers, Restraints & Opportunities)
- 8.2 Sources & References
- 8.3 List of Tables & Figures
- 8.4 Primary Insights
- 8.5 Data Pack
- 8.6 Glossary of Terms
- 8.7 Currency Exchange Rate
You Can Purchase Parts Of This Report. Check Out Prices For Specific Sections
Get Price Break-up Now
List of Tables & Figures
- Figure 1:
- DISTRIBUTION OF GROSS DOMESTIC PRODUCT (GDP) BY ECONOMIC ACTIVITY, SHARE %, UNITED STATES, 2023
- Figure 2:
- GROWTH OF GROSS DOMESTIC PRODUCT (GDP) BY ECONOMIC ACTIVITY, CAGR %, UNITED STATES, 2017-2023
- Figure 3:
- GROSS MERCHANDISE VALUE (GMV) OF E-COMMERCE INDUSTRY, USD, UNITED STATES, 2017 - 2030
- Figure 4:
- SECTORAL SHARE IN E-COMMERCE INDUSTRY GROSS MERCHANDISE VALUE (GMV), SHARE %, UNITED STATES, 2023
- Figure 5:
- GROSS VALUE ADDED (GVA) OF MANUFACTURING INDUSTRY (IN CURRENT PRICES), USD, UNITED STATES, 2017 - 2023
- Figure 6:
- SECTORAL SHARE IN GROSS VALUE ADDED (GVA) OF MANUFACTURING INDUSTRY, SHARE %, UNITED STATES, 2023
- Figure 7:
- VALUE OF TRANSPORT AND STORAGE SECTOR GROSS DOMESTIC PRODUCT (GDP), USD, UNITED STATES, 2017 - 2023
- Figure 8:
- TRANSPORT AND STORAGE SECTOR GROSS DOMESTIC PRODUCT (GDP), SHARE % OF GDP, UNITED STATES, 2017 - 2023
- Figure 9:
- RANK OF LOGISTICS PERFORMANCE, RANK, UNITED STATES, 2010 - 2023
- Figure 10:
- SHARE OF ROAD LENGTH BY SURFACE CATEGORY, %, UNITED STATES, 2023
- Figure 11:
- SHARE OF ROAD LENGTH BY SURFACE CLASSIFICATION, %, UNITED STATES, 2023
- Figure 12:
- VALUE OF EXPORTS, USD, UNITED STATES, 2017 - 2023
- Figure 13:
- VALUE OF IMPORTS, USD, UNITED STATES, 2017 - 2023
- Figure 14:
- FUEL PRICE BY TYPE OF FUEL, USD/LITER, UNITED STATES, 2017 - 2023
- Figure 15:
- OPERATIONAL COSTS OF TRUCKING - BREAKDOWN BY OPERATING COST ELEMENT, %, UNITED STATES, 2023
- Figure 16:
- TRUCKING FLEET SIZE BY TYPE, SHARE %, UNITED STATES, 2023
- Figure 17:
- MARKET SHARE OF MAJOR TRUCK SUPPLIER BRANDS, SHARE %, UNITED STATES, 2023
- Figure 18:
- FREIGHT HANDLED BY ROAD TRANSPORT, TONS, UNITED STATES, 2017 - 2030
- Figure 19:
- PRICE TREND OF ROAD FREIGHT TRANSPORT SERVICE, USD/TON-KM, UNITED STATES, 2017 - 2023
- Figure 20:
- MODAL SHARE OF FREIGHT TRANSPORTATION SECTOR, SHARE % BY TON-KM, UNITED STATES, 2023
- Figure 21:
- MODAL SHARE OF FREIGHT TRANSPORT SECTOR, SHARE % BY TONS, UNITED STATES, 2023
- Figure 22:
- WHOLESALE PRICE INFLATION RATE, %, UNITED STATES, 2017 - 2023
- Figure 23:
- CONSUMER PRICE INFLATION RATE, %, UNITED STATES, 2017 - 2023
- Figure 24:
- VOLUME OF LESS THAN-TRUCK-LOAD (LTL) ROAD FREIGHT TRANSPORT MARKET, TON-KM, UNITED STATES, 2017 - 2030
- Figure 25:
- VALUE OF LESS THAN-TRUCK-LOAD (LTL) ROAD FREIGHT TRANSPORT MARKET, USD, UNITED STATES, 2017 - 2030
- Figure 26:
- VOLUME OF LESS THAN-TRUCK-LOAD (LTL) ROAD FREIGHT TRANSPORT MARKET BY END USER INDUSTRY, TON-KM, UNITED STATES, 2017 - 2030
- Figure 27:
- VALUE OF LESS THAN-TRUCK-LOAD (LTL) ROAD FREIGHT TRANSPORT MARKET BY END USER INDUSTRY, USD, UNITED STATES, 2017 - 2030
- Figure 28:
- VALUE SHARE OF LESS THAN-TRUCK-LOAD (LTL) ROAD FREIGHT TRANSPORT MARKET BY END USER INDUSTRY, %, UNITED STATES, 2017 - 2030
- Figure 29:
- VOLUME OF AFF INDUSTRY (AGRICULTURE, FISHING, AND FORESTRY) LESS THAN-TRUCK-LOAD (LTL) ROAD FREIGHT TRANSPORT MARKET, TON-KM, UNITED STATES, 2017 - 2030
- Figure 30:
- VALUE OF AFF INDUSTRY (AGRICULTURE, FISHING, AND FORESTRY) LESS THAN-TRUCK-LOAD (LTL) ROAD FREIGHT TRANSPORT MARKET, USD, UNITED STATES, 2017 - 2030
- Figure 31:
- VOLUME OF CONSTRUCTION INDUSTRY LESS THAN-TRUCK-LOAD (LTL) ROAD FREIGHT TRANSPORT MARKET, TON-KM, UNITED STATES, 2017 - 2030
- Figure 32:
- VALUE OF CONSTRUCTION INDUSTRY LESS THAN-TRUCK-LOAD (LTL) ROAD FREIGHT TRANSPORT MARKET, USD, UNITED STATES, 2017 - 2030
- Figure 33:
- VOLUME OF MANUFACTURING INDUSTRY LESS THAN-TRUCK-LOAD (LTL) ROAD FREIGHT TRANSPORT MARKET, TON-KM, UNITED STATES, 2017 - 2030
- Figure 34:
- VALUE OF MANUFACTURING INDUSTRY LESS THAN-TRUCK-LOAD (LTL) ROAD FREIGHT TRANSPORT MARKET, USD, UNITED STATES, 2017 - 2030
- Figure 35:
- VOLUME OF EXTRACTION INDUSTRY (OIL AND GAS, MINING AND QUARRYING) LESS THAN-TRUCK-LOAD (LTL) ROAD FREIGHT TRANSPORT MARKET, TON-KM, UNITED STATES, 2017 - 2030
- Figure 36:
- VALUE OF EXTRACTION INDUSTRY (OIL AND GAS, MINING AND QUARRYING) LESS THAN-TRUCK-LOAD (LTL) ROAD FREIGHT TRANSPORT MARKET, USD, UNITED STATES, 2017 - 2030
- Figure 37:
- VOLUME OF DISTRIBUTIVE TRADE INDUSTRY (WHOLESALE AND RETAIL TRADE) LESS THAN-TRUCK-LOAD (LTL) ROAD FREIGHT TRANSPORT MARKET, TON-KM, UNITED STATES, 2017 - 2030
- Figure 38:
- VALUE OF DISTRIBUTIVE TRADE INDUSTRY (WHOLESALE AND RETAIL TRADE) LESS THAN-TRUCK-LOAD (LTL) ROAD FREIGHT TRANSPORT MARKET, USD, UNITED STATES, 2017 - 2030
- Figure 39:
- VOLUME OF OTHER END USER INDUSTRIES LESS THAN-TRUCK-LOAD (LTL) ROAD FREIGHT TRANSPORT MARKET, TON-KM, UNITED STATES, 2017 - 2030
- Figure 40:
- VALUE OF OTHER END USER INDUSTRIES LESS THAN-TRUCK-LOAD (LTL) ROAD FREIGHT TRANSPORT MARKET, USD, UNITED STATES, 2017 - 2030
- Figure 41:
- VOLUME OF LESS THAN-TRUCK-LOAD (LTL) ROAD FREIGHT TRANSPORT MARKET BY DESTINATION, TON-KM, UNITED STATES, 2017 - 2030
- Figure 42:
- VALUE OF LESS THAN-TRUCK-LOAD (LTL) ROAD FREIGHT TRANSPORT MARKET BY DESTINATION, USD, UNITED STATES, 2017 - 2030
- Figure 43:
- VALUE SHARE OF LESS THAN-TRUCK-LOAD (LTL) ROAD FREIGHT TRANSPORT MARKET BY DESTINATION, %, UNITED STATES, 2017 - 2030
- Figure 44:
- VOLUME OF DOMESTIC LESS THAN-TRUCK-LOAD (LTL) ROAD FREIGHT TRANSPORT MARKET, TON-KM, UNITED STATES, 2017 - 2030
- Figure 45:
- VALUE OF DOMESTIC LESS THAN-TRUCK-LOAD (LTL) ROAD FREIGHT TRANSPORT MARKET, USD, UNITED STATES, 2017 - 2030
- Figure 46:
- VOLUME OF INTERNATIONAL LESS THAN-TRUCK-LOAD (LTL) ROAD FREIGHT TRANSPORT MARKET, TON-KM, UNITED STATES, 2017 - 2030
- Figure 47:
- VALUE OF INTERNATIONAL LESS THAN-TRUCK-LOAD (LTL) ROAD FREIGHT TRANSPORT MARKET, USD, UNITED STATES, 2017 - 2030
- Figure 48:
- MOST ACTIVE COMPANIES BY NUMBER OF STRATEGIC MOVES, COUNT, UNITED STATES, 2017 - 2023
- Figure 49:
- MOST ADOPTED STRATEGIES, COUNT, UNITED STATES, 2017 - 2023
- Figure 50:
- VALUE SHARE OF MAJOR PLAYERS, %, UNITED STATES
United States Less than-Truck-Load (LTL) Industry Segmentation
Agriculture, Fishing, and Forestry, Construction, Manufacturing, Oil and Gas, Mining and Quarrying, Wholesale and Retail Trade, Others are covered as segments by End User Industry. Domestic, International are covered as segments by Destination.| End User Industry | Agriculture, Fishing, and Forestry |
| Construction | |
| Manufacturing | |
| Oil and Gas, Mining and Quarrying | |
| Wholesale and Retail Trade | |
| Others | |
| Destination | Domestic |
| International |
Need A Different Region or Segment?
Customize Now
Market Definition
- Agriculture, Fishing, and Forestry (AFF) - This end user industry segment captures the external (outsourced) logistics expenditure incurred by the AFF industry players on road freight transport service. The end user players considered are the establishments primarily engaged in growing crops, raising animals, harvesting timber, harvesting fish & other animals from their natural habitats and providing related support activities. Herein, across the value chain, Logistics Service Providers (LSPs) play a crucial role in acquisition, storage, handling, transportation, and distribution activities for the optimal & continuous flow of inputs (seeds, pesticides, fertilizers, equipment, and water) from manufacturers or suppliers to the producers and smooth flow of output (produce, agro-goods) to distributors/ consumers. This includes both termperature controlled and non-temperature controlled logistics, as and when required according to the shelf life of goods being transported or stored.
- Construction - This end user industry segment captures the external (outsourced) logistics expenditure incurred by the construction industry players, on road freight transport service. The end user players considered are the establishments primarily engaged in constructing, repairing and renovating residential & commercial buildings, infrastructure, engineering works, subdividing and developing land. Logistics Service Providers (LSPs) play a crucial role in increasing profitability of construction projects by maintaing the inventory of raw materials & equipment, time-critical supplies and by providing other value added services for effective project management.
- Containerized Road Freight Transport - The segment captures the external (outsourced) logistics expenditure incurred by the road freight transport service end users on Full-Truck-Load (FTL) services. FTL road freight transport is characterized as a full single load not combined with other shipments. It comprises of shipments (i) devoted to the goods of a single shipper (ii) taken directly from a point of origin to one or more destination points (iii) comprising of bulk mail truck transportation (iv) comprising of both Container (Full Container Load, FCL)/Non-Container trucking services (v)comprsing of goods requiring temperature controlled or non-temperature controlled transportation services (vi) comprising of bulk liquid tankering (vii) invoving trucking of waste (viii) hazardous material trucking. Related value added services (VAS) of sorting, consolidation, deconslidation are included in the other services segment of freight and logistics market.
- Export Trends and Import Trends - Overall logistics performance of an economy is positively and significantly (statistically) correlated to its trade performance (exports and imports). Hence, in this industry trend, total value of trade, major commodities/ commodity groups and the major trade partners, for the studied geography (country or region as per the scope of report) have been analysed alongside the impact of major trade/logistics infrastructure investments & regulatory environment.
- Fluid Goods - The segment captures the external (outsourced) logistics expenditure incurred by the road freight transport service end users for the transport of bulk liquids, that are often used in extraction, manufacturing, food processing, agriculture industries among others. It includes transportation of liquids like (i) Chemicals/ hazardous goods (for instance acids) (ii) Water (potable as well as waste) (iii) Oil and gas (upstream as well as downstream like gasoline, fuel, crude oil, or propane), (iv) Food grade bulk liquids (like milk, or juice), (v) Rubber, (vi) Agrichemical products, among others. These goods are generally transported through tanker trucking.
- Fuel Price - Fuel price spikes can cause delays and diruption for logistics service providers (LSPs), while drops in the same can result in higher short-term profitability and increased market rivalry to offer consumers with the best deals. Hence, the fuel price variations have been studied over the review period and presented along with the causes as well as market impacts.
- Full-Truck-Load (FTL) Road Freight Transport - The segment captures the external (outsourced) logistics expenditure incurred by the road freight transport service end users on Full-Truck-Load (FTL) services. FTL road freight transport is characterized as a full single load not combined with other shipments. It comprises of shipments (i) devoted to the goods of a single shipper (ii) taken directly from a point of origin to one or more destination points (iii) comprising of bulk mail truck transportation (iv) comprising of both Container (Full Container Load, FCL)/Non-Container trucking services (v)comprsing of goods requiring temperature controlled or non-temperature controlled transportation services (vi) comprising of bulk liquid tankering (vii) invoving trucking of waste (viii) hazardous material trucking. Related value added services (VAS) of sorting, consolidation, deconslidation are included in the other services segment of freight and logistics market.
- GDP Distribution by Economic Activity - Nominal Gross Domestic Product and distribution of the same, across major economic sectors in the geography studied (country or region as per scope of the report) have been studied and presented in this industry trend. As GDP is positively related to the profitability and growth of logistics industry, this data has been used in adjunction to the input-output tables/ supply-use tables for analyzing the potential major contributing sectors towards the logistics demand.
- GDP Growth by Economic Activity - Growth of Nominal Gross Domestic Product across major economic sectors, for the geography studied (country or region as per scope of the report) have been presented in this industry trend. This data has been utilized for assessing the growth of logistics demand from all the market end users (economic sectors considered here).
- Inflation - Variations in both Wholesale Price Inflation (YoY change in producer price index) and Consumer Price Inflation have been presented in this industry trend. This data has been used to assess the inflationary environment as it plays a vital role in smooth functioning of the supply chain, directly impacting the logistics operational cost components e.g., pricing of tyres, driver wages & benefits, energy/fuel prices, maintenace costs, toll charges, warehousing rents, custom brokerage, forwarding rates, courier rates etc. hence impacting the overall freight and logistics market.
- Key Industry Trends - The report section named "Key Industry Trends" include all the key variables/parameters studied to better analyze the market size estimates and forecasts. All the trends have been presented in the form of data points (time series or latest available data points) along with analysis of the paramter in the form of concise market relevant commentary, for the geography studied (country or region as per the scope of report).
- Key Strategic Moves - The action taken by a company to differentiate from its competitor or used as a general strategy is referred to as a key strategic move (KSM). This includes (1) Agreements (2) Expansions (3) Financial Restructuring (4) Mergers and Acquisitions (5) Partnerships, and (6) Product Innovations. Key players (Logistics Service Providers, LSPs) in the market have been shortlisted, their KSM have been studied and presented in this section.
- Less than-Truck-Load (LTL) Road Freight Transport - The segment captures the external (outsourced) logistics expenditure incurred by the road freight transport service end users on Less than-Truck-Load (LTL) services. LTL road freight transport is characterized as multiple shipments combined onto a single truck for multiple deliveries within a network. It comprises of establishments (i) primarily engaged in general and specialized freight trucking of less than complete truck-loads, (ii) characterized by the use of terminals to consolidate shipments, generally from several shippers, into a single truck for haulage between a load assembly terminal and a disassembly terminal, where the load is sorted and shipments are re-routed for delivery (iv) Less than-Container-Load (LCL) shipping/ Groupage Shipping in case of trucking services. The activities in scope include (i) local pick-up, (ii) line-haul, and (iii) local delivery. Related value added services (VAS) of sorting, consolidation, deconslidation are included in the other services segment of freight and logistics market.
- Logistics Performance - Logistics Performance and Logistics Costs are the backbone of trade, and influences trade costs, making countries compete globally. Logistics performance is influenced by market wide adopted supply chain management strategies, government services, investments & policies, fuel/ energy costs, inflationary environment etc. Hence, in this industry trend, the logistics performance of the geography studied (country/ region as per the scope of report) has been analysed and presented over the review period.
- Major Truck Suppliers - Market share of truck brands is influenced by factors like geographical preferences, portfolio of truck types, truck prices, local production, truck repair & maintenance service peneteration, customer support, technological innovations (like electric vehicles, digitalization, autonomous trucks), fuel efficiency, financing options, annual maintenance costs, availability of substitutes, marketing startegies etc. Hence, the distribution (share % for base year of the study) of truck sales volume for leading truck brands and commentary on current market scenario & market anticipation over the forecast period have been presented in this industry trend.
- Manufacturing - This end user industry segment captures the external (outsourced) logistics expenditure incurred by the Manufacturing industry players, on road freight transport service. The end user players considered are the establishments primarily engaged in the chemical, mechanical or physical transformation of materials or substances into new products. Logistics Service Providers (LSPs) play a crucial role in maintaining a smooth flow of raw materials across the supply chain, enabling timely delivery of finished goods to distributors or end customers and storing & supplying the raw materials to clients for just-in-time manufacturing.
- Modal Share - Freight Modal Share is influenced by factors like modal productivity, government regulations, containerization, distance of shipment, temperature control requirements, type of goods, international trade, terrain, speed of delivery, shipment weight, bulk shipments, etc. Also, modal share by tonnage (tons) and modal share by freight turnover (ton-km) differ as per average distance of shipments, weight of major commodity groups transported in the economy and number of trips. This industry trend represents the distribution of freight transported by mode of transport (tons as well as ton-km), for the study base year.
- Oil and Gas, Mining and Quarrying - This end user industry segment captures the external (outsourced) logistics expenditure incurred by the extraction industry players, on road freight transport service. The end user players considered are the establishments that extract naturally occurring mineral solids, such as coal and ores; liquid minerals, such as crude petroleum; and gases, such as natural gas. Logistics Service Providers (LSPs) covers entire phases from upstream to downstream and plays a crucial role in the transportation of machinery, drilling equipments, extracted minerals, crude oil & natural gas and refined/ processed products from one place to another.
- Other End Users - Other end user segment captures the external (outsourced) logistics expenditure incurred by the financial services (BFSI), real estate, educational services, healthcare, and professional services (administrative, waste management, legal, architectural, engineering, design, consulting, scientific R&D), on road freight transport service. Logistics Service Providers (LSPs) plays a crucial role in the reliable movement of supplies and documents to/from these industries such as transporting any equipment or resources required, shipping confidential documents and files, movement of medical goods & supplies (surgical supplies and instruments, including gloves, masks, syringes, equipment) to name a few.
- Producer Price Inflation - It indicates inflation from viewpoint of the producers viz. the average selling price received for their output over a period of time. Annual change (YoY) of producer price index is reported as wholesale price inflation in the "Inflation" industry trend. As WPI captures dynamic price movements in most comprehensive way, it is widely used by governments, banks, industry, business circles and is deemed important in formulation of trade, fiscal and other economic policies. The data has been used in adjunction to consumer price inflation for better understanding the inflationary environment.
- Road Freight Pricing Trends - Freight pricing by mode of transport (USD/tonkm), over the review period, has been presented in this industry trend. The data has been used in assessing the inflationary environment, impact on trade, freight turnover (tonkm), road freight transport market demand and hence the road freight transport market size.
- Road Freight Tonnage Trends - Freight tonnage (weight of goods in tons) handled by mode of transport, over the review period, has been presented in this industry trend. The data has been used as one of the parameters apart from average distance per shipment (km), freight volume (tonkm), and freight pricing (USD/tonkm) to assess the freight transport market size.
- Road Freight Transport - Hiring a road freight transport logistics service provider (LSP) or haulier (outsourced logistics), for the transport of commodities constitutes road freight transport market. The scope of study includes (i) road transport of goods reported by hauliers registered in the reporting countries (ii) transport of raw materials or manufactured goods (solids as well as fluids) (iii) transport using commerical motor vehicles (rigid trucks or tractor-trailers, (iv) Full-Truck-Load (FTL) or Less than-Truck-Load (LTL) transport (v) containerized or non-containerized transport (vi) temperature controlled or non-temperature controlled trasnport, (vii) short haul or long haul (Over-the-road, OTR) transport, (viii) used office or household goods transport (movers and packers), (ix) other specialized cargo transport (dangerous goods, oversized cargo) and (x) outsourced first mile/ middle mile/last mile delivery shipments undertaken by road freight transport players. The scope does not include (i) transport undertaken by hauliers registered in other countries (ii) last mile meal delivery market (iii) grocery delivery market (iv) transportation via road network undertaken/ reported by Courier, Express, and Parcel (CEP) players.
- Road Length - As infrastructure plays a vital role in an economy's logistics performance, variables like length of roads, distribution of road length by surface category (paved v/s unpaved), distribution of road length by road classification (expressways v/s highways v/s other roads), have been analysed and presented in this industry trend.
- Segmental Revenue - Segmental Revenue has been triangulated or computed and presented for all the major players in the market. It refers to the road freight transport market specific revenue earned by the company, over the base year of study, in the geography studied (country or region as per the scope of report). It is computed through the study and analysis of major parameters like financials, service portfolio, employee strength, fleet size, investments, number of countries present in, major economies of concern, etc. that have been reported by the company in its annual reports, webpage. For companies having scarce financial disclosures, paid databases like D&B Hoovers, Dow Jones Factiva have been resorted to and verified through industry/expert interactions.
- Short Haul Road Freight Transport - The segment captures the external (outsourced) logistics expenditure incurred by the road freight transport service end users on local trucking (less than 100 miles). It includes the road transport of goods (i) within a single administrative area and its hinterland, (ii) by smaller trucks and pickup trucks (iii) via containerized as well as dry bulk services (iv) intermodal from ports, container terminals or airports, and (v) outsourced first mile/ last mile delivery shipments undertaken by road freight transport players.
- Transport and Storage Sector GDP - Value and growth of Transport and Storage Sector GDP has a direct relation to the freight and logistics market size, and hence road freight transport market size. Therefore, this variable has been studied and presented over the review period, in value terms (USD) and as share % of total GDP, in this industry trend. The data has been supported by concise and relevant commentary around the investments, developments, and current market scenario.
- Trends in E-Commerce Industry - Enhanced internet connectivity and boom in smartphone penetration, coupled with increasing disposable incomes, has led to a phenomenal growth in the e-commerce market globally. Online shoppers require fast and efficient delivery of their orders leading to an increase in the demand for logistics services especially e-commerce fulfilment services. Hence, the Gross Merchandise Value (GMV), historial and projected growth, breakup of major commodity groups in e-commerce industry for the studied geography (country or region as per scope of the report) have been analysed and presented in this industry trend.
- Trends in Manufacturing Industry - Manufacturing industry involves the transformation of raw materials into finished products, while logistics industry ensures the efficient flow of raw materials to the factory, and the transport of manufactured products to the distributors & consumers. Demand-Supply of both industries are highly cross-linked and critical for a seamless supply chain. Hence, the Gross Value Added (GVA), breakup of GVA into major manufacturing sectors, and growth of manufacturing industry over the review period have been analysed and presented, in this industry trend.
- Trucking Fleet Size By Type - Market share of truck types is influenced by factors like geographical preferences, major end user industries, truck prices, local production, truck repair & maintenance service peneteration, customer support, technological disruptions (like electric vehicles, digitalization, autonomous trucks) etc. Hence, the distribution (share % for base year of study) of truck parc volume by type of truck, market disruptors, truck manufacturing investments, truck specifications, truck use & import regulations, and market anticipation over the forecast period have been presented in this industry trend.
- Trucking Operational Costs - The prime reasons for measuring/ benchmarking logistics performance of any trucking company are to reduce operational costs and increase profitability. On the other hand, measuring operational costs helps to identify whether and where to make operational changes to control expenses and identify areas for improved performance. Hence, in this industry trend, trucking operational costs and the variables involved viz. driver wages & benefits, fuel prices, repairs & maintenance costs, tyre costs etc. have been studied over the base year of study, and presented for the geography studied (country or region as per the scope of report).
- Wholesale and Retail Trade - This end user industry segment captures the external (outsourced) logistics expenditure incurred by the wholesalers and retailers, on road freight transport service. The end user players considered are the establishments primarily engaged in wholesaling or retailing merchandise, generally without transformation, and rendering services incidental to the sale of merchandise. Logistics Service Providers (LSPs) plays a crucial role in the reliable movement of supplies to and finished products from production houses to the distributors and finally to the end customer covering activites like material sourcing, transportation, order fulfillment, warehousing & storage, demand forecasting, inventory management etc.
| Keyword | Definition |
|---|---|
| Cabotage | Road transport by a motor vehicle registered in a country performed on the national territory of another country. |
| Cross Docking | Cross docking is a logistics procedure where products from a supplier or manufacturing plant are distributed directly to a customer or retail chain with marginal to no handling or storage time. Cross docking takes place in a distribution docking terminal; usually consisting of trucks and dock doors on two (inbound and outbound) sides with minimal storage space. The name ‘cross docking’ explains the process of receiving products through an inbound dock and then transferring them across the dock to the outbound transportation dock. |
| Cross Trade | International road transport between two different countries performed by a road motor vehicle registered in a third country. A third country is a country other than the country of loading/embarkation and than the country of unloading/disembarkation. |
| Dangerous Goods | The classes of dangerous goods carried by Road are those defined by the fifteenth revised edition of the UN Recommendations on the Transport of Dangerous Goods, United Nations, Geneva 2007. They include Class 1: Explosives; Class 2: Gases; Class 3: Flammable Liquids; Class 4: Flammable solids- substances liable to spontaneous combustion; substances which, on contact with water, emit flammable gases; Class 5: Oxidizing substances and organic peroxides; Class 6: Toxic and infectious substances; Class 7: Radioactive material and Class 8: Corrosive substances, Class 9: Miscellaneous dangerous substances and articles. |
| Direct Shipment | Direct shipment is a method of delivering goods from the supplier or the product owner to the customer directly. In most cases, the customer orders the goods from the product owner. This delivery scheme reduces transportation and storage costs, but requires additional planning and administration. |
| Drayage | A drayage is a form of trucking service that connects the different modes of shipping (intermodal), such as ocean freight or air freight. It’s a short-haul trip that transports goods from one place to another, usually before or after its long-haul shipping process. Drayage trucks move cargo to and from various destinations, such as container ships, storage lots, order fulfillment warehouses, and rail yards. Typically, drayage only transports goods in short distances and operates only in one metropolitan area. It also requires only one trucker in a single shift. But despite this, but it plays an important role in long-haul shipping because it gets the goods to the cargo and vice versa. It makes intermodal transport much more efficient and enables the seamless transfer of goods to the end customer. |
| Dry van | A dry van is a type of semi-trailer that's fully enclosed to protect shipments from outside elements. Designed to carry palletized, boxed or loose freight, dry vans aren't temperature-controlled (unlike refrigerated “reefer” units) and can't carry oversized shipments (unlike flatbed trailers). |
| Final Demand | Final demand includes all types of commodities (goods as well as services) consumed as final use and might include personal consumption, or consumption by government, by businesses as capital investment, and as exports. includes all types of commodities (goods as well as services) consumed as final use and might include personal consumption, or consumption by government, by businesses as capital investment, and as exports. |
| Flatbed Truck | A flatbed truck is a type of truck with rigid design. It has a back body that is flatly shaped for easy loading and unloading of goods. The flatbed truck is mostly used to transport heavy, oversized, wide and indelicate goods such as machinery, building supplies or equipment. Due to the truck open body, the goods transported with it must not be vulnerable to rain. By functionality, the flatbed truck is comparable to a flatbed trailer. |
| Inbound Logistics | Inbound logistics is the way materials and other goods are brought into a company. This process includes the steps to order, receive, store, transport and manage incoming supplies. Inbound logistics focuses on the supply part of the supply-demand equation. |
| Intermediate Demand | Intermediate demand includes goods, services, and maintenance and repair construction sold to businesses, excluding capital investment. |
| International Loaded | Place of loading of goods in reporting country (i.e., country in which the vehicle performing the transport is registered) and place of unloading in a different country. |
| International Unloaded | Place of unloading of goods in reporting country (i.e., country in which the vehicle performing the transport is registered) and place of loading in a different country. |
| OOG cargo | Out of Gauge (OOG) cargo is any cargo that can not be loaded into six-sided shipping containers simply because it is too large. The term is a very loose classification of all cargo with dimensions beyond the maximum 40HC container dimensions. That is a length beyond 12.05 meters – a width beyond 2.33 meters – or a height beyond 2.59 meters. |
| Pallets | Raised platform, intended to facilitate the lifting and stacking of goods. |
| Part load | A part load describes goods which only fills a truck partially. In essence, the quantity of the shipment is bigger than the Less Than Truckload (LTL) shipment. Also, the shipment cannot fully occupy a truck i.e. its capacity is much lower than a Full Truckload (FTL) shipment. |
| Paved Road | Road surfaced with crushed stone (macadam) with hydrocarbon binder or bituminized agents, with concrete or with cobblestone. |
| Reverse Logistics | Reverse logistics comprises of the sector of supply chains that process anything returning inwards through the supply chain or traveling ‘backward’ through the supply chain. |
| Road Freight Transport Service | Hiring a trucking agency for transport of commodities (raw materials or manufactured goods including both solids and liquids) form the origin to a destination within the country (domestic) or cross-border (international) constitutes road freight transport market. The service might be Full-Truck-Load or Less than-Truck-Load, containerized or non-containerized, temperature controlled or non temperature controlled, short haul or long haul. |
| Tautliner vehicle | Tautliner and curtainsider are used as generic names for curtain sided trucks/trailers. The curtains are permanently fixed to a runner at the top and detachable rails/poles at front and rear, allowing the curtains to be drawn open and forklifts used all along the sides for easy and efficient loading and unloading. When closed for travel, vertical load restraint straps are attached to a rope rail beneath the truck bed, connecting the truck bed and curtain along both sides. Winches at either end of the curtain tension it, hence the 'Tautliner' name. This stops the curtain from flapping or drumming in the wind and can also help retain light loads from slipping sideways. |
| Transport for hire or reward | The carriage for remuneration of goods. |
| Unpaved Road | Road with a stabilized base not surfaced with crushed stone, hydrocarbon binder or bituminized agents, concrete or cobblestone. |
Need More Details on Market Definition?
Ask a Question
Research Methodology
Mordor Intelligence follows a four-step methodology in all our reports.
- Step-1: Identify Key Variables: In order to build a robust forecasting methodology, the variables and factors identified in Step-1 are tested against available historical market numbers. Through an iterative process, the variables required for market forecast are set and the model is built on the basis of these variables.
- Step-2: Build a Market Model: Market-size estimations for the forecast years are in nominal terms. Inflation is considered to be a part of the pricing, and the average selling price (ASP) is varying throughout the forecast period for each country
- Step-3: Validate and Finalize: In this important step, all market numbers, variables and analyst calls are validated through an extensive network of primary research experts from the market studied. The respondents are selected across levels and functions to generate a holistic picture of the market studied.
- Step-4: Research Outputs: Syndicated Reports, Custom Consulting Assignments, Databases & Subscription Platforms

Get More Details On Research Methodology
Download PDF


